

TR-100E Operating Manual
NOVATEK-ELECTRO LLC
intelligent industrial electronics
DIGITAL TEMPERATURE RELAY TR-100E
Section titled “DIGITAL TEMPERATURE RELAY TR-100E”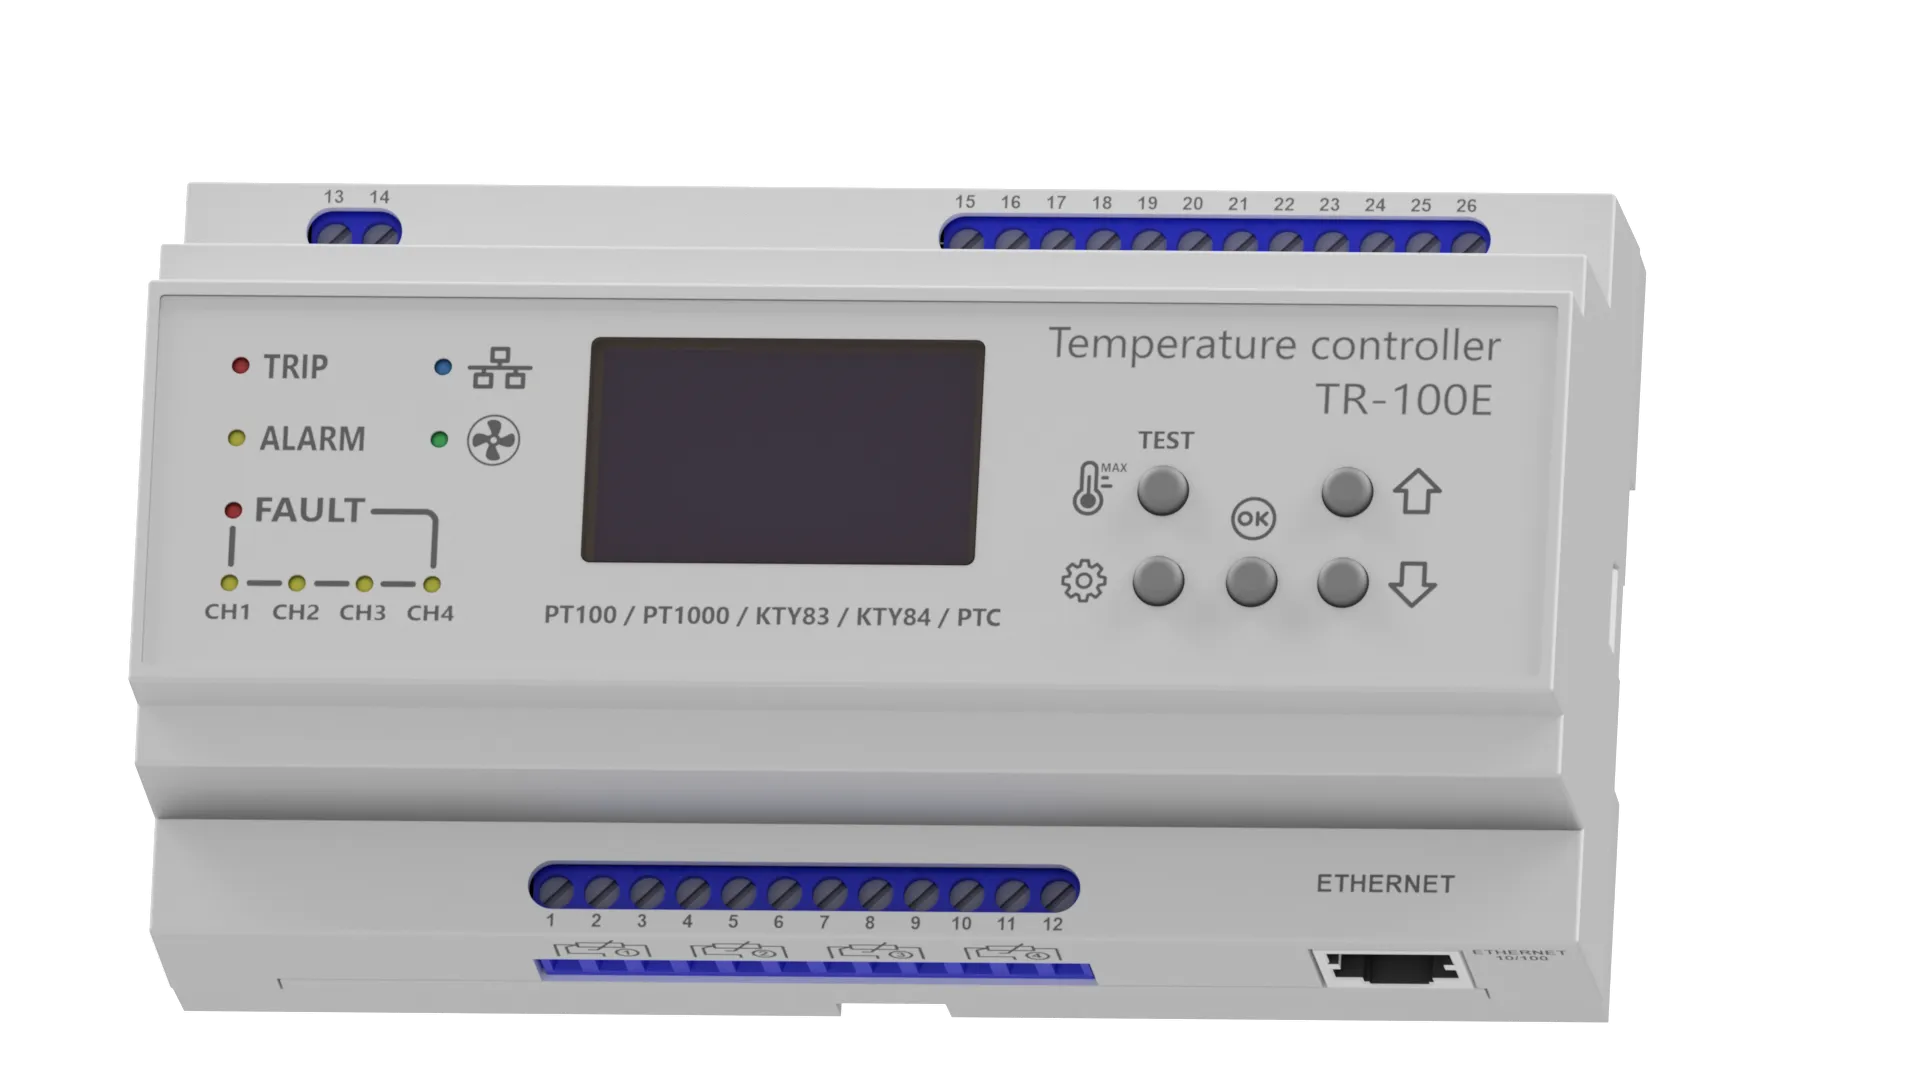
OPERATING MANUAL (PASSPORT)
Section titled “OPERATING MANUAL (PASSPORT)”This operating manual is intended to familiarize the user with the device, operating principle, operating rules, and setup of the TR-100E temperature relay.
During operation and maintenance, the requirements of the following regulatory documents must be observed:
- “Rules for Technical Operation of Consumer Electrical Installations”;
- “Safety Rules for Operation of Consumer Electrical Installations”, “Occupational Safety in the Operation of Electrical Installations”.
Connection and maintenance of the product must be performed by qualified specialists who have studied this Operating Manual.
If the operating rules are observed, the product is safe to use.
TERMS AND ABBREVIATIONS
Section titled “TERMS AND ABBREVIATIONS”TABLE OF CONTENTS
Section titled “TABLE OF CONTENTS”- DIGITAL TEMPERATURE RELAY TR-100E
- OPERATING MANUAL (PASSPORT)
- TERMS AND ABBREVIATIONS
- TABLE OF CONTENTS
- 1 PURPOSE AND TECHNICAL CHARACTERISTICS
- 2 INTENDED USE
- 2.1 Preparation of the TR-100E for Use
- 2.2 Use of the TR-100E
- 2.2.1 Operating Principle
- 2.2.2 Event Log
- 2.2.3 Temperature Logger
- 2.2.4 Control of the TR-100E
- 2.2.5 Parameter Modification (Settings Menu)
- 2.2.6 Restoring Factory Settings
- 2.2.7 Diagnostic Mode and Testing of the TR-100E
- 2.2.8 Updating the Embedded Software (Firmware)
- 2.2.9 Setting the Date, Time, and Time Zone
- 2.3 Programmable and Used TR-100E Parameters
- 2.4 Use of the Web Interface
- 2.5 Use of WireGuard VPN
- 2.6 Use of Modbus TCP
- 2.7 Network Ports
- 3 MAINTENANCE
- 4 SERVICE LIFE AND MANUFACTURER’S WARRANTY
- 5 TRANSPORTATION AND STORAGE
1 PURPOSE AND TECHNICAL CHARACTERISTICS
Section titled “1 PURPOSE AND TECHNICAL CHARACTERISTICS”1.1 Purpose of the Product
Section titled “1.1 Purpose of the Product”The TR-100E digital temperature relay (hereinafter referred to as the TR-100E) is intended for measuring and monitoring the temperature of an object using four sensors connected in a two-wire or three-wire configuration.
The TR-100E displays the measured temperature values on the display, monitors sensor lines for open circuit and short circuit, generates control signals for “Trip”, “Alarm”, “Fault”, and “Fan”, maintains an event log (up to 2048 records) and temperature logging with a specified interval (up to 16384 records), and also provides a Web interface.
If necessary, the TR-100E can be connected to a higher-level system (SCADA) via the Modbus TCP protocol or Web API.
The TR-100E has a universal power supply: 24-250 V AC/DC.
Main features:
- 4 monitoring zones (3 windings, 1 core);
- 4 output relays 8 A, 250 VAC (Trip relay, Alarm relay, Fan relay, and Fault relay);
- Monochrome LCD 128x64 dots;
- LED status indication;
- front-panel control buttons;
- Real-time clock (RTC) with 7-day autonomous power backup;
- Event log with 2048 records;
- Temperature logger with 16384 records;
- Ethernet port 10/100 Mbps;
- NTP time synchronization;
- built-in web server for remote access to data and settings;
- Support for a wide range of temperature sensors: Pt100/Pt1000, Ni100/Ni1000, Cu100, Ptc1000/EKS111, KTY83, KTY84, PTC minika.
1.2 Technical Characteristics
Section titled “1.2 Technical Characteristics”The main technical characteristics are given in Table 1.
Table 1 - main technical characteristics
| Parameter | Value |
|---|---|
| Inputs | |
| Number of measurement channels | 4 |
| Sensor connection scheme | two-wire or three-wire |
| Measured temperature range, °C | from minus 40 to +240 (depends on sensor type) |
| Measurement period for all channels, s | not more than 0.5 |
| Accuracy class | 0.25 |
| Resolution, °C | 0.1 |
| Sensor measurement current, mA | 1.0 |
| Wire resistance compensation | Automatic in three-wire configuration |
| (not more than 20 Ω for each wire) | |
| Wire length, m | two-wire up to 5 |
| three-wire up to 10 | |
| Monitoring of sensor line break/short circuit | Yes |
| Supported sensor types: | --- |
| Pt100/Pt1000 (W₁₀₀=1.3850 / W₁₀₀=1.3910) | from minus 40 to +240 °C |
| Ni100/Ni1000 (W₁₀₀=1.6178) | from minus 40 to +180 °C |
| Cu100 (W₁₀₀=1.4274) | from minus 40 to +200 °C |
| Ptc1000/EKS111 (W₁₀₀=2.0805) | from minus 40 to +100 °C |
| KTY83 (R₂₅=1000 Ω), models 110/120/150 | from minus 40 to +175 °C |
| KTY84 (R₁₀₀=1000 Ω), models 130/150 | from minus 40 to +200 °C |
| PTC Minika (NAT=60…180 °C) | from 60 to 180 °C |
| Outputs | |
| Number of relays, pcs. | 4 |
| Contact type | SPDT (changeover contact) |
| Maximum current at 250 VAC, A | 8 |
| Maximum current at 30 VDC, A | 3 |
| Maximum voltage, V | 440 AC |
| Maximum switching power, VA | 2500 |
| Service life at 8 A 250 VAC, cycles | not less than 100000 |
| Service life at 3 A 30 VDC, cycles | not less than 100000 |
| Utilization category according to IEC 60947-5-1 | AC-15 |
| Power supply | |
| Rated supply voltage, V | 24-250 AC/DC |
| Supply voltage range, V (DC) | 20-100 |
| Supply voltage range, V (AC) | 24-265 |
| Alternating current frequency (AC), Hz | 47 - 63 |
| Power consumption, VA | not more than 10 |
| Event log and logging | |
| Event log capacity, records | 2048 |
| Logger capacity, records | 16384 |
| Logging time, s | 5-3600 |
| Communication interfaces | |
| Ethernet | 10/100 Mbps, RJ-45, Modbus TCP, Web API |
| Indication and input/output | |
| LCD | 128x64 dots |
| LED indication | 9 indicators |
| Control buttons | 5 buttons |
| Additional functions | |
| Real-time clock (RTC) | Yes, with 7-day autonomous power backup |
| NTP time synchronization | Yes |
| Built-in web server | Yes |
| Restriction of access to settings | Yes, with password |
| Output relay test | Yes |
| Indication test | Yes |
| Firmware update via Ethernet | Yes |
| General characteristics | |
| Microcontroller architecture | 32-bit ARM |
| Data retention time, years | not less than 15 |
| Degree of protection | enclosure IP30, terminals IP20 |
| Protection class against electric shock | II |
| Climatic version | UHL3.1 |
| Weight, kg | not more than 0.5 |
| Overall dimensions (LxWxH), mm | 157x86x58 |
| Overvoltage category | II |
| Rated insulation voltage, V | 450 |
| Rated impulse withstand voltage, kV | 2.5 |
| Cross-section of connected wires, mm² | from 0.5 to 2 |
| Terminal tightening torque, N·m | 0.4 |
| Terminal type | screw, with spring clamp |
| Mounting on DIN rail | 35 mm |
| Mounting position | any |
1.3 Operating Conditions
Section titled “1.3 Operating Conditions”The TR-100E is intended for operation under the following conditions:
- Ambient temperature: from minus 20 to +50 °C;
- Storage temperature: from minus 30 to +60 °C;
- Relative air humidity (at +25 °C): 30 … 80%;
- Permissible pollution degree: II;
- Atmospheric pressure: from 84 to 106.7 kPa.
1.4 Appearance and Overall Dimensions
Section titled “1.4 Appearance and Overall Dimensions”Figure 1 shows the appearance and overall dimensions of the TR-100E.
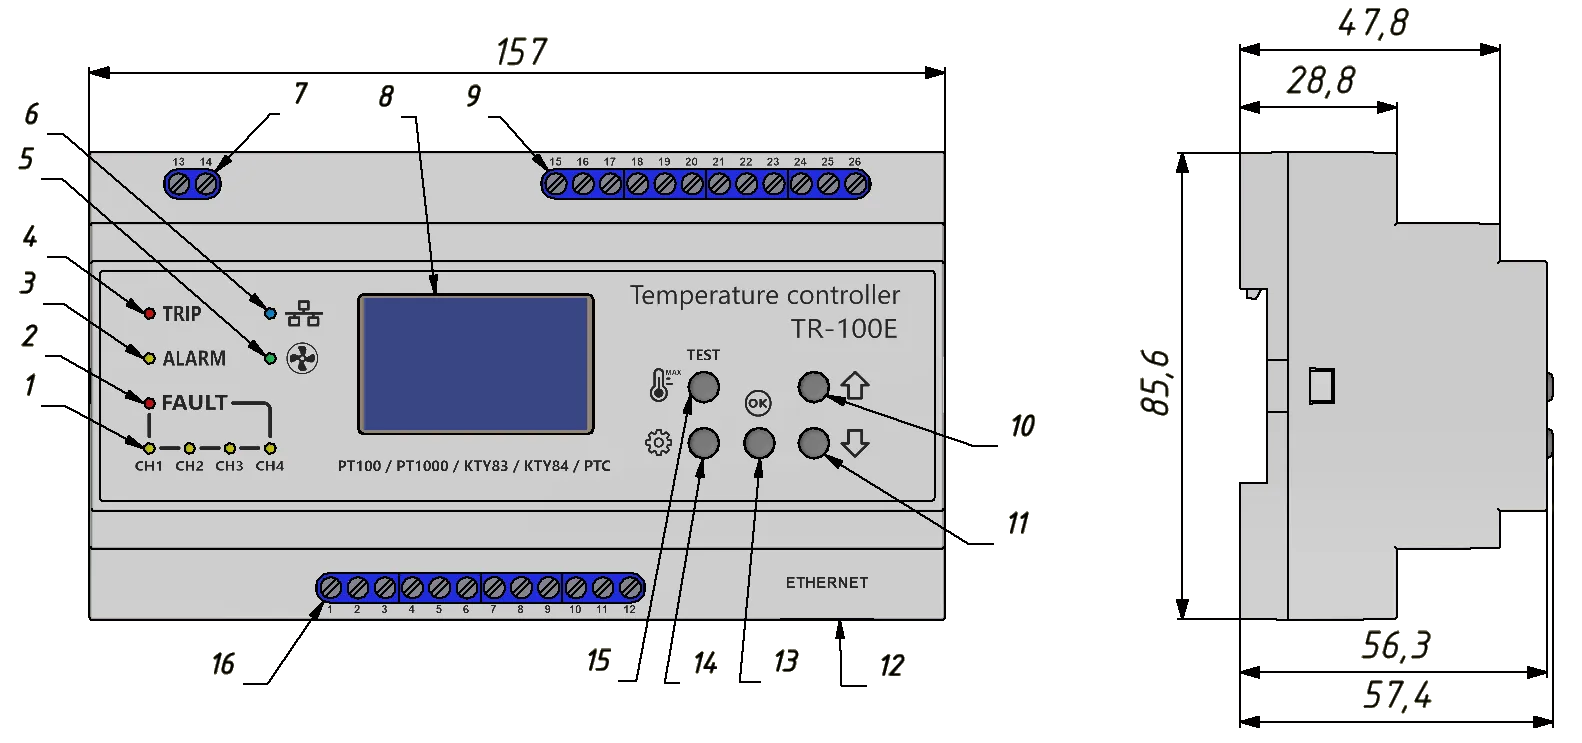
- LED indicators of the channels: “Channel 1”, “Channel 2”, “Channel 3”, “Channel 4” (CH1, CH2, CH3, CH4);
- “Fault” LED indicator (FAULT);
- “Alarm” LED indicator (ALARM);
- “Trip” LED indicator (TRIP);
- “Fan” LED indicator (FAN);
- “Ethernet link” LED indicator (LINK);
- Terminals for connecting the 24-250 V AC/DC power supply;
- LCD 128x64 dots;
- Output relay terminals: “Trip”, “Alarm”, “Fan”, “Fault” (TRIP, ALARM, FAN, FAULT);
- “Up” button (UP);
- “Down” button (DOWN);
- Connector for Ethernet RJ-45;
- “Enter” button (SET);
- “Menu” button (MENU);
- “Test” button (TEST);
- Terminals for connecting temperature sensors.
Figure 1 - appearance and overall dimensions
1.5 Temperature Sensors
Section titled “1.5 Temperature Sensors”The TR-100E supports the following types of temperature sensors: Pt100/Pt1000, Ni100/Ni1000, Cu100, Ptc1000/EKS111, KTY83, KTY84, and PTC minika.
Pt100 / Pt1000 - platinum resistance temperature detectors with nominal resistance of 100 Ω and 1000 Ω at 0 °C respectively. The characteristic is described by the coefficient W₁₀₀=1.3850 (according to IEC 60751) or W₁₀₀=1.3910. Measurement range: from minus 40 to +240 °C. They are connected to channels 1-4 in a two-wire or three-wire configuration.
Ni100 / Ni1000 - nickel resistance temperature detectors with nominal resistance of 100 Ω and 1000 Ω at 0 °C (W₁₀₀=1.6178). Measurement range: from minus 40 to +180 °C. They are connected to channels 1-4 in a two-wire or three-wire configuration.
Cu100 - copper resistance temperature detectors with nominal resistance of 100 Ω at 0 °C (W₁₀₀=1.4274). Measurement range: from minus 40 to +200 °C. They are connected to channels 1-4 in a two-wire or three-wire configuration.
Ptc1000 / EKS111 - platinum resistance temperature detector with nominal resistance of 1000 Ω at 0 °C and an increased temperature coefficient (W₁₀₀=2.0805). Measurement range: from minus 40 to +100 °C. They are connected to channels 1-4 in a two-wire or three-wire configuration.
KTY83 - silicon resistance temperature detector with nominal resistance R₂₅=1000 Ω at 25 °C, models 110/120/150. Measurement range: from minus 40 to +175 °C. They are connected to channels 1-4 in a two-wire or three-wire configuration.
KTY84 - silicon resistance temperature detector with nominal resistance R₁₀₀=1000 Ω at 100 °C, models 130/150. Measurement range: from minus 40 to +200 °C. They are connected to channels 1-4 in a two-wire or three-wire configuration.
PTC minika - semiconductor posistors that sharply increase their electrical resistance when the nominal response temperature (NAT) is reached. Sensors are produced with various NAT values in the range from 60 to 180 °C in increments of 10 °C.
1.6 Delivery Set
Section titled “1.6 Delivery Set”The delivery set includes:
- TR-100E digital temperature relay - 1 pc.;
- operating manual (passport), paper copy - 1 copy;
- Ethernet patch cord - 1 pc.;
- registration stickers with QR/PIN code for registration on the Overvis server - 2 pcs.;
- individual cardboard box - 1 pc.
2 INTENDED USE
Section titled “2 INTENDED USE”2.1 Preparation of the TR-100E for Use
Section titled “2.1 Preparation of the TR-100E for Use”2.1.1 Safety Measures
Section titled “2.1.1 Safety Measures”2.1.2 Connect the TR-100E according to the wiring diagram in Figure 2.
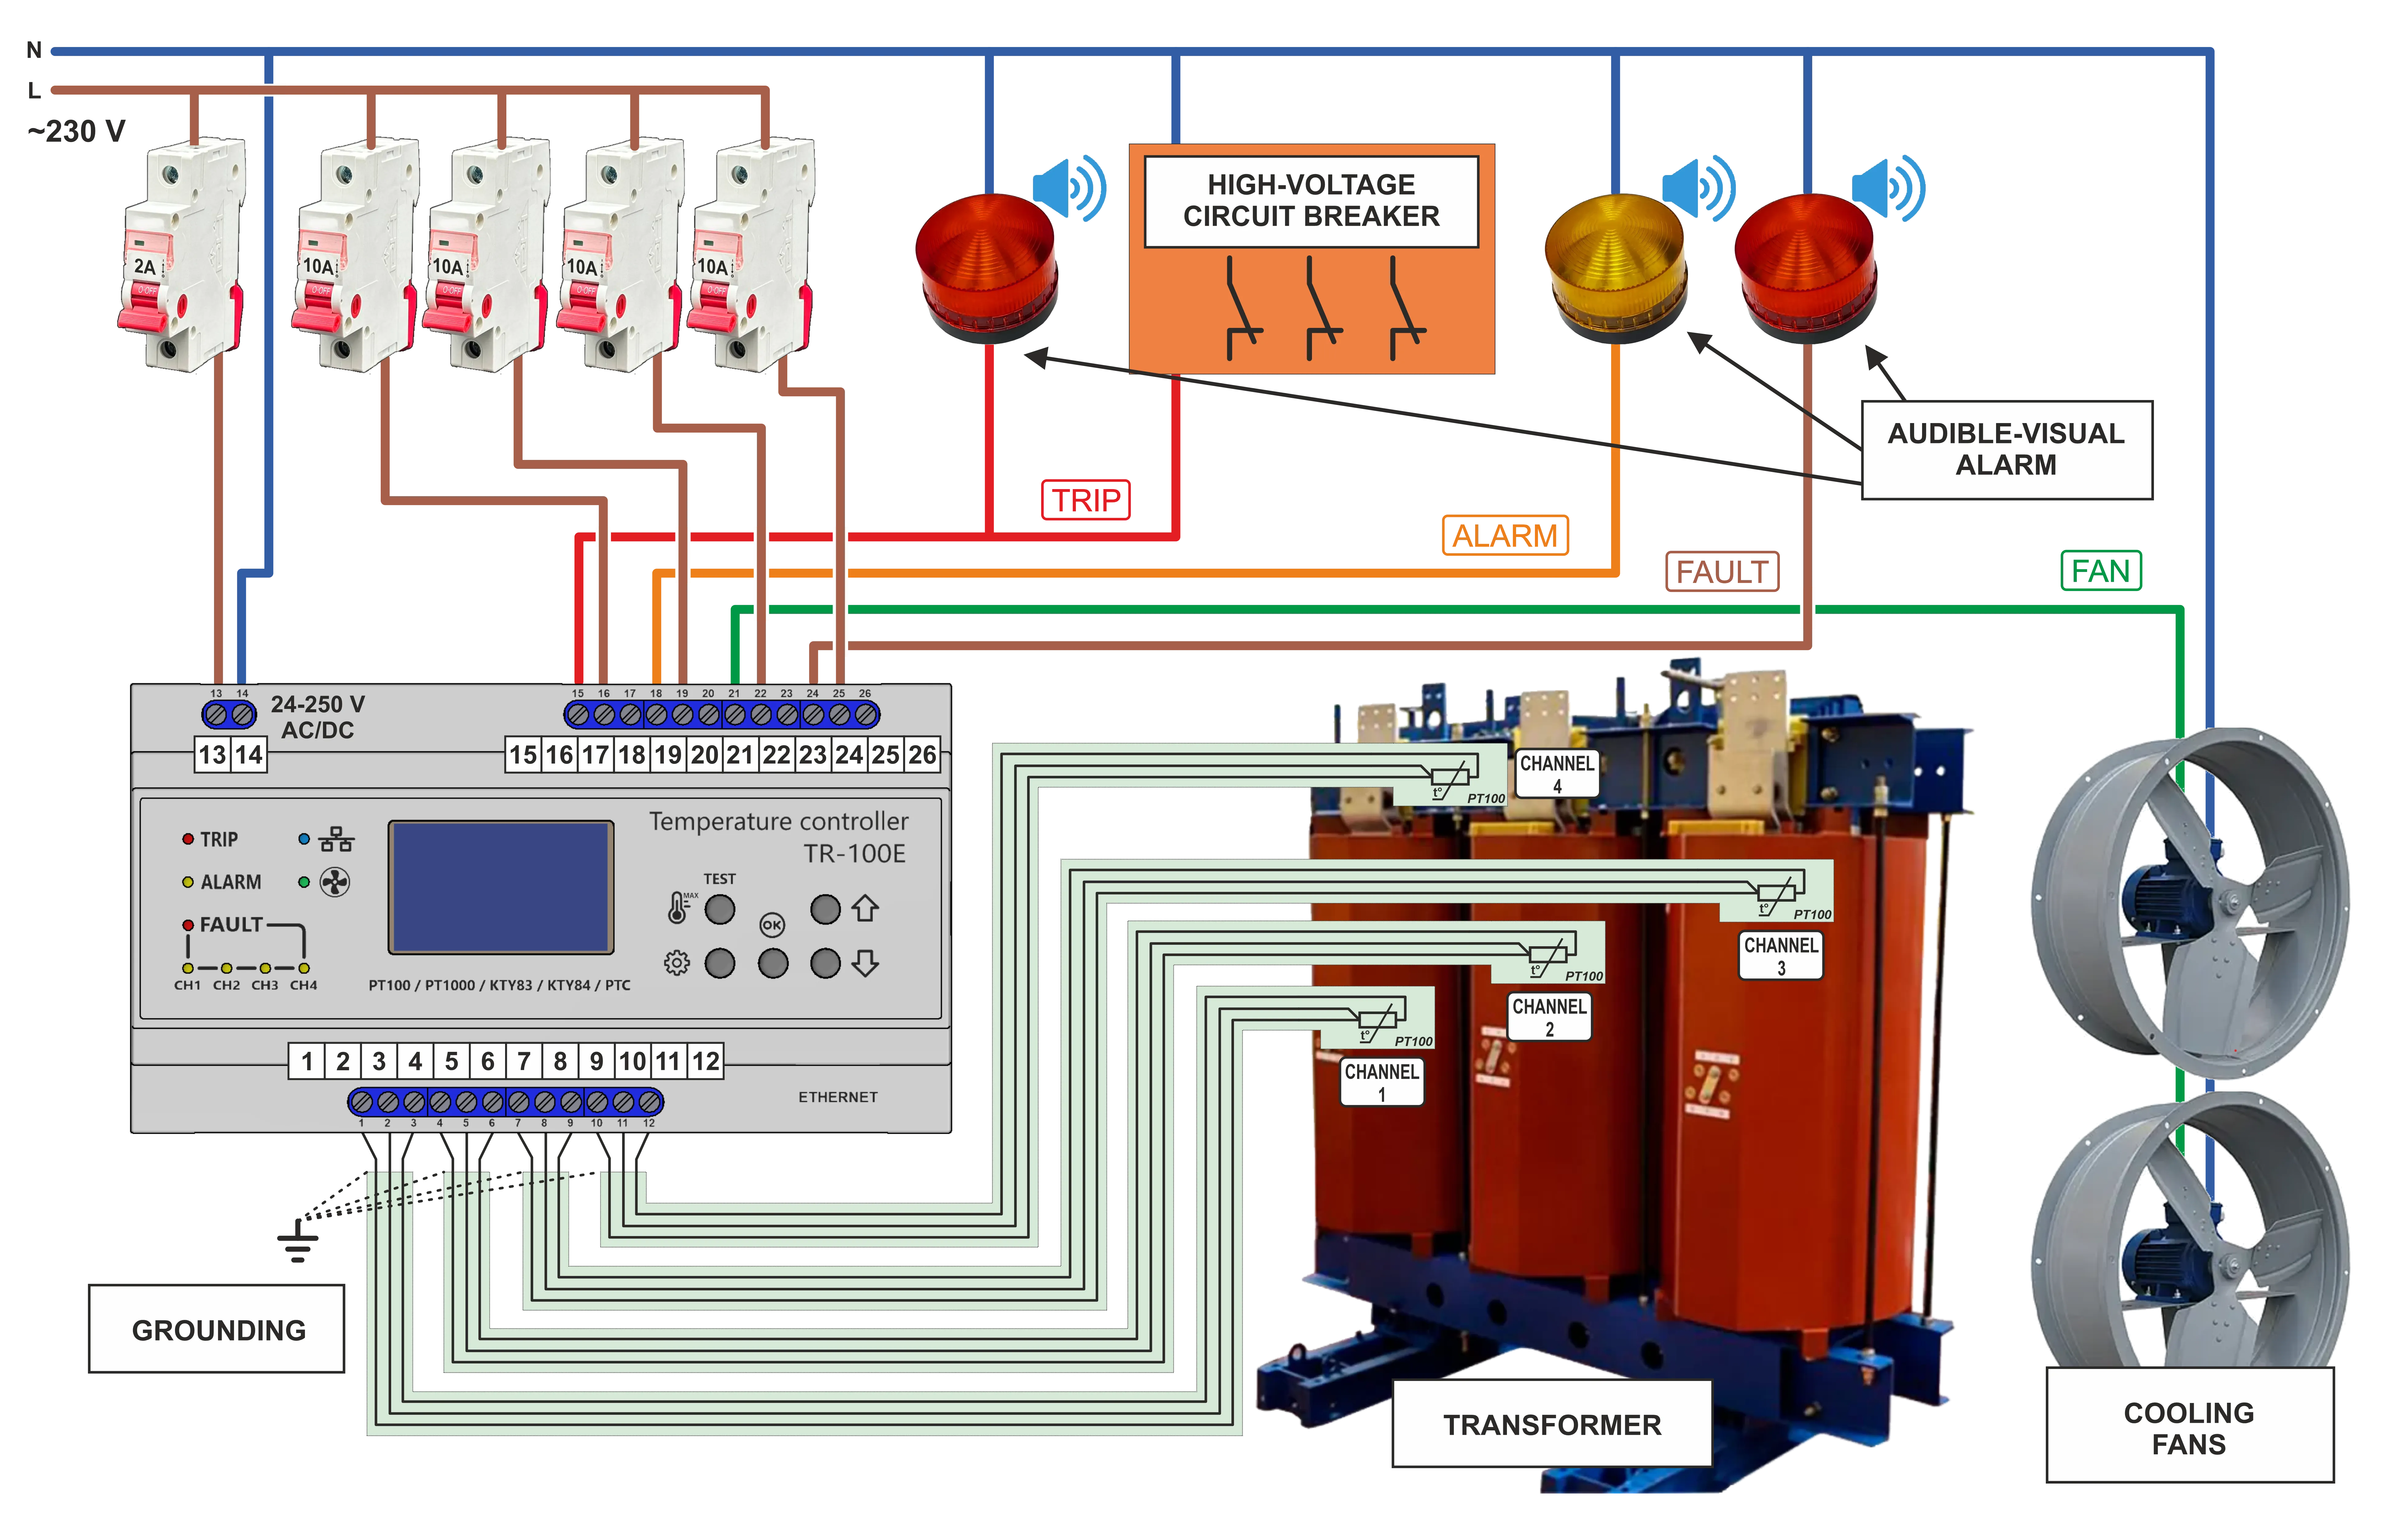
Figure 2 - TR-100E wiring diagram
2.1.3 Power on the TR-100E and, if necessary, set the operating modes according to Table 3.
2.2 Use of the TR-100E
Section titled “2.2 Use of the TR-100E”2.2.1 Operating Principle
Section titled “2.2.1 Operating Principle”The TR-100E continuously measures temperature in 4 zones using the connected sensors (channels 1-4). Channels 1-3 are intended to monitor transformer winding temperature, and channel 4 is intended to monitor transformer core or ambient temperature.
Event logging and temperature logging are performed in the background without affecting the main operation of the TR-100E. The saved data is available for viewing on the display and can be exported to a file through the Web interface.
After power-up, the integrity check and firmware startup are performed, after which the TR-100E switches to the main screen, the primary information display mode during normal operation (Figure 3).
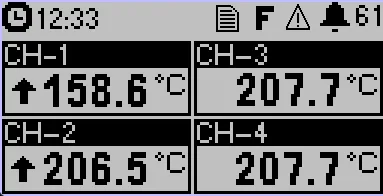
Figure 3 - TR-100E main screen
The main screen displays:
- the current time and date or the TR-100E IP address on the Ethernet network (alternating);
 temperature logger status indicator (on / off);
- relay status: T (TRIP), A (ALARM), F (FAN) (on / off, display priority T > A > F);
 fault indicator (FAULT);
 indicator of new events in the event log;
- current temperature values of channels CH1, CH2, CH3, CH4;
 trend of channel temperature change (rising / falling / unchanged);
If a channel sensor is faulty (open circuit or short circuit), an error symbol is displayed instead of the temperature value: “OPEN” (open circuit) or “SHORT” (short circuit).
If the channel is configured for a PTC minika sensor and the temperature has not yet reached the NAT, the symbol ”< NAT” is displayed.
If a channel is disabled (parameter Channel N → Enable = 0, where N is the channel number; Table 3), its field on the screen remains blank.
In addition to the main screen, a temperature graph screen is available for each enabled channel. The graph shows the channel temperature change over the last 10 minutes with a 5 s refresh period. The screen displays the channel number, temperature scale, and the latest measured value. The graph scale is selected automatically. This operating history is formed after the TR-100E is powered on and does not replace the temperature logger data.
To view the graphs, briefly press the «Up» (UP) button to go to the next screen or the «Down» (DOWN) button to go to the previous screen. The screens switch cyclically; graphs of disabled channels are skipped.
The states of all LED indicators are given in Table 2.
Table 2 - LED indicator states
| Indicator | State | Meaning |
|---|---|---|
| CH1 - CH4 | Off | Channel is normal |
| Blinking | Channel sensor fault (open circuit or short circuit) | |
| FAULT | Off | Normal |
| Blinking | Sensor fault or internal TR-100E error detected | |
| ALARM | Off | The temperature of all channels is below the turn-off threshold set by parameters Alarm → Setpoint CH1-CH4 and Alarm → Hysteresis CH1-CH4 |
| Flashing | The temperature of one of the channels has exceeded the corresponding Alarm → Setpoint CH1-CH4 parameter; Alarm → Delay countdown is in progress | |
| Lit | «Alarm» relay is on | |
| TRIP | Off | The temperature of all channels is below the turn-off threshold set by parameters Trip → Setpoint CH1-CH4 and Trip → Hysteresis CH1-CH4 |
| Flashing | The temperature of one of the channels has exceeded the corresponding Trip → Setpoint CH1-CH4 parameter; Trip → Delay countdown is in progress | |
| Lit | «Overheat» relay is on | |
| FAN | Off | «Ventilation» relay is off |
| Flashing | The temperature of one of the selected channels has exceeded the corresponding Fan → Setpoint CH1-CH4 parameter; Fan → Delay countdown is in progress | |
| Lit | «Ventilation» relay is on | |
| LINK | Off | No physical Ethernet network connection |
| Lit | Ethernet network connection established | |
| Blinking | Ethernet data transmission |
2.2.2 Event Log
Section titled “2.2.2 Event Log”During operation, the TR-100E automatically maintains an event log in the background; no action by the user is required for this.
The log records significant events and diagnostic messages related to TR-100E operation. The main types of records are listed below; this list is not exhaustive:
- operation and release of TRIP, ALARM, FAN, and FAULT relays; when TRIP, ALARM, and FAN operate, the channel number and temperature are recorded;
- open circuit or short circuit of the measurement line, as well as restoration of its normal state;
- TR-100E startup, scheduled restart, and detection by the watchdog timer of a previous restart;
- password verification results when accessing settings: successful login, incorrect password entry, and access lockout;
- saving settings and errors during their loading or saving;
- temperature logger data initialization and write errors;
- successful NTP time synchronization and errors of Web, Modbus TCP, NTP, and WireGuard VPN network services;
- measurement errors, as well as information about critical firmware failures.
Each record contains the date and time of the event, its description, and additional information that makes it possible to determine the cause of protection operation or a fault.
The log is designed for 2048 records. When the limit is reached, new events continue to be recorded, overwriting the oldest ones. Data is stored in non-volatile memory and is not lost when the power is removed.
Operating the log from the front panel: while on the main screen, press and hold the «Menu» (MENU) button for at least 5 s. If necessary, enter the password according to Sec. 2.2.5. Using the «Up» / «Down» (UP/DOWN) buttons, select Event log and press the «Enter» (SET) button. Then perform the required action:
- viewing the log: select View list and press the «Enter» (SET) button. Using the «Up» / «Down» (UP/DOWN) buttons, select a record; to view detailed information, press the «Enter» (SET) button. To return, press the «Menu» (MENU) button;
- clearing the log: select Clear and press the «Enter» (SET) button. In the confirmation window, use the «Up» (UP) button to select Yes and press the «Enter» (SET) button.
Viewing and export through the Web interface: open the TR-100E Web interface and go to the Log tab. To save the log to the events.log file, click the Export LOG button.
2.2.3 Temperature Logger
Section titled “2.2.3 Temperature Logger”The logger periodically stores the temperature values of all four channels, which makes it possible to analyze the thermal operating mode of the monitored object for the period whose data is stored in the logger memory.
By default, the logger is enabled with a logging interval of 600 seconds. The interval can be changed in the range from 5 to 3600 seconds using the Temperature logger → Recording period parameter, and the logger can be disabled using the Temperature logger → Enable parameter (Table 3).
Each record contains the measurement date and time, the temperatures of all four channels, as well as the current channel status flags for each channel (TRIP, ALARM, FAN operation, sensor fault).
The logger is designed for 16384 records. When the limit is reached, new data continues to be recorded, overwriting the oldest records. The shorter the logging interval, the faster the buffer fills and the smaller the depth of stored history. Data is stored in non-volatile memory and is not lost when the power is removed.
Operating the logger from the front panel: while on the main screen, press and hold the «Menu» (MENU) button for at least 5 s. If necessary, enter the password according to Sec. 2.2.5. Using the «Up» / «Down» (UP/DOWN) buttons, select Temperature logger and press the «Enter» (SET) button. Then perform the required action:
- viewing records: select View list and press the «Enter» (SET) button. Using the «Up» / «Down» (UP/DOWN) buttons, select a record; to view detailed information, press the «Enter» (SET) button. To return, press the «Menu» (MENU) button;
- clearing records: select Clear and press the «Enter» (SET) button. In the confirmation window, use the «Up» (UP) button to select Yes and press the «Enter» (SET) button.
Viewing and export through the Web interface: open the TR-100E Web interface and go to the Temperature logger tab. To save the records to the recorder.csv file, click the Export CSV button.
2.2.4 Control of the TR-100E
Section titled “2.2.4 Control of the TR-100E”The TR-100E is controlled by buttons located on the front panel (Fig. 1, items 10, 11, 13-15):
- «Test» (TEST) button - to enter the LED indication test mode and view the minimum and maximum channel temperatures;
- «Menu» (MENU) button - to enter and exit the parameter viewing and modification mode;
- «Enter» (SET) button - to enter a parameter, confirm a parameter change, and return to the menu;
- «Up» (UP) and «Down» (DOWN) buttons - to scroll through parameters and change a parameter value.
2.2.5 Parameter Modification (Settings Menu)
Section titled “2.2.5 Parameter Modification (Settings Menu)”To enter parameter modification mode while on the main screen, press and hold the «Menu» (MENU) button for at least 5 s. If access is password-protected, enter the password according to the instructions below. If entered correctly, the message Password accepted is displayed, after which the parameter menu opens. If entered incorrectly, the number of remaining attempts is displayed. After five unsuccessful attempts, access is locked for 5 minutes.
The factory password is indicated on the sticker with the QR code. In the Access menu, passwords can be changed and their verification can be enabled or disabled independently. Disabling verification does not delete the stored password.
The local access password must contain 4…23 characters, and the Web and Modbus passwords 8…23 characters. Current passwords are not displayed: when Change password is selected, input starts from an empty field; canceling keeps the previous value.
2.2.6 Restoring Factory Settings
Section titled “2.2.6 Restoring Factory Settings”There are two ways to restore factory settings:
After saving, user passwords are replaced with the factory passwords specified on the sticker with the QR code.
2.2.7 Diagnostic Mode and Testing of the TR-100E
Section titled “2.2.7 Diagnostic Mode and Testing of the TR-100E”Diagnostic mode is intended for service work by qualified specialists and is not used during normal operation of the TR-100E.
When diagnostic mode is enabled, factory values are loaded into a temporary working copy of settings, but are not saved to flash memory automatically. Until the next restart, the local menu and Web interface are available without entering a password, and the Web interface is granted the powerUser access level.
To enable diagnostic mode:
- Remove power from the TR-100E.
- Press and hold the «Up» and «Down» (UP/DOWN) buttons simultaneously.
- Apply power and continue holding the buttons until the DIAGNOSTIC MODE heading and the User run device in diagnostic mode message appear, then release them.
When the mode is enabled, the User run device in diagnostic mode message is recorded in the event log. While the mode is active, a warning about the enabled diagnostic mode is periodically displayed.
To start the TR-100E in normal mode, restart the device without holding the «Up» and «Down» buttons, or remove and reapply power. If the settings were not saved, on such a startup the device will load the previously saved settings and restore normal password verification.
2.2.7.1 Checking LED Indication and Viewing Minimum and Maximum Channel Temperatures
Section titled “2.2.7.1 Checking LED Indication and Viewing Minimum and Maximum Channel Temperatures”To check LED indication, while on the main screen press the «Test» (TEST) button. The TR-100E will switch to a separate test screen, turn on all LED indicators, and display the minimum and maximum recorded temperatures for each channel.
To exit test mode, press the «Menu» (MENU) button. If no buttons are pressed for 60 s, the test screen closes automatically.
2.2.7.2 Testing the Output Relays
Section titled “2.2.7.2 Testing the Output Relays”Test procedure:
- Enter the parameter menu according to Sec. 2.2.5 and select System → Relay test.
- In the warning window, use the «Up» (UP) button to select Yes and press the «Enter» (SET) button. A screen will open with a list of relays TRIP, ALARM, FAN, and FAULT and their current test status: On or Off.
- Using the «Up» / «Down» (UP/DOWN) buttons, select the required relay.
- Press the «Enter» (SET) button. The selected relay will switch, and its status on the screen will change. Pressing the «Enter» (SET) button again will return the relay to its previous state.
- Repeat the check for the remaining relays.
To complete testing, press the «Menu» (MENU) button. Test states of all relays will be disabled, after which the TR-100E will return to the parameter menu.
2.2.8 Updating the Embedded Software (Firmware)
Section titled “2.2.8 Updating the Embedded Software (Firmware)”The TR-100E supports two methods of updating the embedded software without using a programmer:
- standard update through the TR-100E Web interface;
- emergency update through the bootloader recovery mode (Recovery mode) if the standard Web interface is unavailable.
For the update, a TR-100E firmware file in .ota format is used.
For the detailed procedure, restoration of a previously uploaded image, and decoding of bootloader messages, see «Appendix A. Emergency Firmware Recovery».
2.2.9 Setting the Date, Time, and Time Zone
Section titled “2.2.9 Setting the Date, Time, and Time Zone”The TR-100E uses a real-time clock (RTC) to timestamp the event log and logger. The date and time can be set manually from the front panel or through the Web interface. Automatic NTP time synchronization is also available.
Setting the date and time from the front panel:
- Enter the parameter menu according to Sec. 2.2.5 and select Date and time → Date.
- Using the «Up» / «Down» (UP/DOWN) buttons, set the day. Using the «Enter» (SET) button, move successively to the month and year and set their values.
- After setting the year, press the «Enter» (SET) button to write the date to the real-time clock.
- Select Date and time → Time.
- Using the «Up» / «Down» (UP/DOWN) buttons, set the hour. Using the «Enter» (SET) button, move successively to minutes and seconds and set their values.
- After setting the seconds, press the «Enter» (SET) button to write the time to the real-time clock.
To cancel entry without writing, press the «Menu» (MENU) button.
Setting the date and time through the Web interface:
- Log in to the Web interface with the
powerUseraccess level and open Settings → Date and time. - In the Set time block, specify the local date and time.
- Click the Set manually button. The specified value will be written to the real-time clock immediately; pressing the Save button is not required for this.
Time zone:
In the Settings → Date and time section, in the Time zone field, select the required offset relative to UTC, for example UTC+02:00 or UTC+03:00. The selected time zone is applied when displaying local time. To save the setting, click the Save button.
Daylight saving time (DST):
The following values are available in the DST mode field:
- Off - seasonal time changeover is disabled;
- Europe - a one-hour shift is applied on the last Sunday of March, and return to standard time occurs on the last Sunday of October;
- USA - a one-hour shift is applied on the second Sunday of March, and return to standard time occurs on the first Sunday of November;
- Manual - the user specifies DST shift, as well as the local date and time of its start and end.
After changing the DST mode and the parameters related to it, click the Save button.
2.3 Programmable and used TR-100E parameters
Section titled “2.3 Programmable and used TR-100E parameters”The complete list of stored parameters is given in Table 3. In the Holding Register Address column, the — sign means that the parameter is not transmitted via Modbus TCP and is configured through the menu, Web interface, or Web API.
Table 3 - Programmable and used parameters
| Holding Register Address | Parameter | Range / values | Factory setting | Modbus Access | Type |
|---|---|---|---|---|---|
| — | General | — | — | — | — |
| 100 | Language | 0 English; 1 Polish; 2 Ukrainian; 3 Russian | 0 (English) | W+R | uint16 |
| — | Date and time | — | — | — | — |
| 101 | Time zone offset, min | -720…840 | 0 | W+R | int16 |
| 102 | DST mode | 0 off; 1 EU; 2 USA; 3 manual | 0 (off) | W+R | uint8 |
| 103 | DST shift, min | 0…180 | 60 | W+R | int16 |
| 104–105 | DST start, local time | Unix time | 1774749600 | W+R | uint32 |
| 106–107 | DST end, local time | Unix time | 1792897200 | W+R | uint32 |
| — | Display | — | — | — | — |
| 108 | Display contrast | 0…64 | 24 | W+R | uint16 |
| 109 | Active backlight, % | 0…100 | 50 | W+R | uint16 |
| 110 | Standby backlight, % | 0…100 | 15 | W+R | uint16 |
| 111 | Standby backlight timeout, s | 30…3600 | 300 | W+R | uint16 |
| 112 | Standby backlight enable | 0…1 | 1 | W+R | uint8 |
| — | Access | — | — | — | — |
| — | Device password | — | — | — | — |
| — | Protection | 0 off; 1 on | 1 | — | uint8 |
| — | Change password | 4…23 characters | Password from the label | — | string |
| — | Web user password | — | — | — | — |
| — | Protection | 0 off; 1 on | 1 | — | uint8 |
| — | Change password | 8…23 characters | Password from the label | — | string |
| — | Web admin password | — | — | — | — |
| — | Protection | 0 off; 1 on | 1 | — | uint8 |
| — | Change password | 8…23 characters | Password from the label | — | string |
| — | Modbus password | — | — | — | — |
| — | Protection | 0 off; 1 on | 1 | — | uint8 |
| — | Change password | 8…23 characters | Password from the label | — | string |
| — | Temperature logger | — | — | — | — |
| 113 | Enable | 0…1 | 1 | W+R | uint8 |
| 114 | Recording period, s | 5…3600 | 600 | W+R | uint16 |
| — | TCP/IP | — | — | — | — |
| — | Ethernet enable | 0…1 | 1 | — | uint8 |
| 115 | DHCP | 0…1 | 1 | W+R | uint8 |
| 116–117 | DNS 1 | IPv4 | 8.8.8.8 | W+R | uint32 |
| 118–119 | DNS 2 | IPv4 | 4.4.4.4 | W+R | uint32 |
| 120–121 | Static IP address | IPv4 | 192.168.0.100 | W+R | uint32 |
| 122–123 | Network mask | IPv4 | 255.255.255.0 | W+R | uint32 |
| 124–125 | Gateway | IPv4 | 192.168.0.1 | W+R | uint32 |
| — | Time synchronization (NTP) | — | — | — | — |
| 126 | Enable | 0…1 | 0 | W+R | uint8 |
| 127–128 | Synchronization period, s | 300…86400 | 3600 | W+R | uint32 |
| 129–144 | Server 1 | DNS name or IPv4, up to 31 characters | pool.ntp.org | W+R | str16 |
| 145–160 | Server 2 | DNS name or IPv4, up to 31 characters | time.google.com | W+R | str16 |
| — | WireGuard VPN | — | — | — | — |
| — | Enable | 0…1 | 0 | — | uint8 |
| — | Auto-configuration via Overvis | 0…1 | 1 | — | uint8 |
| — | Auto-configuration URL | URL | Empty | — | string |
| — | Private key | 32 bytes | Not set | — | bytes |
| — | IP address | IPv4 with prefix length | Not set | — | IPv4/CIDR |
| — | Peer public key | 32 bytes | Not set | — | bytes |
| — | Peer name | DNS name or IPv4 | Empty | — | string |
| — | Peer port | 1…65535 | 51820 | — | uint16 |
| — | Allowed networks 1–2 | IPv4 with prefix length | Not set | — | IPv4/CIDR × 2 |
| — | Keepalive interval, s | 1…300 | 25 | — | uint16 |
| — | Web access | — | — | — | — |
| 161 | Enable | 0…1 | 1 | W+R | uint8 |
| 162 | Port | 1…65535 | 80 | W+R | uint16 |
| 163 | Access via VPN | 0…1 | 1 | R | uint8 |
| 164 | VPN access level | 0 guest; 1 standard; 2 advanced | 0 | R | uint8 |
| — | Modbus TCP | — | — | — | — |
| 165 | Enable | 0…1 | 1 | W+R | uint8 |
| 166 | UID | 0…247; 0 - any UID | 48 | W+R | uint8 |
| 167 | Port | 1…65535 | 502 | W+R | uint16 |
| 168 | Timeout, s | 0 disabled; 1…3600 | 0 | W+R | uint16 |
| 169 | Protection mode | 0 none; 1 write; 2 read and write | 1 | W+R | uint8 |
| 170 | Access via VPN | 0 disabled; 1 standard protection; 2 read only; 3 read and write | 0 | R | uint8 |
| — | Channel 1 | — | — | — | — |
| 171 | Enable | 0…1 | 1 | W+R | uint8 |
| 172 | Sensor type | 0…14, see note to Table 3 | 0 | W+R | uint16 |
| 173 | Correction, °C | -10…+10 | 0 | W+R | int16 ×10 |
| 174 | PTC Minika NAT, °C | 60…180 | 160 | W+R | int16 ×10 |
| 175 | Linked setpoints | 0…1 | 1 | W+R | uint8 |
| — | Channel 2 | — | — | — | — |
| 176 | Enable | 0…1 | 1 | W+R | uint8 |
| 177 | Sensor type | 0…14, see note to Table 3 | 0 | W+R | uint16 |
| 178 | Correction, °C | -10…+10 | 0 | W+R | int16 ×10 |
| 179 | PTC Minika NAT, °C | 60…180 | 150 | W+R | int16 ×10 |
| 180 | Linked setpoints | 0…1 | 1 | W+R | uint8 |
| — | Channel 3 | — | — | — | — |
| 181 | Enable | 0…1 | 1 | W+R | uint8 |
| 182 | Sensor type | 0…14, see note to Table 3 | 0 | W+R | uint16 |
| 183 | Correction, °C | -10…+10 | 0 | W+R | int16 ×10 |
| 184 | PTC Minika NAT, °C | 60…180 | 60 | W+R | int16 ×10 |
| 185 | Linked setpoints | 0…1 | 1 | W+R | uint8 |
| — | Channel 4 | — | — | — | — |
| 186 | Enable | 0…1 | 1 | W+R | uint8 |
| 187 | Sensor type | 0…14, see note to Table 3 | 0 | W+R | uint16 |
| 188 | Correction, °C | -10…+10 | 0 | W+R | int16 ×10 |
| 189 | PTC Minika NAT, °C | 60…180 | 130 | W+R | int16 ×10 |
| 190 | Linked setpoints | 0…1 | 0 | W+R | uint8 |
| — | Digital filter | — | — | — | — |
| 191 | Overall filter level | 1…10 | 4 | W+R | uint8 |
| — | Trip (TRIP) | — | — | — | — |
| 192 | CH1 setpoint, °C | -40…240 | 155 | W+R | int16 ×10 |
| 193 | CH1 hysteresis, °C | 0…100 | 10 | W+R | int16 ×10 |
| 194 | CH2 setpoint, °C | -40…240 | 155 | W+R | int16 ×10 |
| 195 | CH2 hysteresis, °C | 0…100 | 10 | W+R | int16 ×10 |
| 196 | CH3 setpoint, °C | -40…240 | 155 | W+R | int16 ×10 |
| 197 | CH3 hysteresis, °C | 0…100 | 10 | W+R | int16 ×10 |
| 198 | CH4 setpoint, °C | -40…240 | 155 | W+R | int16 ×10 |
| 199 | CH4 hysteresis, °C | 0…100 | 10 | W+R | int16 ×10 |
| 200 | Delay, s | 0…60 | 5 | W+R | uint16 |
| — | Alarm (ALARM) | — | — | — | — |
| 201 | CH1 setpoint, °C | -40…240 | 145 | W+R | int16 ×10 |
| 202 | CH1 hysteresis, °C | 0…100 | 10 | W+R | int16 ×10 |
| 203 | CH2 setpoint, °C | -40…240 | 145 | W+R | int16 ×10 |
| 204 | CH2 hysteresis, °C | 0…100 | 10 | W+R | int16 ×10 |
| 205 | CH3 setpoint, °C | -40…240 | 145 | W+R | int16 ×10 |
| 206 | CH3 hysteresis, °C | 0…100 | 10 | W+R | int16 ×10 |
| 207 | CH4 setpoint, °C | -40…240 | 145 | W+R | int16 ×10 |
| 208 | CH4 hysteresis, °C | 0…100 | 10 | W+R | int16 ×10 |
| 209 | Delay, s | 0…60 | 5 | W+R | uint16 |
| — | Fan (FAN) | — | — | — | — |
| 210 | CH1 setpoint, °C | -40…240 | 130 | W+R | int16 ×10 |
| 211 | CH1 hysteresis, °C | 0…100 | 20 | W+R | int16 ×10 |
| 212 | CH2 setpoint, °C | -40…240 | 130 | W+R | int16 ×10 |
| 213 | CH2 hysteresis, °C | 0…100 | 20 | W+R | int16 ×10 |
| 214 | CH3 setpoint, °C | -40…240 | 130 | W+R | int16 ×10 |
| 215 | CH3 hysteresis, °C | 0…100 | 20 | W+R | int16 ×10 |
| 216 | CH4 setpoint, °C | -40…240 | 130 | W+R | int16 ×10 |
| 217 | CH4 hysteresis, °C | 0…100 | 20 | W+R | int16 ×10 |
| 218 | Mode | 0 off; 1 CH1-3; 2 CH1-4; 3 CH4 | 0 | W+R | uint16 |
| 219 | Delay, s | 0…60 | 5 | W+R | uint16 |
| — | Fault (FAULT) | — | — | — | — |
| 220 | Delay, s | 0…60 | 5 | W+R | uint16 |
2.4 Use of the Web Interface
Section titled “2.4 Use of the Web Interface”To access the TR-100E Web interface, a PC with an installed Web browser is required. In the address bar of the Web browser, enter the current IP address of the TR-100E displayed on its screen and press Enter.
2.4.1 Login and Access Levels
Section titled “2.4.1 Login and Access Levels”After opening the Web interface, the password entry form is displayed.
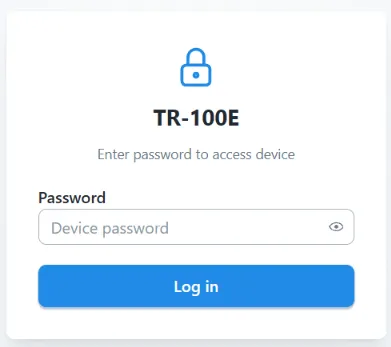
The TR-100E uses two independent Web access passwords:
- regular user password -
userlevel; - advanced user password -
powerUserlevel.
The entered password determines the granted access level. A user at the user level has access to the Monitoring, Logger, and Log tabs. A user at the powerUser level additionally has access to the Settings and Service tabs, as well as the operations for clearing the log and the logger.
Password verification for Web user and powerUser is enabled independently in Settings -> Security. If powerUser verification is disabled, the Web interface grants this level without password entry. Otherwise, if user verification is disabled, the user level is granted without a password.
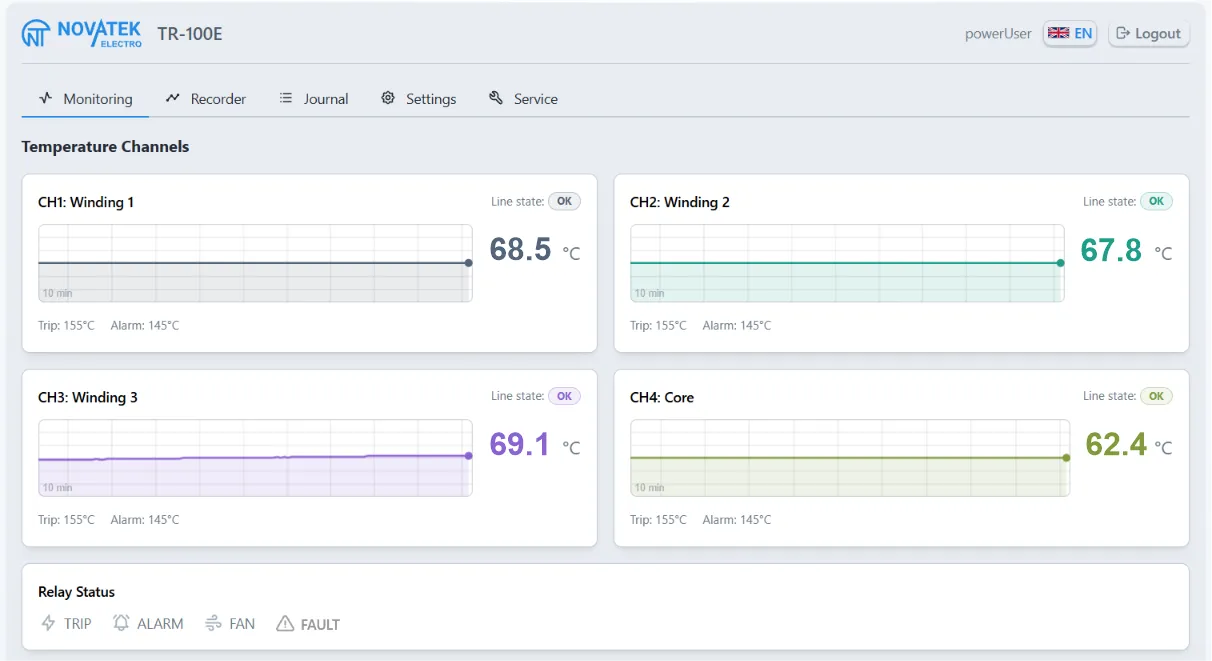
2.4.2 “Monitoring” Tab
Section titled “2.4.2 “Monitoring” Tab”The tab displays the current status of the TR-100E:
- temperature and line status of each measurement channel;
- thresholds of the protection functions and the status of the TRIP, ALARM, FAN, and FAULT relays;
- temperature history chart for the last 10 minutes;
- current time, operating time, IP address, and Ethernet status;
- recent events and the number of unread events.
Unread events can be marked as viewed with the Acknowledge button.
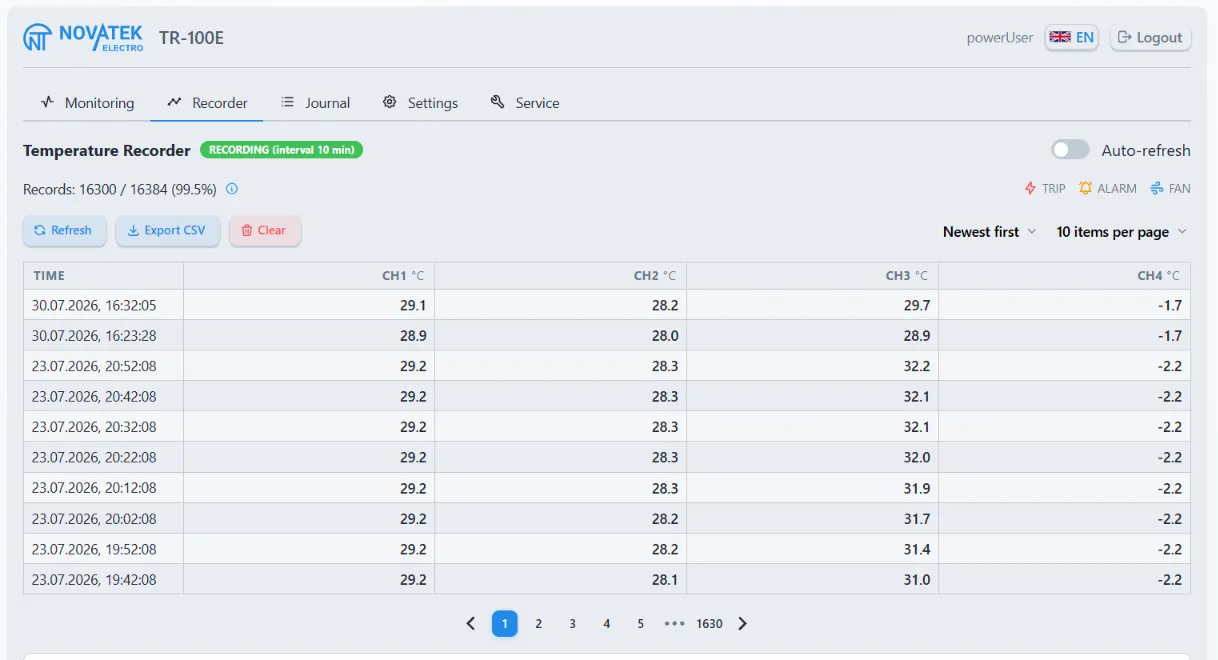
2.4.3 “Logger” Tab
Section titled “2.4.3 “Logger” Tab”The tab displays the number of saved records, the logging interval, the records table, and channel temperature charts. The following are available:
- manual and automatic refresh;
- selection of record order and the number of records per page;
- page navigation;
- export of all records to the
recorder.csvfile.
Clearing the logger is available only to a user at the powerUser level.
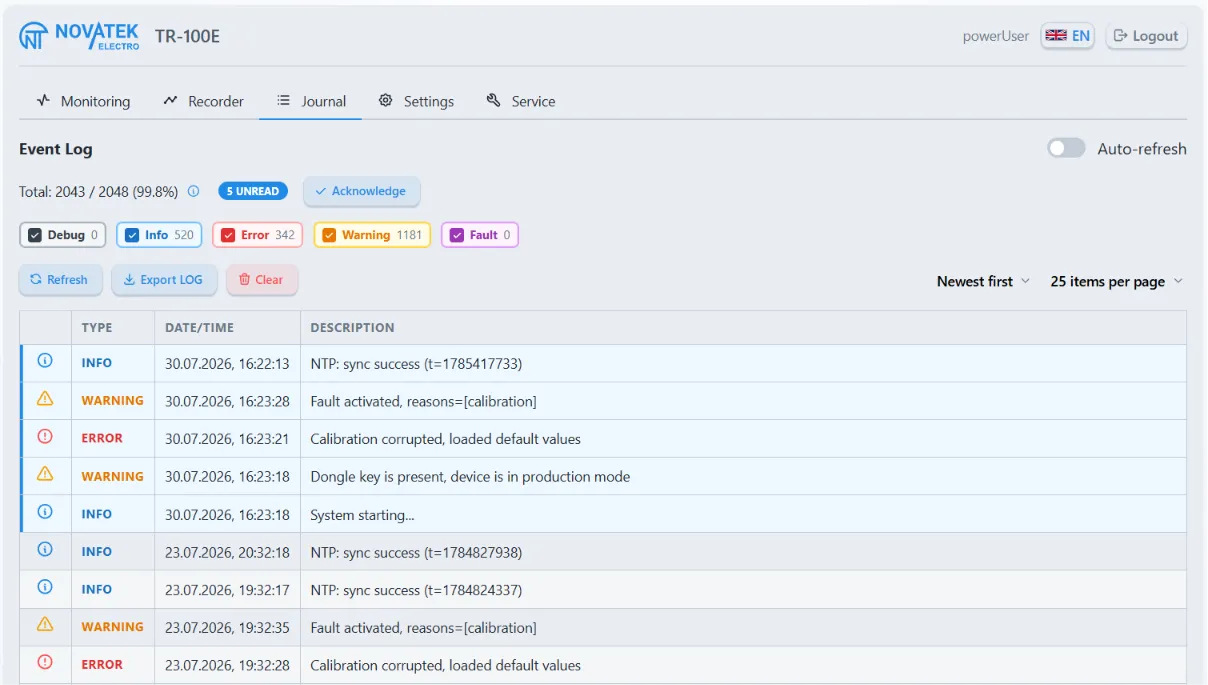
2.4.4 “Log” Tab
Section titled “2.4.4 “Log” Tab”The tab displays events with date, time, severity level, and description. The following are available:
- manual and automatic refresh;
- filtering by severity level;
- selection of event order and the number of events per page;
- page navigation;
- acknowledgment of unread events;
- export of the log to a text file.
Clearing the log is available only to a user at the powerUser level.
2.4.5 “Settings” Tab
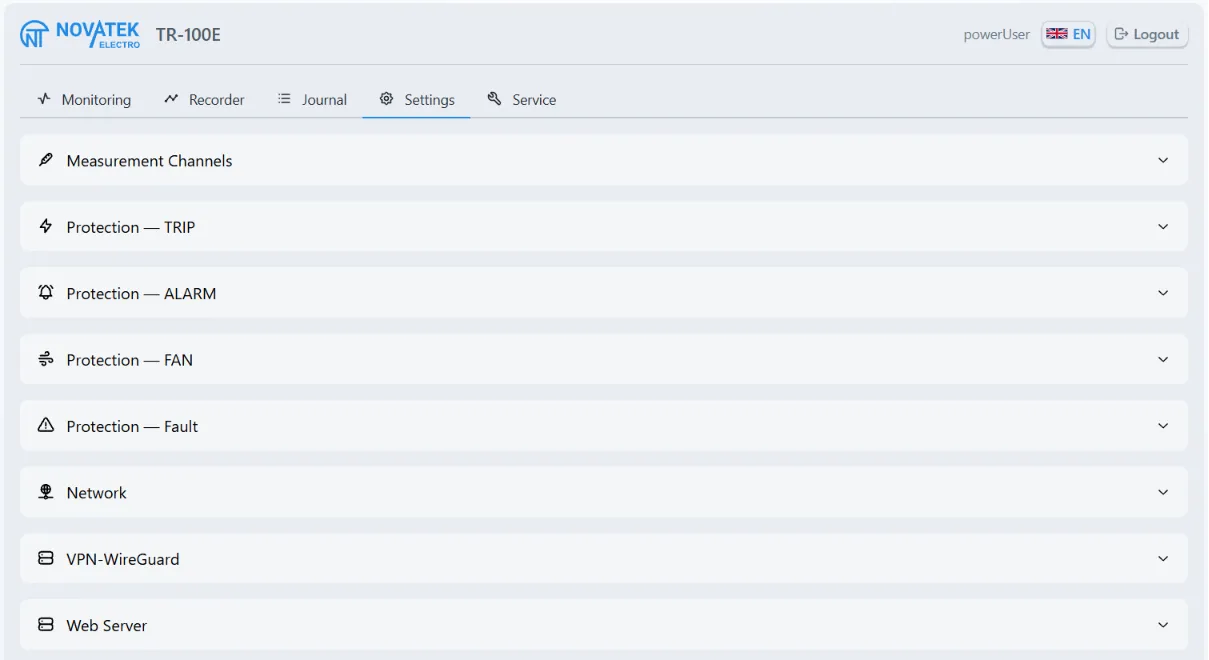
Section titled “2.4.5 “Settings” Tab”The tab is available only to a user at the powerUser level. Settings are presented as collapsible sections: Channels, Trip, Alarm, Fan, Fault, Network, WireGuard, Web server, Modbus TCP, NTP, Date and time, Logger, Display, Language, and Security. Several sections can be opened at the same time.
The settings of each section are loaded and saved separately. The Refresh button rereads the settings of the open section from the TR-100E, and the Save button writes the changes. If applying the saved settings requires a restart, the Web interface displays a corresponding warning; the restart is not performed automatically.
In the Security section, saved passwords are not displayed. To leave a password unchanged, do not fill in the corresponding field; to replace a password, enter a new value.
2.4.6 “Service” Tab
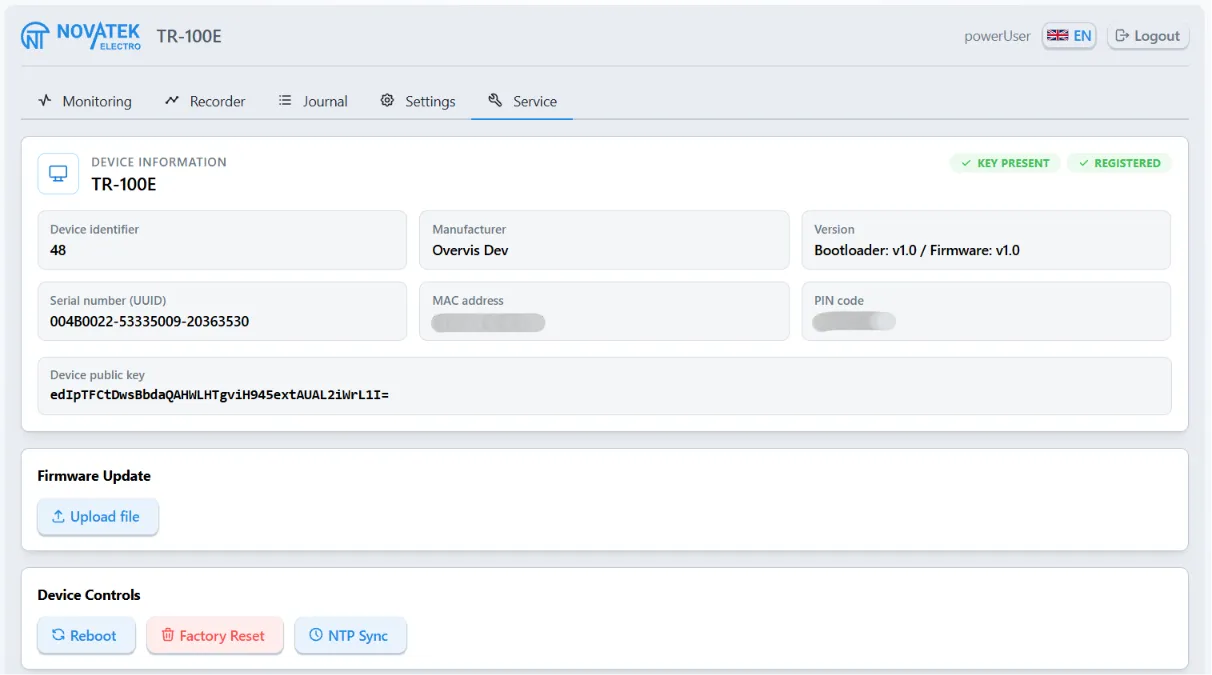
Section titled “2.4.6 “Service” Tab”The tab is available only to a user at the powerUser level and contains:
- information about the device, bootloader, firmware, MAC address, and identifiers;
- upload, verification, and application of a firmware update file in
.otaformat; - software restart of the TR-100E;
- restoration of factory settings;
- forced time synchronization via NTP;
- device diagnostic information.
2.5 Use of WireGuard VPN
Section titled “2.5 Use of WireGuard VPN”2.5.1 Purpose of the VPN
Section titled “2.5.1 Purpose of the VPN”The TR-100E supports a VPN connection using the WireGuard protocol. The VPN creates a secure network channel between the TR-100E and a remote WireGuard peer and allows access to the device’s network services through the VPN interface.
The VPN connection parameters can be set manually or obtained automatically. The configuration mode is selected in the TR-100E Web interface.
For VPN operation, the TR-100E must have Internet access, correctly configured gateway and DNS servers, and the network must not block the connection to the remote WireGuard peer.
2.5.2 Manual WireGuard Configuration
Section titled “2.5.2 Manual WireGuard Configuration”The VPN parameters are located in the Web interface under Settings -> VPN-WireGuard.
Manual configuration is used to connect to a WireGuard peer selected by the user. To apply it:
- Enable the Enabled parameter.
- Disable the Automatic connection to the Overvis server parameter.
- Specify the values provided by the VPN administrator: private key, interface address in CIDR format, public key and peer address, port, allowed IP networks, and keepalive interval.
- Click the Save button.
After the modified parameters are saved, the WireGuard service restarts automatically; restarting the TR-100E is not required.
The detailed procedure for manual configuration is given in “Appendix B. WireGuard VPN Configuration”.
2.5.3 Automatic Configuration via Overvis
Section titled “2.5.3 Automatic Configuration via Overvis”Overvis is a cloud-based monitoring and visualization system that can use WireGuard VPN to access the TR-100E. When automatic mode is selected, the TR-100E is identified by its factory PIN code, receives WireGuard parameters from Overvis, and establishes a VPN connection. In this case, a static public IP address and forwarding of incoming ports on the router are not required.
When the Automatic connection to the Overvis server parameter is enabled, the manual configuration fields are not used. The Automatic configuration server URL field should be left empty unless a different address is provided by the manufacturer or technical support.
To connect through Overvis, it is necessary to:
- Provide the TR-100E with Internet access.
- Under Settings -> VPN-WireGuard, enable Enabled and Automatic connection to the Overvis server, then save the settings.
- Create a network in the Overvis account and bind the TR-100E to it using the factory PIN code.
- Wait for the VPN connection to be established and verify access to the required TR-100E data.
The step-by-step connection procedure is given in “Appendix B. WireGuard VPN Configuration”. Additional information about the Overvis system is available at www.overvis.com.
2.5.4 Access to the Web Interface and Modbus TCP via VPN
Section titled “2.5.4 Access to the Web Interface and Modbus TCP via VPN”An established VPN connection by itself does not permit access to the TR-100E network services. The required services and access to them over VPN are configured separately:
- for the Web interface, in Settings -> Web server, enable Web access via VPN and select Default access level via VPN:
Guest,User, orPowerUser; - for Modbus TCP, in Settings -> Modbus TCP, select Modbus access via VPN: Disabled, Standard protection, Read only, or Read and write.
In Standard protection mode, VPN sessions follow the common Modbus protection mode and require password unlocking under the same conditions as local connections. Read only permits passwordless reads over VPN and rejects all write commands. Read and write permits passwordless reads and writes over VPN; local connections continue to follow the common Modbus protection mode.
Permit only the necessary services through the VPN and assign the minimum sufficient access level.
2.6 Use of Modbus TCP
Section titled “2.6 Use of Modbus TCP”The TR-100E is connected to the local network via the Ethernet interface. The Modbus TCP protocol is used for data exchange between the TR-100E and a Modbus client over a TCP/IP network.
Via Modbus TCP, it is possible to:
- read the measured values and current status of the TR-100E, for example for data transmission to a SCADA system;
- read and modify the available TR-100E settings;
- execute the service commands provided by the protocol.
For safety reasons, direct control of the output relays via Modbus TCP is not provided: the relays are controlled by the built-in protection algorithms in accordance with the measurement results, configured thresholds, hysteresis, and delays. This prevents bypassing the protection algorithms by a remote command.
The TR-100E uses two independent groups of Modbus registers: Input registers and Holding registers. Current states are read from the Input registers with function 0x04; settings, service values, and commands are located in the Holding registers and are handled by functions 0x03, 0x06, and 0x10.
The Timeout parameter defines the permitted time without data from a Modbus client. If no data is received within the configured time, the TR-100E closes the TCP connection. TCP Keepalive control packets do not reset this timeout. A value of 0 disables the timeout; in this case, an inactive connection is not closed by the TR-100E. The factory setting is 0 (timeout disabled).
By default, the Modbus protection mechanism restricts writing to protected Holding registers. To unlock them, the Modbus password must be written to registers 52-63 in ASCII characters (two characters per register, most significant byte first, string terminated with a zero byte). By default, the factory password indicated on the sticker with the QR code is used. Successful verification unlocks only the current TCP session; the state of the protection mechanism is available in register 51. After five incorrect attempts, requests from this IP address are blocked for 5 minutes.
When changing the Modbus password, a password length of 8…23 characters is allowed. Password verification is enabled and disabled by the Modbus password -> Protection parameter; disabling verification does not delete the saved password. The operating mode of the protection mechanism is set by register 169: 0 - no protection, 1 - write protected, 2 - read and write protected. Access to service registers 0-4, 51, 52-63, and 64-65 does not depend on the selected protection mode and is specified in Table 7.
VPN sessions are additionally governed by the Modbus access via VPN setting. The Read only and Read and write levels do not require password unlocking over VPN and do not change the protection of local Modbus connections.
Table 4 - List of supported functions (Modbus)
| Function code | Function name | Description |
|---|---|---|
| 0x03 | Read Holding Registers | Read settings and service registers |
| 0x04 | Read Input Registers | Read current states and measurements |
| 0x06 | Write Single Holding Register | Write a value or command occupying one register |
| 0x10 | Write Multiple Holding Registers | Write a value occupying multiple registers or a sequence of values |
Table 5 - Data types
| Type | Length, bytes | Description |
|---|---|---|
| int16 | 2 | Integer from -32768 to 32767 |
| uint16 | 2 | Integer from 0 to 65535 |
| int32 | 4 | Integer from -2147483648 to 2147483647 |
| uint32 | 4 | Integer from 0 to 4294967295 |
| strN | 2×N | String up to 2×N bytes: most significant byte of the register first, terminated by 0x00 |
Table 6 - Input registers (function 0x04)
| Address | Name | Description | Type |
|---|---|---|---|
| 1 | Restart reason | 0 unknown; 1 power-up; 2 RESET signal; 3 software restart; 4 watchdog reset; 5 exit from low-power mode | uint16 |
| 2 | Microcontroller temperature | Temperature ×10; -32768 (0x8000) - measurement invalid | int16 |
| 3-4 | Operating time | Seconds since startup | uint32 |
| 5-6 | Status flags | Bit mask of the general TR-100E status. The meaning of the bits is given below | uint32 |
| 7-8 | Device function readiness | Bit mask of the TR-100E subsystem status. The meaning of the bits is given below | uint32 |
| 9-10 | RTC time | Number of seconds since 00:00:00 01.01.1970 UTC | uint32 |
| 11 | RTC synchronization source | 0 none; 1 RTC backup; 2 NTP; 3 manual setting | uint16 |
| 12-13 | Last NTP time synchronization | Number of seconds since 00:00:00 01.01.1970 UTC; 0 - no successful time synchronization has occurred | uint32 |
| 14-15 | NTP synchronization counter | Number of successful synchronizations | uint32 |
| 16-17 | NTP error counter | Number of unsuccessful synchronizations | uint32 |
| 18-19 | Current IP address | Active IPv4 | uint32 |
| 20-21 | Current mask | Active IPv4 mask | uint32 |
| 22-23 | Current gateway | Active IPv4 gateway | uint32 |
| 24-27 | CH1-CH4 status | Bit mask of the state of each channel. The purpose of the registers and bits is given below | uint16 × 4 |
| 28-31 | CH1-CH4 line status | 0 unknown; 1 short circuit; 2 below range; 3 normal; 4 above range; 5 open circuit | uint16 × 4 |
| 32-35 | Current temperature CH1-CH4 | Temperature ×10; -32768 (0x8000) - measurement invalid | int16 × 4 |
| 36-39 | Minimum temperature CH1-CH4 | Temperature ×10; -32768 (0x8000) - measurement invalid | int16 × 4 |
| 40-43 | Maximum temperature CH1-CH4 | Temperature ×10; -32768 (0x8000) - measurement invalid | int16 × 4 |
| 44-47 | Temperature change direction CH1-CH4 | 0 decreasing; 1 unchanged; 2 increasing | uint16 × 4 |
Interpretation of Registers 5-6 “Status flags”
A set bit (1) means that the specified condition is active. A cleared bit (0) means that the condition is inactive.
| Bit | Condition | Meaning when the bit is set (1) |
|---|---|---|
| 0 | FAULT | The FAULT relay is on due to a sensor fault or an internal TR-100E error. The bit is set after the Fault -> Delay delay has elapsed |
| 1 | TRIP | The TRIP relay is on due to exceeding the trip threshold. The bit is set after the Trip -> Delay delay has elapsed |
| 2 | ALARM | The ALARM relay is on due to exceeding the alarm threshold. The bit is set after the Alarm -> Delay delay has elapsed |
| 3 | FAN | The FAN relay is on due to exceeding the fan threshold. The bit is set after the Fan -> Delay delay has elapsed |
| 4 | Restart required | Restart of the TR-100E is required to apply some of the saved settings |
| 5 | Diagnostic mode | The mode is activated by the “Up” + “Down” combination at startup; password protection is disabled and protected diagnostic commands are permitted |
Interpretation of Registers 7-8 “Device function readiness”
Each bit indicates the readiness of the corresponding subsystem: 1 - the subsystem is ready for operation; 0 - the subsystem is not ready or not initialized.
| Bit | Subsystem | Meaning when the bit is set (1) |
|---|---|---|
| 0 | Settings | The settings data is valid and available |
| 1 | Measurement service data | The service data of the measurement path is valid |
| 2 | Real-time clock | The RTC is configured and operating |
| 3 | Buttons | The button module is ready |
| 4 | LED indicators | The LED indication module is ready |
| 5 | Display | The LCD is ready |
| 6 | External memory | The external memory is ready |
| 7 | Identification data | The device identification data storage is ready |
| 8 | Event log | The event log is ready |
| 9 | Temperature logger | The temperature logger is ready |
| 10 | Live temperature history | The temperature history is ready |
| 11 | Temperature measurement | The measurement module is ready |
| 12 | Random number generator | The hardware random number generator is ready |
| 13 | Ethernet | The Ethernet interface is ready |
| 14 | TCP/IP network stack | The network stack is ready |
| 15 | Web interface | The Web server is ready |
| 16 | NTP | The time synchronization client is ready |
| 17 | WireGuard | The WireGuard VPN service is ready |
| 18 | Modbus TCP | The Modbus TCP server is ready |
Interpretation of Registers 24-27 “CH1-CH4 status”
Each channel corresponds to a separate register: 24 - CH1, 25 - CH2, 26 - CH3, 27 - CH4.
| Bit | Channel state | Meaning when the bit is set (1) |
|---|---|---|
| 0 | Channel enabled | The channel is enabled and participates in measurement processing |
| 1 | TRIP condition | The channel temperature has reached the Trip threshold or has not yet dropped below the threshold taking hysteresis into account |
| 2 | ALARM condition | The channel temperature has reached the Alarm threshold or has not yet dropped below the threshold taking hysteresis into account |
| 3 | FAN condition | The channel is selected for ventilation control, and its temperature has reached the Fan threshold or has not yet dropped below the threshold taking hysteresis into account |
Table 7 - Holding registers: service values and commands
| Address | Name | Description | Access | Type |
|---|---|---|---|---|
| 0 | Device model code | TR-100E: 48 | R | uint16 |
| 1 | Firmware version | For example, 0x0100 for version 1.0 | R | uint16 |
| 2-4 | MAC address | 6 bytes | R | str3 |
| 50 | Command | 62149 restart; 18252 save working copy; 54135 reread settings; 33421 reset minimum and maximum temperatures; 20052 synchronize time via NTP | W+R | uint16 |
| 51 | Protection mechanism state | 0 - protection active; 1 - protected operations permitted for the current TCP session | R | uint16 |
| 52-63 | Modbus password | Enter the current password; only the required number of registers may be written | W | str12 |
| 64-65 | Set UTC time | Number of seconds since 00:00:00 01.01.1970 UTC; value 0 is prohibited; both registers must be written in one request | W | uint32 |
2.7 Network Ports
Section titled “2.7 Network Ports”To configure a router or firewall, the network connections listed in Table 8 should be taken into account.
Table 8 - TR-100E network ports
| Function | Protocol and port | Direction relative to the TR-100E | Conditions of use |
|---|---|---|---|
| Web interface and Web API | TCP 80 | Incoming | Default port; changed by the Web access -> Port parameter |
| Modbus TCP | TCP 502 | Incoming | Default port; changed by the Modbus TCP -> Port parameter |
| DHCP | UDP 68 ↔ UDP 67 | Outgoing and response | The TR-100E uses local port 68, the DHCP server uses port 67; used when DHCP is enabled |
| DNS | UDP 53 | Outgoing and response | Requests to the configured DNS servers; required when DNS names of NTP, WireGuard, or autoconfiguration servers are used |
| NTP | UDP 123 | Outgoing and response | Time synchronization with the configured NTP servers when NTP is enabled |
| WireGuard VPN | UDP 51820 | Incoming and outgoing | Local TR-100E port; for the remote peer, 51820 is also used by default, but it can be changed by the VPN-WireGuard -> Peer port parameter |
| Automatic WireGuard configuration via Overvis | TCP 80 | Outgoing and response | Default port; a different port may be specified in the automatic configuration server URL |
| Recovery mode Web interface | TCP 80 | Incoming | Available only in the bootloader recovery mode at address 192.168.1.48 |
Incoming connections to the Web interface and Modbus TCP should be allowed only from trusted networks. If only outgoing connections to the NTP, DNS, and autoconfiguration server are used, port forwarding on the router is not required; the firewall must permit the response traffic of established connections.
3 MAINTENANCE
Section titled “3 MAINTENANCE”3.1 Safety Precautions
Section titled “3.1 Safety Precautions”3.2 Maintenance Frequency
Section titled “3.2 Maintenance Frequency”The recommended maintenance interval is every six months.
3.3 Maintenance Procedure:
Section titled “3.3 Maintenance Procedure:”- Check that the wires are securely connected to the TR-100E terminals; if any loose contacts are found, tighten the terminal screws. If damaged wires are found, replace them with new ones;
- Visually inspect the enclosure integrity; if cracks or chips are found, take the product out of service and send it for repair;
- If necessary, wipe the product enclosure with a cloth. Do not use abrasive materials or solvents for cleaning.
3.4 Diagnostics and Troubleshooting
Section titled “3.4 Diagnostics and Troubleshooting”Table 9 - Possible Faults and Remedies
| Symptom | Possible cause | Action |
|---|---|---|
| The display does not light up after power is applied | No voltage is present at the power supply terminals; TR-100E fault | Check that the supply voltage is present at the terminals and complies with the requirements of Table 1. If the voltage complies with the requirements but the display does not turn on, send the TR-100E for repair |
| The CH1-CH4 indicator flashes, the channel shows “OPEN” | Sensor line break or sensor fault | Check the integrity of the cable and that the sensor is securely connected to the TR-100E terminals |
| The CH1-CH4 indicator flashes, the channel shows “SHORT” | Short circuit in the sensor line | Check the sensor cable for a short circuit; replace the sensor or cable |
| The FAULT indicator flashes | Sensor fault; internal TR-100E error; startup failure | Check the channel status on the display. If the channels are operating correctly, check the event log to determine the cause. Restart the unit: switch the power off and on again, or use the web interface (System -> Restart). If FAULT continues to flash after restart without any apparent reason, send the TR-100E for repair |
| The relay does not actuate when the threshold is exceeded | Delay timing is in progress; the channel is disabled; the threshold is set incorrectly | Check the Delay, channel Enable, and Threshold settings (Table 3) |
| The relay does not de-energize after the temperature decreases | Hysteresis is set too high; incorrect threshold | Check the Hysteresis and Threshold settings for the relevant relay (Table 3) |
| The time resets after a prolonged power outage | The RTC backup capacitor is discharged (more than 7 days without power) | Set the time manually (Section 2.2.9) or enable NTP synchronization |
| No access to the web interface via the IP address | Incorrect IP address; web server is disabled; no network connection | Check the IP address on the TR-100E display; make sure the web server Enable parameter = 1 (Table 3); check the Ethernet cable and the LINK indicator |
| The Modbus TCP client does not receive a response | Incorrect IP, port, or UID; Modbus is disabled; the number of connections has been exceeded | Check the Enable, Port, and UID settings (Table 3); make sure that the number of simultaneous clients does not exceed 5 |
| No time synchronization via NTP | NTP is disabled; incorrect server address; no network access | Check the NTP Enable, Server Address, network settings, and TR-100E Internet access (Table 3) |
| Data logger data is not being recorded | The data logger is disabled | Enable the Data Logger parameter and check the Temperature Recording Period parameter value (Table 3) |
4 SERVICE LIFE AND MANUFACTURER’S WARRANTY
Section titled “4 SERVICE LIFE AND MANUFACTURER’S WARRANTY”4.1 Product Service Life
Section titled “4.1 Product Service Life”The service life of the product is 15 years. Upon expiration of the service life, contact the manufacturer.
4.2 Storage Life
Section titled “4.2 Storage Life”The storage life of the product is 3 years.
4.3 Warranty Period
Section titled “4.3 Warranty Period”The warranty period for the product is 10 years from the date of sale.
During the warranty period, the manufacturer performs repair of the product free of charge in the event of product failure.
4.4 Warranty Service
Section titled “4.4 Warranty Service”Warranty service is provided at the place of purchase or by the manufacturer of the product.
4.5 Post-Warranty Service
Section titled “4.5 Post-Warranty Service”Post-warranty service of the product is performed by the manufacturer at the current rates.
5 TRANSPORTATION AND STORAGE
Section titled “5 TRANSPORTATION AND STORAGE”TR-100E in the manufacturer’s packaging may be transported and stored at temperatures from minus 30 to +60 °C and relative humidity not exceeding 98% at 35 °C (without moisture condensation).