Parameter Values Report
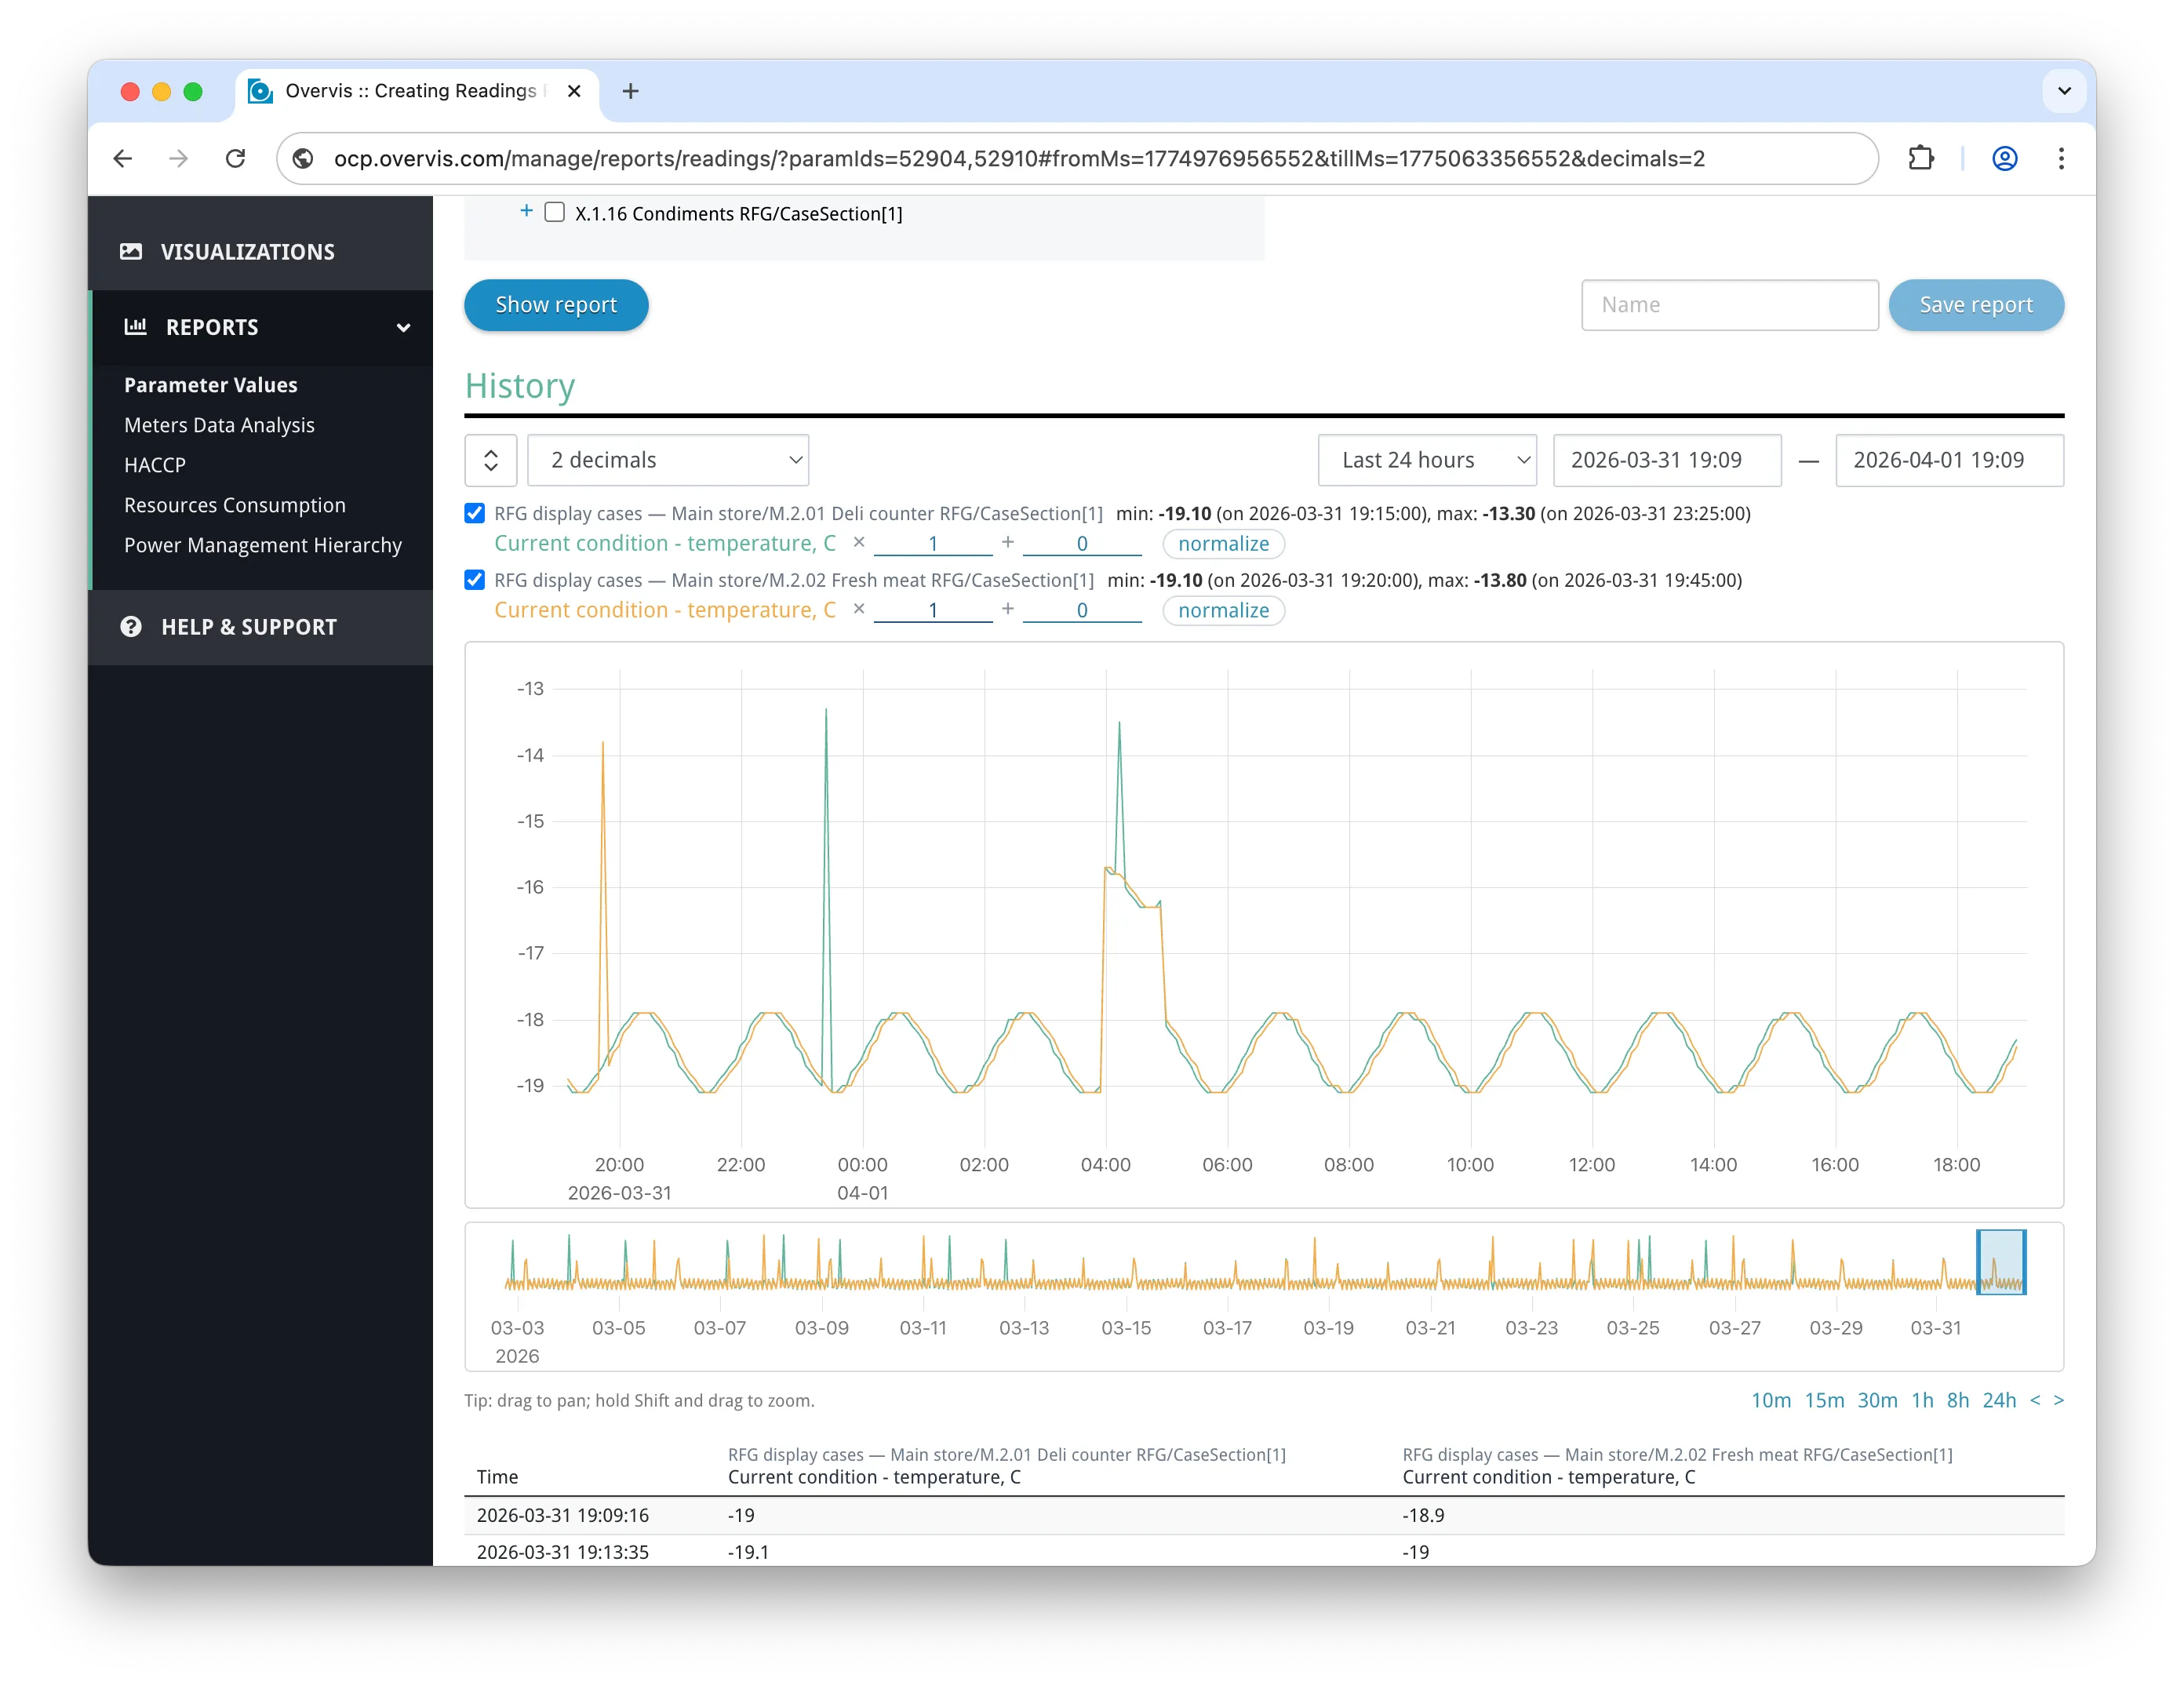
The Parameter Values Report is an interactive tool for exploring historical data from your tracked parameters. It combines a time series chart, a data table, and export capabilities on a single page. You can overlay multiple parameters from different devices, zoom into specific time intervals, and download the raw data as CSV or Excel.
Opening the Report
Section titled “Opening the Report”There are several ways to open the report:
- Main menu — go to Reports > Parameter Values. The report opens with no parameters selected; use the parameter tree to choose what to display.
- Device details page — click the chart icon next to any tracked parameter. The report opens with that parameter already loaded.
- Parameter page — click the Readings action link in the sidebar.
- Monitoring mode — the same report is available in the read-only monitoring interface. Users with view-only access are redirected here automatically.
When you open the report from a device or parameter page, the URL contains paramIds=..., so the chart loads immediately with data for those parameters.
Selecting Parameters
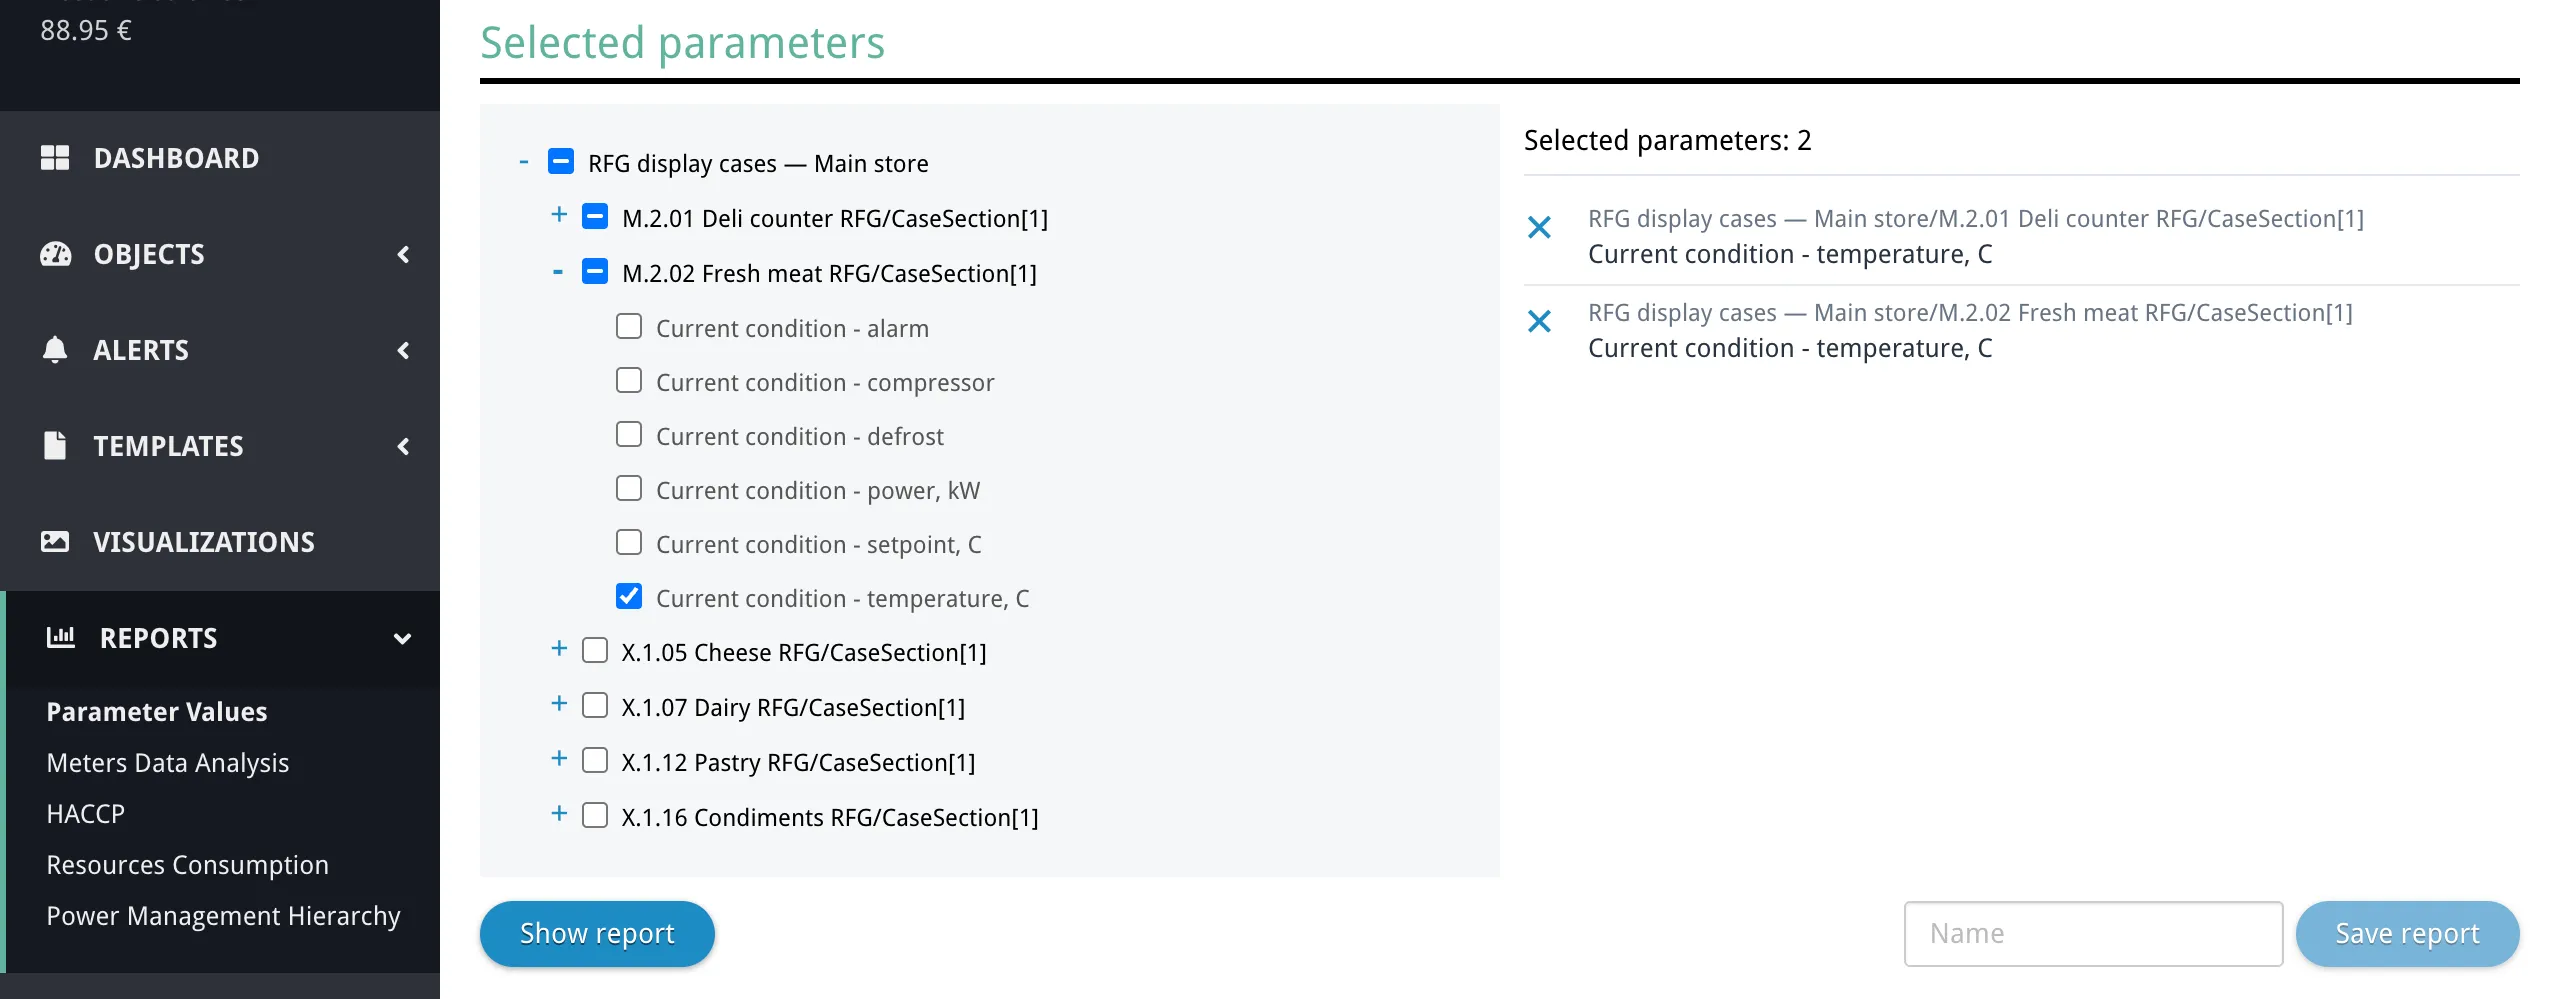
Section titled “Selecting Parameters”The parameter tree at the top of the page shows your organization hierarchy: networks, devices, and their parameters. Only tracked parameters (those with history recording enabled) appear in the tree.
- Expand the tree nodes to find the parameters you want to analyze.
- Check the parameters you want to include. A counter next to the tree shows how many parameters are currently selected. There is a configurable limit on how many parameters can be displayed at once (shown in the placeholder message below the tree).
- Click Show report to load the data.
When you change the parameter selection, the time range resets to the Last 24 hours preset if the current preset is Custom. If you already have a non-Custom preset selected, it keeps that preset. The chart and table reload with the new selection.
Controls Bar
Section titled “Controls Bar”A controls bar above the chart lets you set the time window, adjust display options, and expand the chart. All changes take effect immediately.

Time Presets
Section titled “Time Presets”The preset dropdown lets you quickly jump to common time windows:
| Preset | Range |
|---|---|
| Last 5 min, 10 min, 15 min, 30 min | Rolling window from now minus the duration |
| Last 1 hour, 24 hours, 7 days, 30 days, 365 days | Rolling window from now minus the duration |
| Current day | From midnight today to now |
| Current week | From Monday 00:00 of the current week to now |
| Current month | From the 1st of the current month to now |
Selecting a preset immediately updates both the chart and the table.
Custom Range
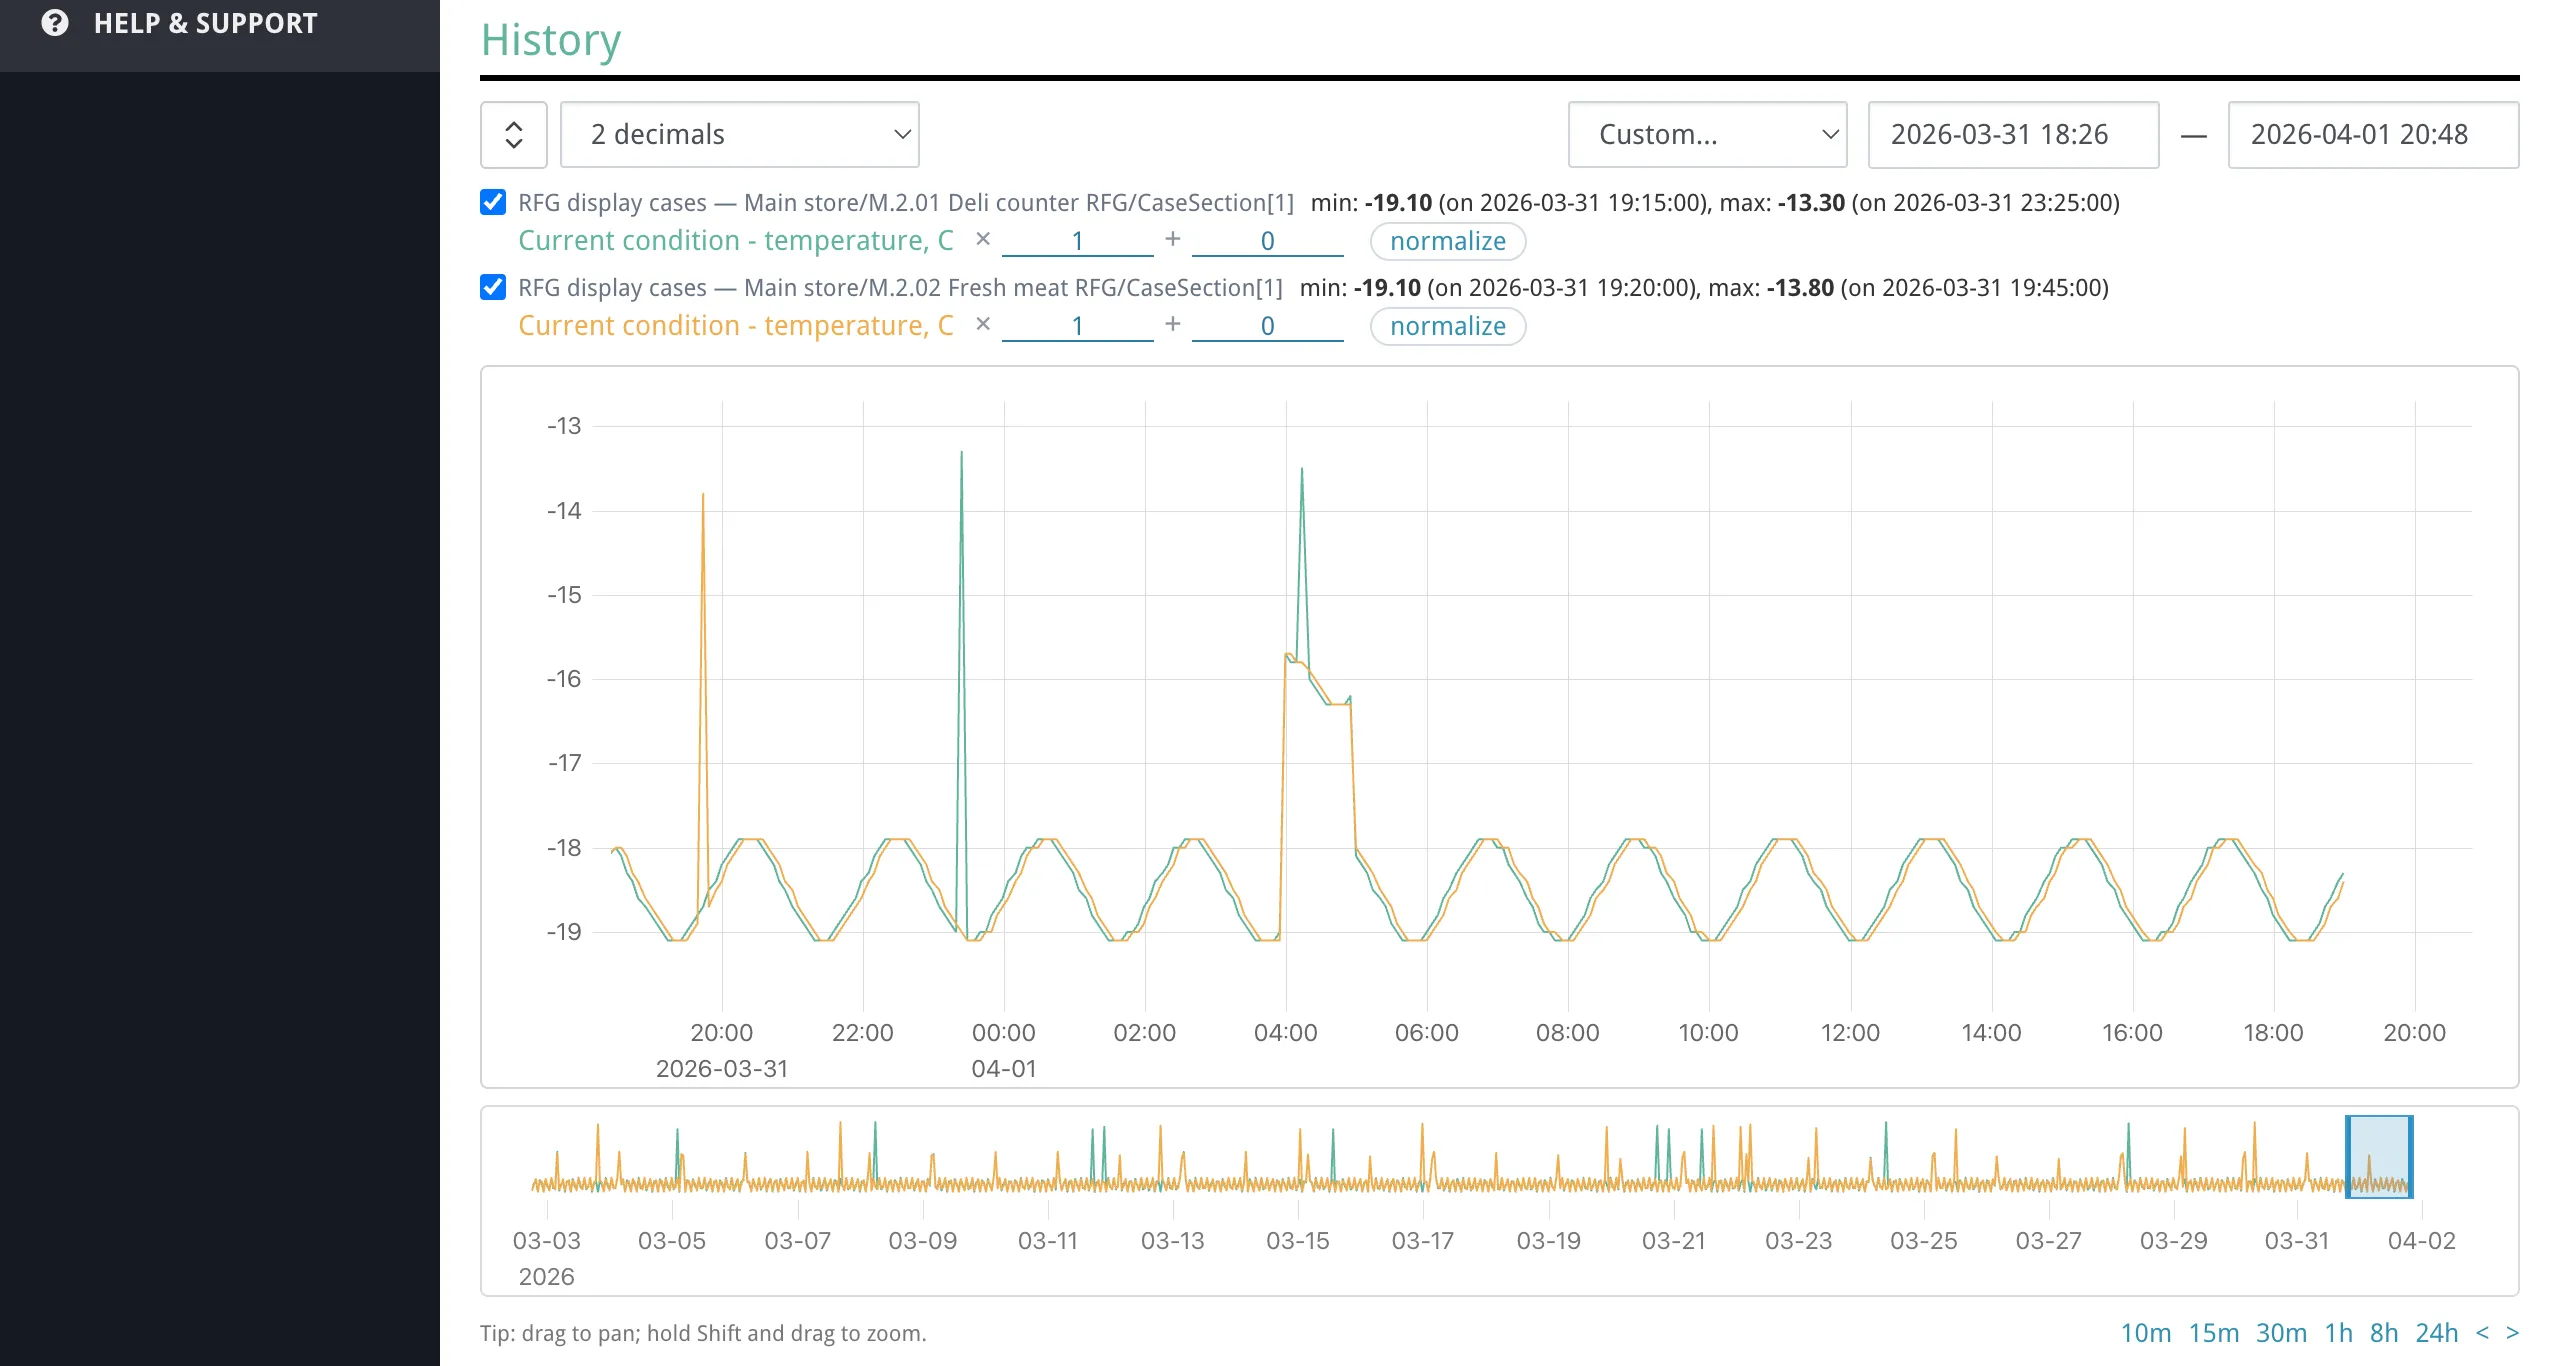
Section titled “Custom Range”Two date-time pickers (YYYY-MM-DD HH:mm) let you set an arbitrary from and till. You can type directly into the fields or use the calendar popup. Press Enter to apply a typed value, or Escape to discard it.
When you pan or zoom on the chart (see below), the preset automatically switches to Custom and the date-time fields update to reflect the new range.
Auto-Refresh
Section titled “Auto-Refresh”When a rolling preset is selected, the report refreshes automatically to keep the view current:
- Short presets (Last 5 min through Last 30 min) refresh every 3 seconds.
- Longer presets (Last 1 hour through Last 365 days) refresh every 60 seconds.
- Calendar presets (Current day, Current week, Current month) and Custom do not auto-refresh.
Display Options
Section titled “Display Options”- Decimal precision — a dropdown (0 through 6 decimal places) controls how values are displayed in the chart axis labels, tooltip, legend, and table. The default is 2 decimal places.
- Expand/collapse — toggles the chart between normal and double height.
The chart displays parameter values over time as colored lines. Each selected parameter gets its own line with a distinct color (up to 10 colors, which then cycle). If a device was offline or polling was interrupted, the chart shows breaks in the line where no readings were recorded.
Hovering over the chart shows a tooltip with the timestamp and the value of each visible parameter at that point. The closest line is shown in bold. When the visible time window is under 10 minutes, timestamps include seconds.
Navigating the Chart
Section titled “Navigating the Chart”- Drag horizontally to pan the time window left or right.
- Hold Shift and drag to select a rectangular area and zoom into it.
- Scroll the mouse wheel over the chart to zoom in or out, centered at the cursor position.
- On touch devices: single-finger drag to pan, two-finger pinch to zoom.
- Quick zoom buttons below the chart let you snap to a fixed duration (10 min, 15 min, 30 min, 1 hour, 8 hours, 24 hours) ending at the current view’s right edge.
- Step buttons (
<and>) shift the window left or right by one window-width.
All navigation updates the date-time fields and the data table in sync.
Navigator
Section titled “Navigator”Below the main chart is a smaller navigator chart showing an overview of the full data range. A shaded window indicates the currently visible area.

You can:
- Drag the shaded window to pan.
- Drag the left or right edge of the window to resize it.
The navigator automatically expands its range as you pan beyond its current bounds.
Legend
Section titled “Legend”The legend appears between the range controls and the chart. Each parameter is shown as a row with:
- Checkbox — toggle the line’s visibility on the chart. Hidden lines are excluded from the tooltip and Y-axis scaling.
- Device path — the network and device name for context.
- Parameter name — hovering it highlights the corresponding line on the chart.
- Min/Max — the minimum and maximum values within the current time window, with their timestamps.
Line Transforms
Section titled “Line Transforms”Each legend row has inline multiplier (×) and shift (+) controls. These let you visually rescale individual lines so that parameters with different units or magnitudes can be compared on the same chart.
- Multiplier — scales the parameter’s values. Enter a number and press Enter to apply (e.g., enter
0.001to convert millivolts to volts). - Shift — offsets the parameter’s values up or down.
- Normalize — automatically calculates a multiplier and shift to fit the line within the currently visible Y-axis range.
- Reset — restores the multiplier to 1 and the shift to 0. Only appears when the line has non-default transforms.
Transforms are purely visual — they affect the chart display only, not the data table or exported data.
Y-Axis Reference
Section titled “Y-Axis Reference”By default, the Y-axis shows a scale that fits all visible lines. Clicking on a line in the chart pins the Y-axis labels to that specific parameter’s scale (the legend entry appears highlighted). Click again or click a different line to change the reference. Clicking away from any line (on the chart background) clears the reference and returns to the auto-fitting scale.
Data Table
Section titled “Data Table”Below the chart, a table lists readings within the current time window.
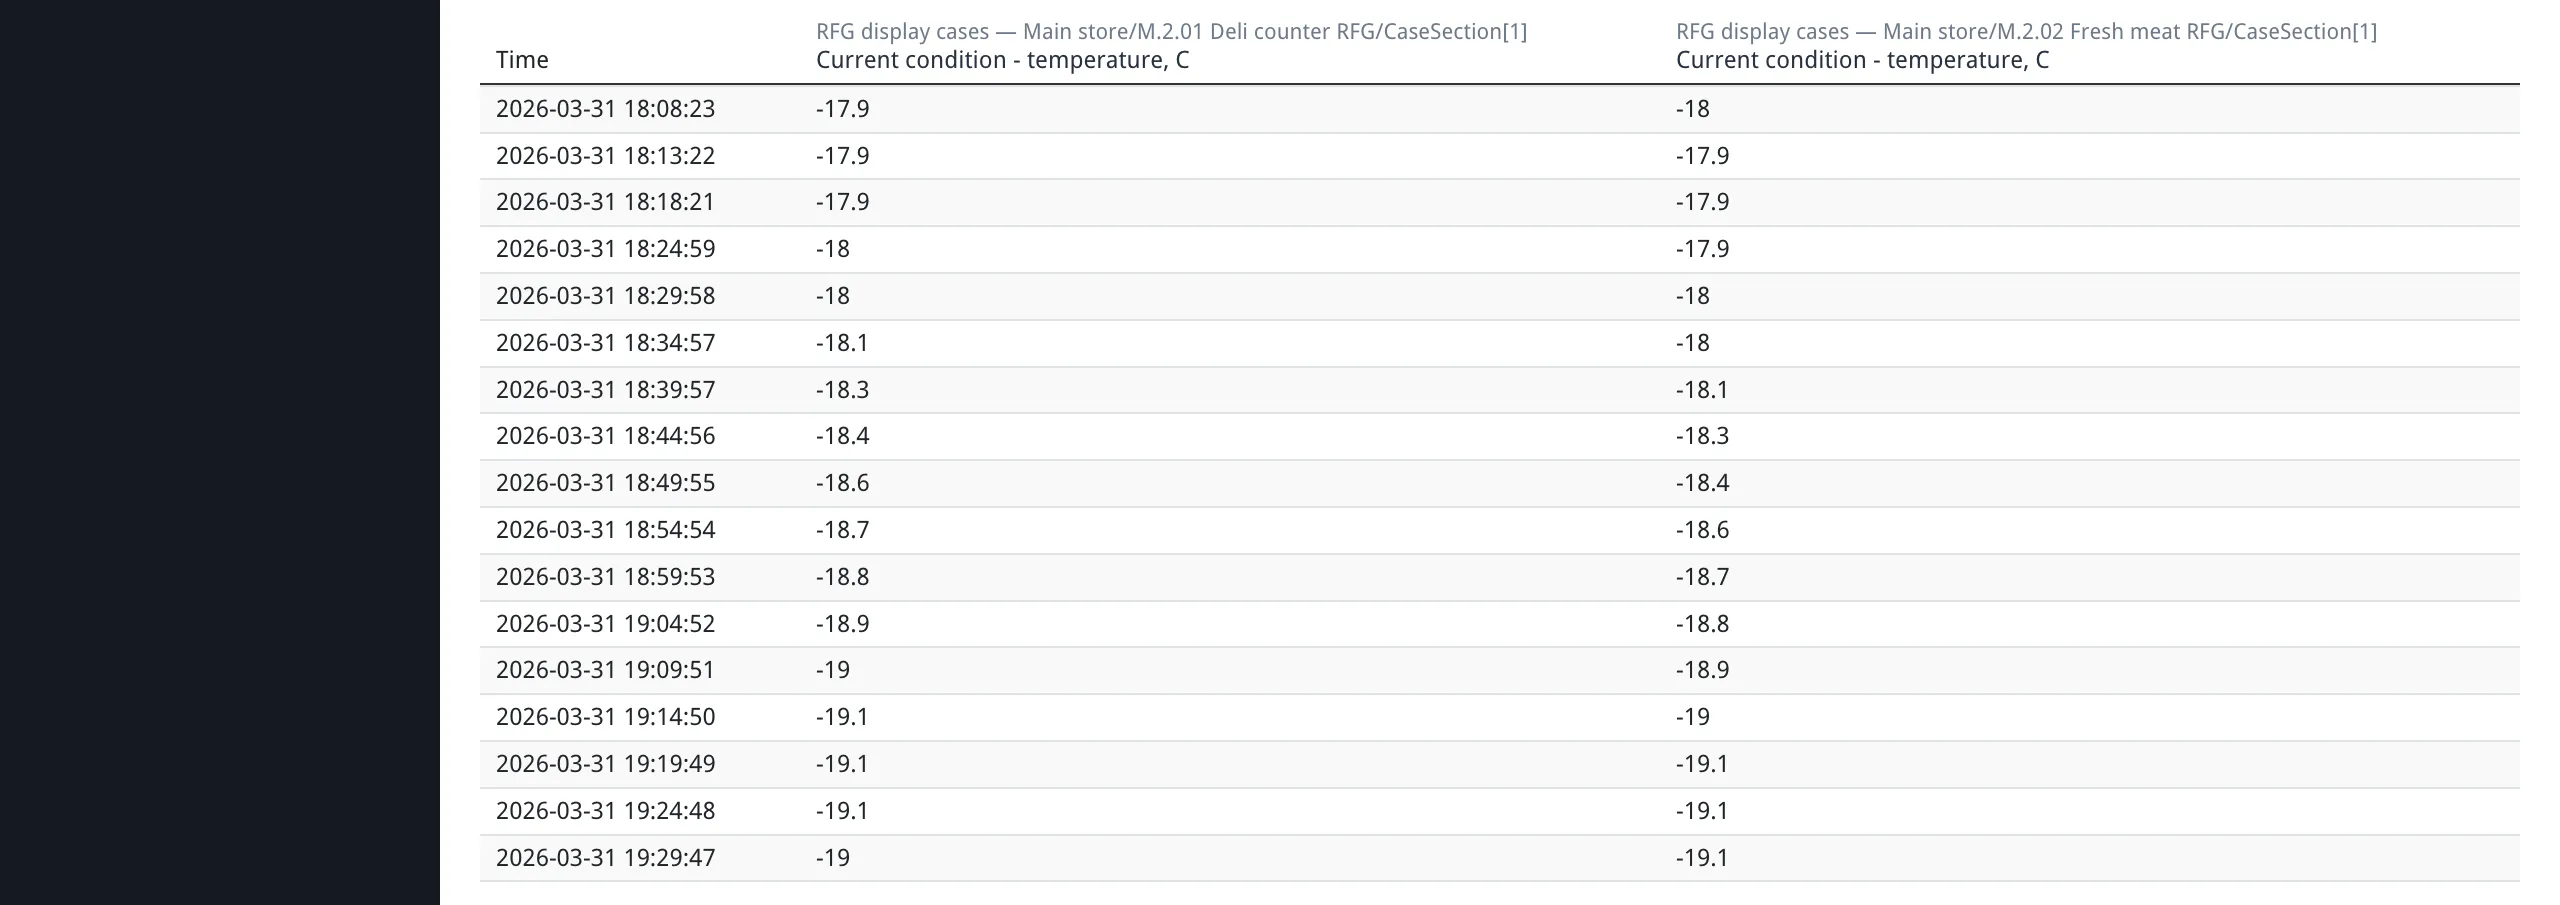
Columns are:
| Column | Content |
|---|---|
| Time | Timestamp of the reading |
| Parameter columns | One column per selected parameter, showing the device name in the header and the parameter name below it |
Readings from different parameters that occur within 60 seconds of each other are merged into the same row. As you pan or zoom the chart, the table updates to show only the rows within the visible window.
Exporting Data
Section titled “Exporting Data”The export form appears below the data table when parameters are selected. It has its own from/till date pickers (date only, no time — exports always cover full days) that are independent of the chart view range.

- Set the from and till dates for the export period.
- Choose the format: CSV or Excel (XLSX).
- Click Download. The file downloads in a new browser tab.
The exported file contains all raw readings (not sampled) for the selected parameters within the chosen date range. The date pickers default to the last 7 days. Timestamps in the exported file use your browser’s local timezone.
Saving Reports and Automated Mailing
Section titled “Saving Reports and Automated Mailing”Saving a Report
Section titled “Saving a Report”When viewing the report with parameters selected, a save form appears inline next to the parameter tree’s action bar:
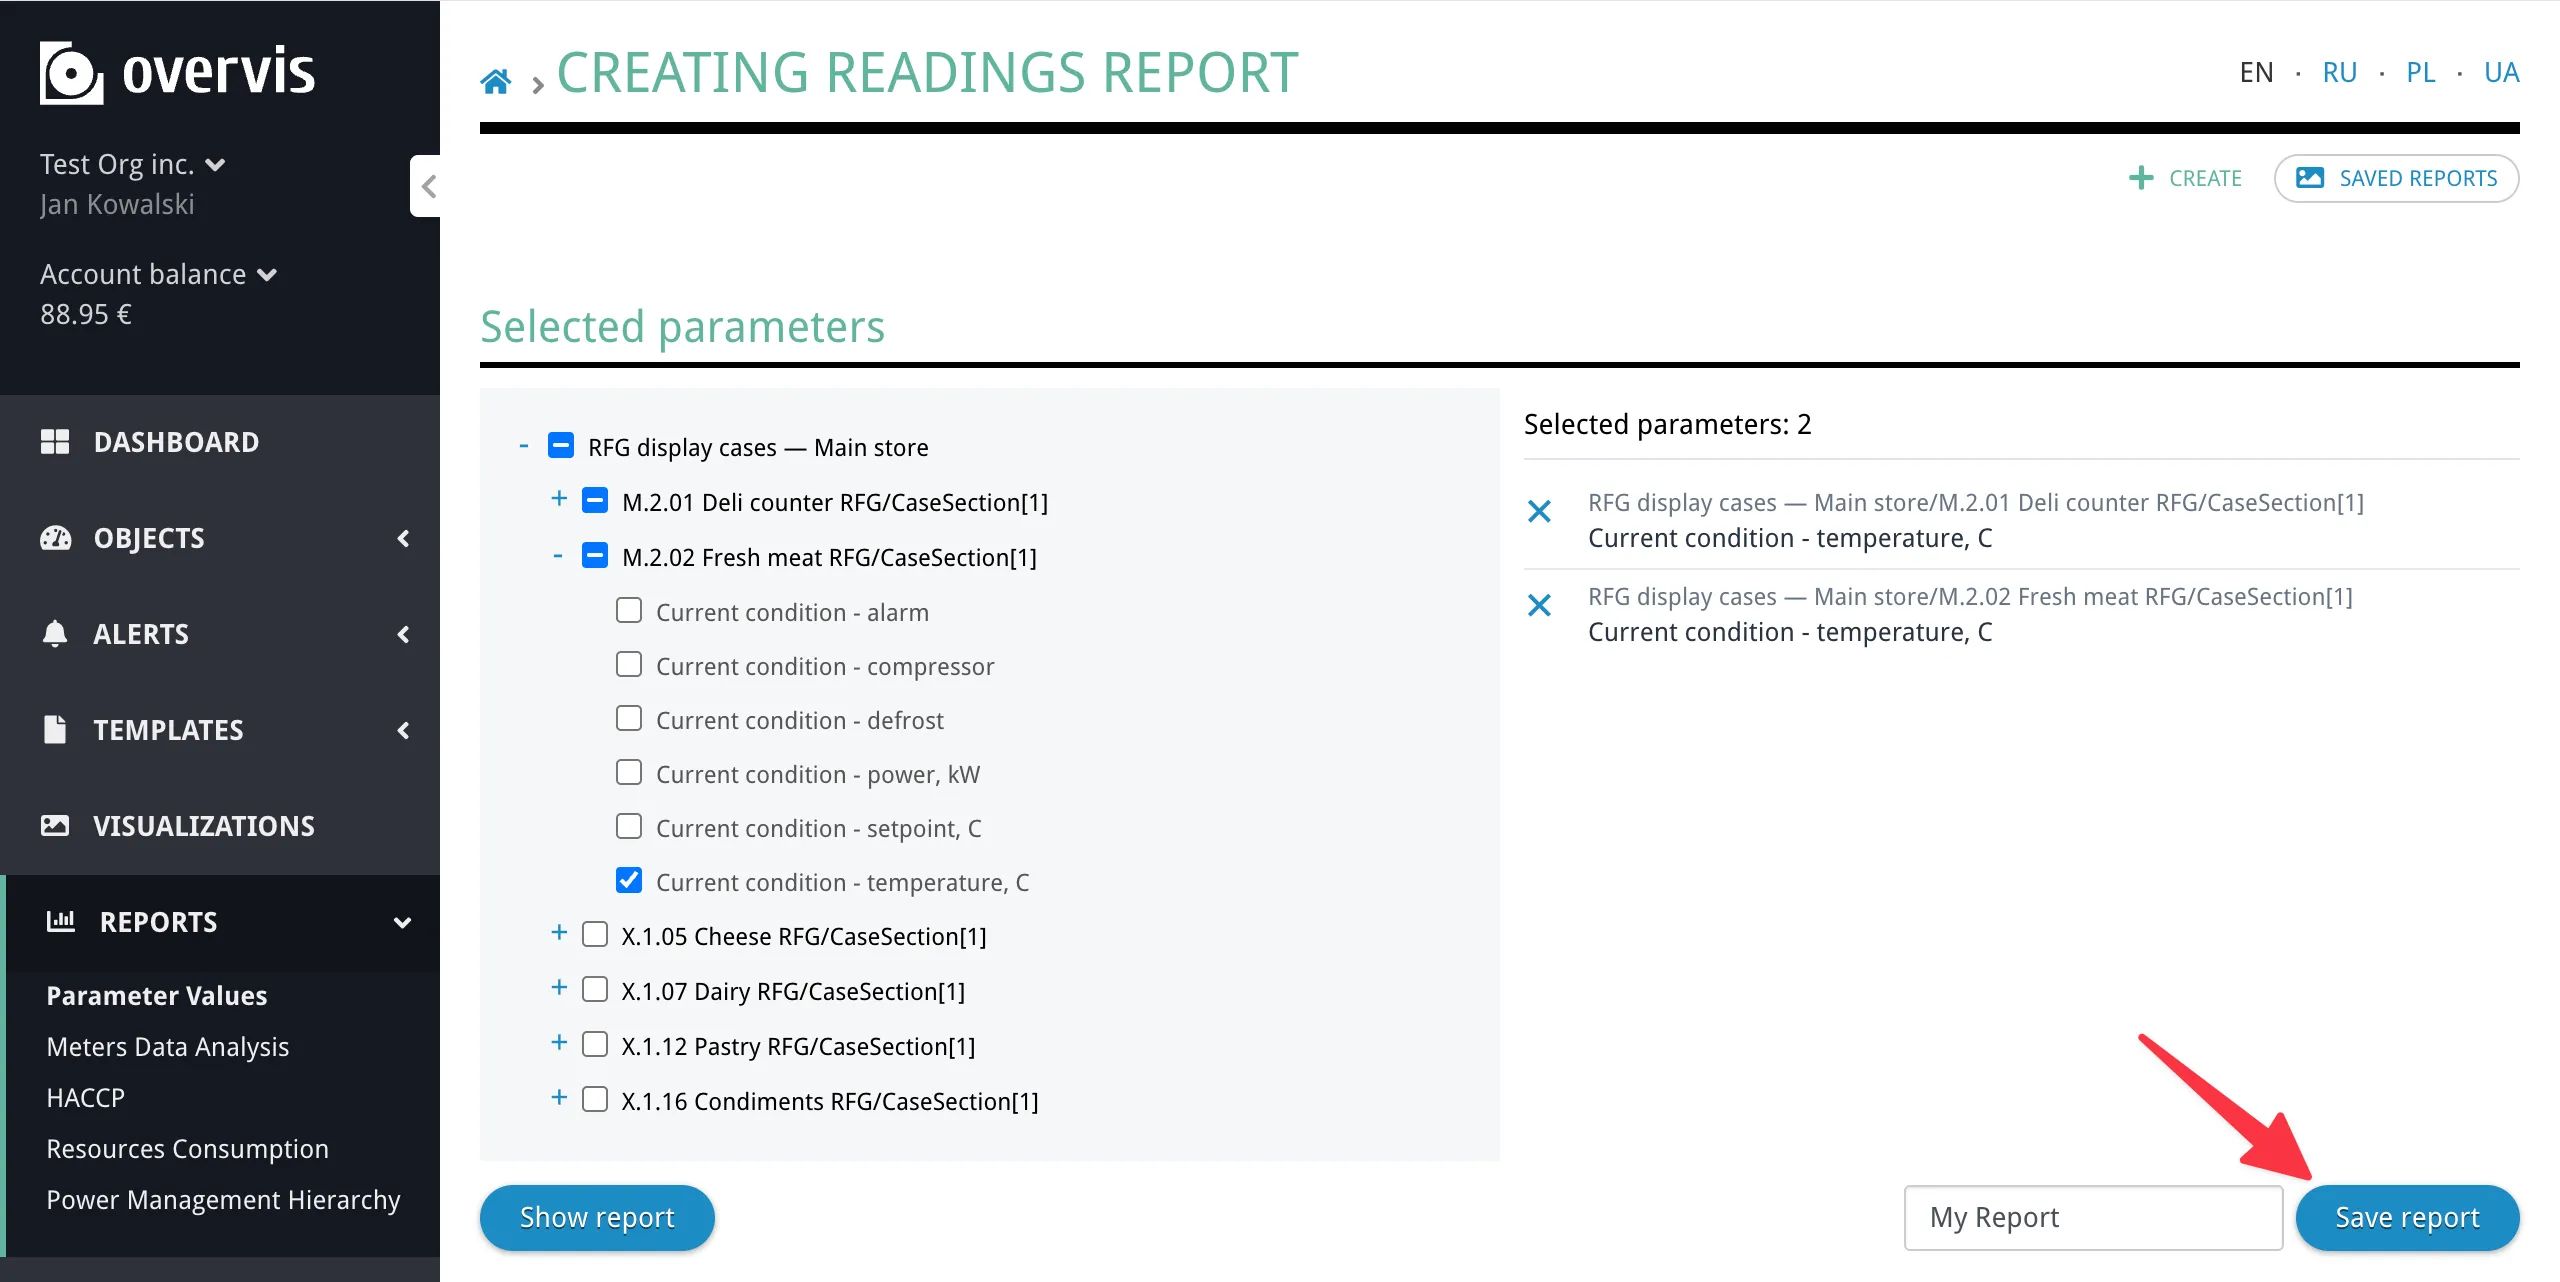
- Enter a name for the report (minimum 3 characters).
- Click Save report. The report stores the current parameter selection and view state (decimal precision, line visibility, multiplier/shift transforms, and the selected preset).
Updating a Saved Report
Section titled “Updating a Saved Report”When viewing a saved report, the save form is replaced with an update form (the page heading may read Update saved report). You can change the name, modify the parameter selection, adjust line transforms, and click Update report to save the changes.
Saved Reports List
Section titled “Saved Reports List”Open Reports → Parameter Values, then use Saved reports in the readings section to open the list of saved reports (not a separate top-level menu item). The list shows each report’s name and creation date.
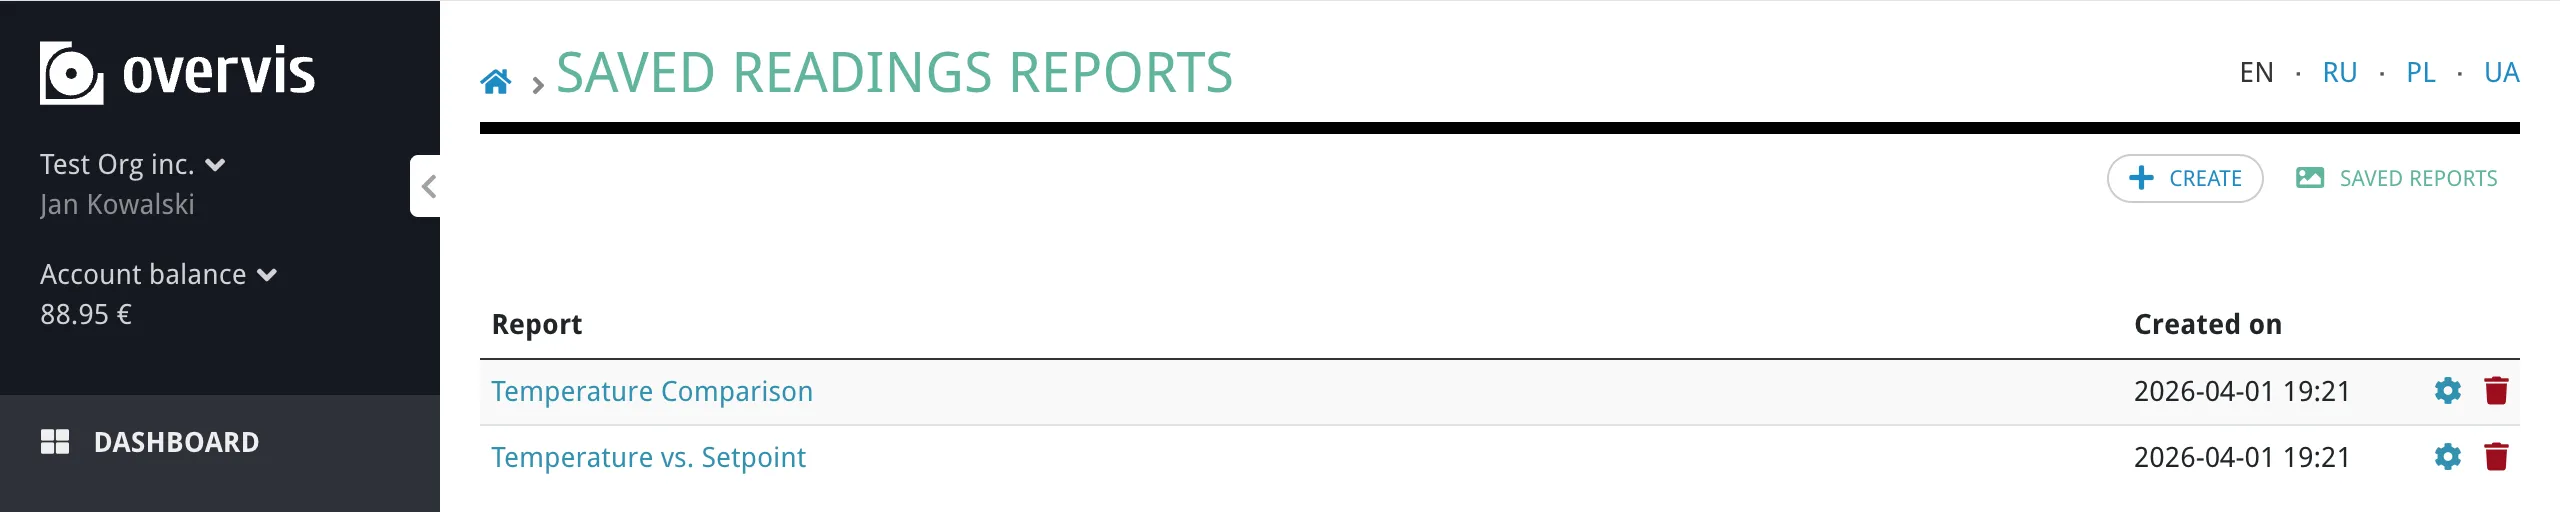
From here you can:
- Open the report to view or update it.
- Configure automated mailing (gear icon).
- Delete the report (trash icon).
Automated Mailing
Section titled “Automated Mailing”For each saved report, you can set up automatic delivery of the readings data to email recipients:
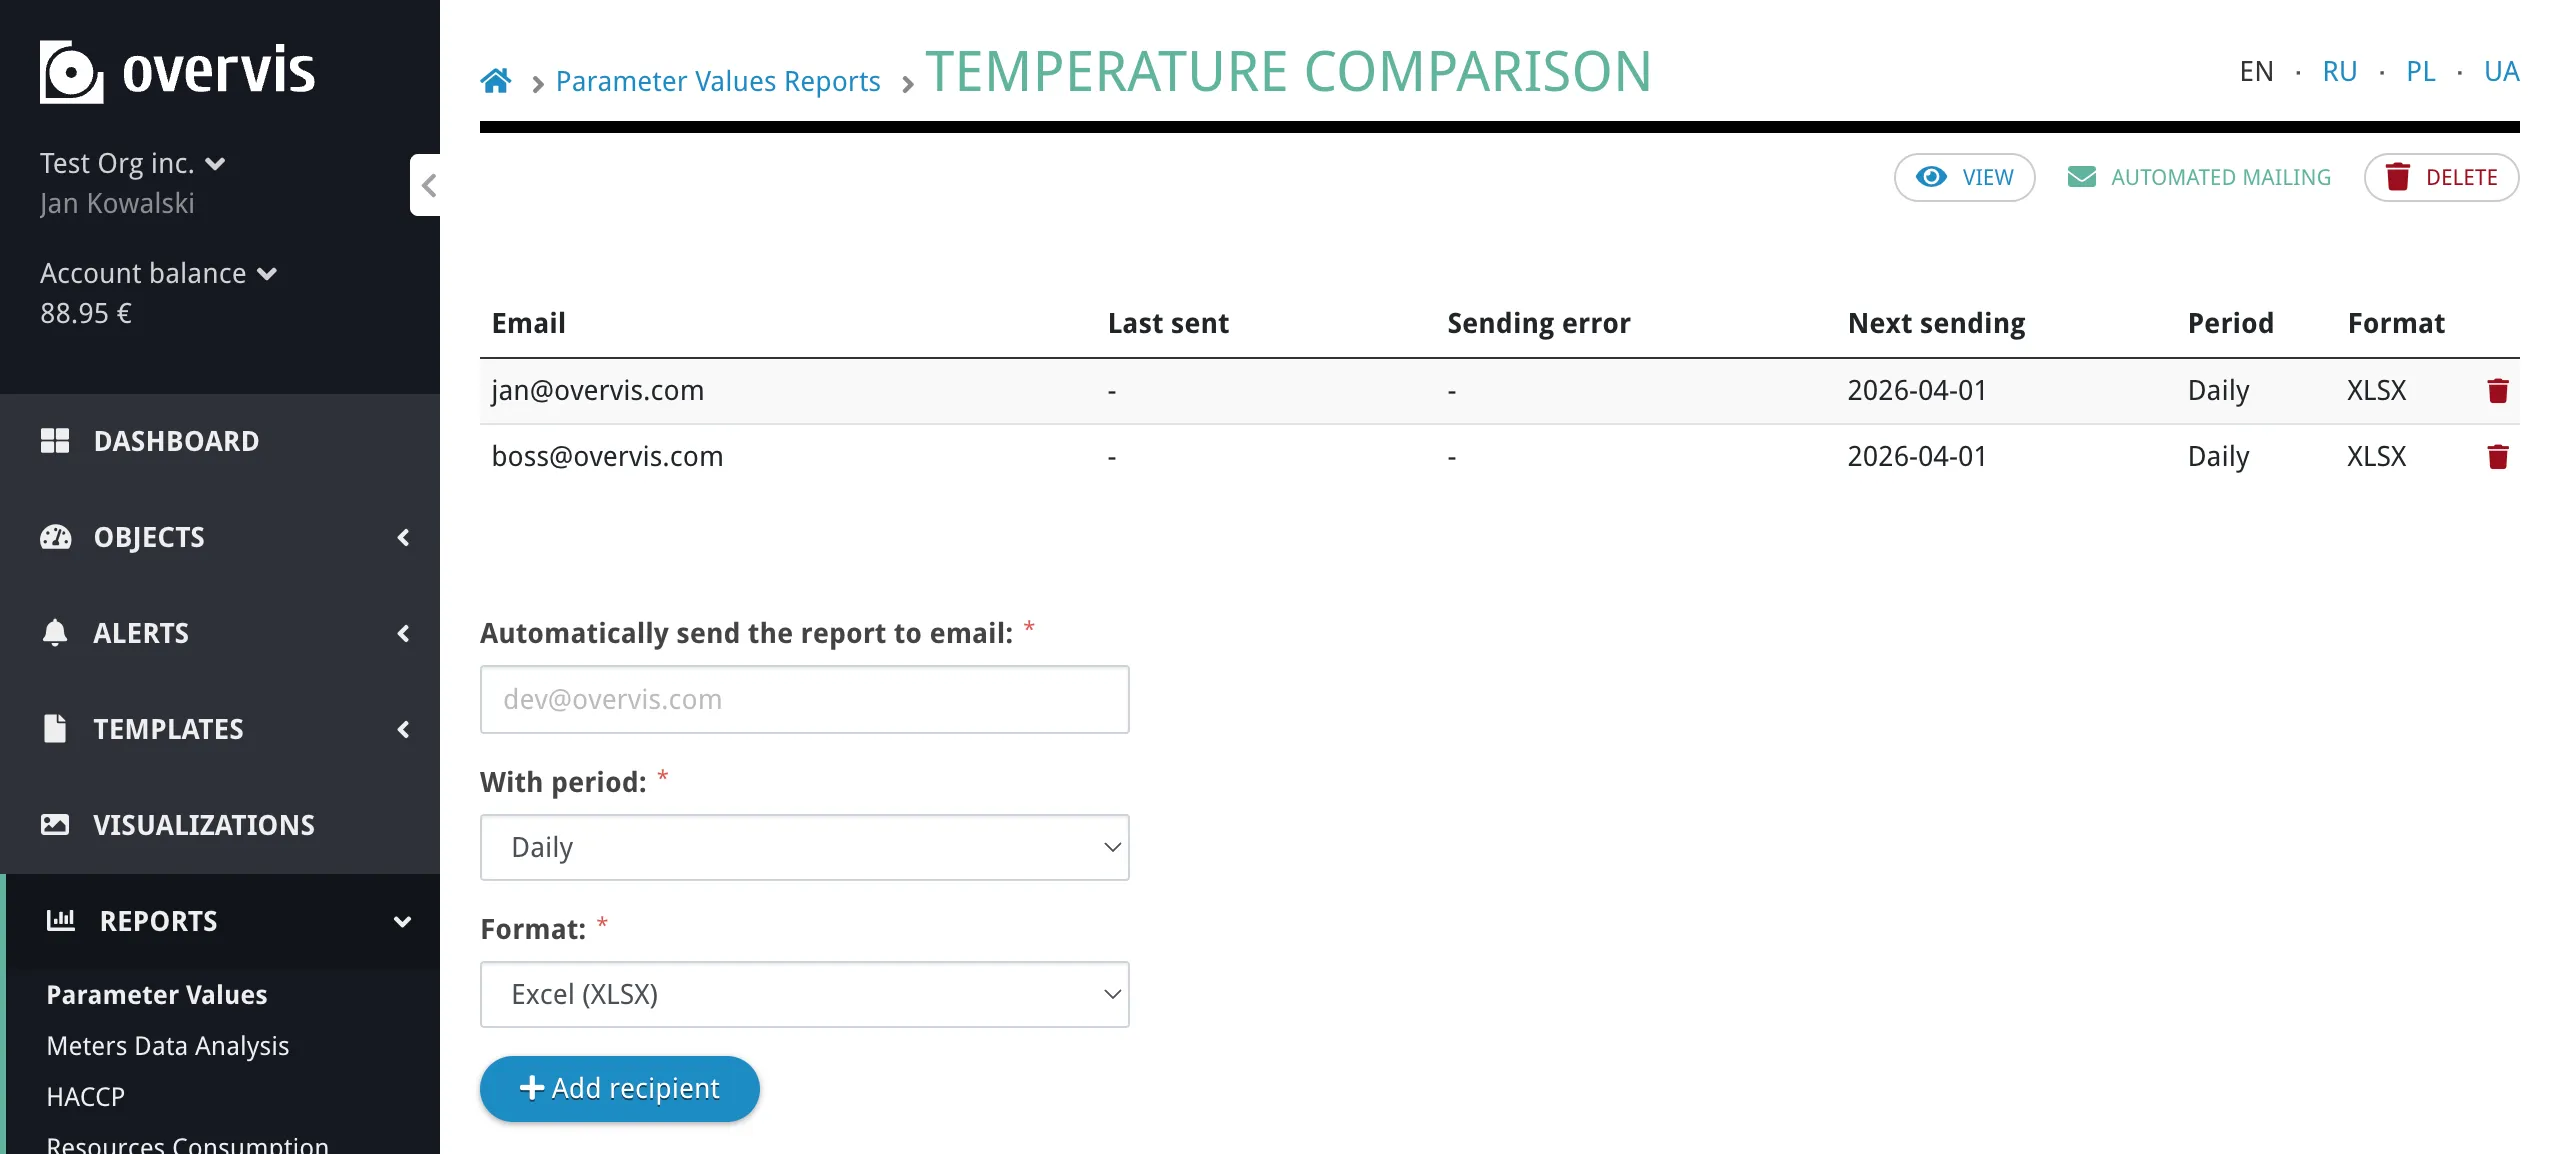
- Open the saved report’s mailing settings (gear icon in the saved reports list).
- Enter an email address.
- Choose a period: Daily, Weekly, or Monthly.
- Choose a format: Excel (XLSX) or CSV.
- Click Add recipient.
You can add multiple recipients with different periods and formats. Each email-period-format combination must be unique per report.
The mailing list table shows the following for each recipient:
| Column | Content |
|---|---|
| Recipient email address | |
| Last sent | Date when the report was last sent to this recipient |
| Sending error | Error message if the last send attempt failed |
| Next sending | Scheduled date for the next report delivery |
| Period | Daily, Weekly, or Monthly |
| Format | XLSX or CSV |
The automated mailing sends data for the previous period: daily mailings include the previous day, weekly include the previous 7 days, and monthly include the previous month. Timestamps in mailed reports use UTC.
Shareable Links
Section titled “Shareable Links”The report URL preserves the full view state in the URL hash, including the time range, decimal precision, and per-line visibility/transform settings. You can copy the URL from the browser address bar and share it — anyone with access to the organization will see the same view.
Troubleshooting
Section titled “Troubleshooting”No Data Appears on the Chart
Section titled “No Data Appears on the Chart”Possible causes:
- The parameter is not tracked (history recording is not enabled).
- No readings exist for the selected time range.
- The device was disconnected during the selected time range.
Solutions:
- Verify the parameter has tracking enabled on the device or parameter settings page.
- Try selecting a wider time range (e.g., Last 30 days) to see if data exists at all.
- Check the device connection status on the device details page or dashboard.
Chart Shows Gaps or Breaks in the Line
Section titled “Chart Shows Gaps or Breaks in the Line”Gaps indicate periods when no readings were recorded. This typically happens when:
- The device was offline or the gateway lost its internet connection.
- Polling was temporarily interrupted (e.g., during a network reconfiguration).
- The parameter was added to tracking after some data had already been collected for other parameters.
There is no corrective action for past gaps — they reflect the actual data availability. To prevent future gaps, ensure the gateway has a stable internet connection and the device is powered on.
Export File Contains No Data or Fewer Rows Than Expected
Section titled “Export File Contains No Data or Fewer Rows Than Expected”Possible causes:
- The export date range does not overlap with the period when the parameter was tracked.
- The parameter was recently added to tracking and has limited history.
Solutions:
- Check the export date pickers — they are independent of the chart view range and default to the last 7 days.
- Widen the export date range to cover a larger period.
- On the chart, switch to a wider preset (e.g., Last 365 days) to confirm when data collection started.
Auto-Refresh Stopped Working
Section titled “Auto-Refresh Stopped Working”Auto-refresh only works with rolling presets (Last 5 min through Last 365 days). It stops when:
- The preset switches to Custom, which happens automatically when you pan or zoom the chart.
- The browser tab is in the background (browsers throttle background tabs).
To restart auto-refresh, select a rolling preset from the dropdown.
Automated Mailing Not Received
Section titled “Automated Mailing Not Received”Solutions:
- Check the spam/junk folder in your email client.
- In the mailing list table, check the Sending error column — it shows the error message if the last delivery attempt failed.
- Verify the email address is correct in the mailing settings.
- If the organization is temporarily disabled (e.g., due to billing), mailings are paused until the organization is re-enabled.
Report Is Slow to Load or Unresponsive
Section titled “Report Is Slow to Load or Unresponsive”Possible causes:
- Too many parameters selected at once.
- A very long time range with dense data.
Solutions:
- Reduce the number of selected parameters.
- Use a shorter time range preset.
- If viewing a long range (e.g., Last 365 days), note that the chart samples up to 1000 points per parameter for responsive performance. The full data is available via export.
Common Questions
Section titled “Common Questions”How many parameters can I display at once?
Section titled “How many parameters can I display at once?”There is a per-deployment configurable limit. The exact number is shown in the placeholder message below the parameter tree when no parameters are selected (same wording as in the app, e.g. Please select up to {} parameters to display. — with the limit filled in, such as 10). If you need to compare more parameters, create multiple saved reports with different parameter sets.
Does the chart show every single data point?
Section titled “Does the chart show every single data point?”No. The chart shows up to 1000 sampled data points per parameter for the visible window. This sampling ensures the chart remains responsive even over long time ranges. For complete raw data without sampling, use Download on the export form, which includes all readings within the chosen date range.
What timezone is used?
Section titled “What timezone is used?”- The chart and data table display timestamps in your browser’s local timezone.
- Browser exports (CSV/XLSX downloaded via the Download button) use your browser’s local timezone.
- Automated mailing reports use UTC for timestamps.
Can I share a report view with a colleague?
Section titled “Can I share a report view with a colleague?”Yes. Copy the URL from the browser address bar — it includes the current time range, decimal precision, and line transform settings in the URL hash. Anyone with access to the same organization can open the link and see the same view. They must be logged in to Overvis.
What is the difference between chart data and exported data?
Section titled “What is the difference between chart data and exported data?”The chart and table display sampled data — up to 1000 points per parameter, spread across the visible time window. This is sufficient for visual analysis but is not the full dataset.
The export feature produces a file with all raw readings — every recorded value for the selected parameters within the export date range. Use exports when you need complete data for external analysis or archiving.
Why are some table rows missing values for certain parameters?
Section titled “Why are some table rows missing values for certain parameters?”The table merges readings from different parameters that occur within 60 seconds of each other into the same row. If a parameter did not report a value near that timestamp, its cell shows a dash (-). This is normal when parameters have different polling intervals or reporting frequencies.
What happens if I delete a saved report that has automated mailing?
Section titled “What happens if I delete a saved report that has automated mailing?”Deleting a saved report also removes all associated mailing records. Recipients will stop receiving automated reports. A confirmation step is shown before deletion.
Can I use the report in the monitoring (view-only) interface?
Section titled “Can I use the report in the monitoring (view-only) interface?”Yes. The report is available in the monitoring interface at the same URL pattern. Users with view-only access can view charts, tables, and use the export feature. However, saving reports and configuring automated mailing require manage-level access.