Dashboard
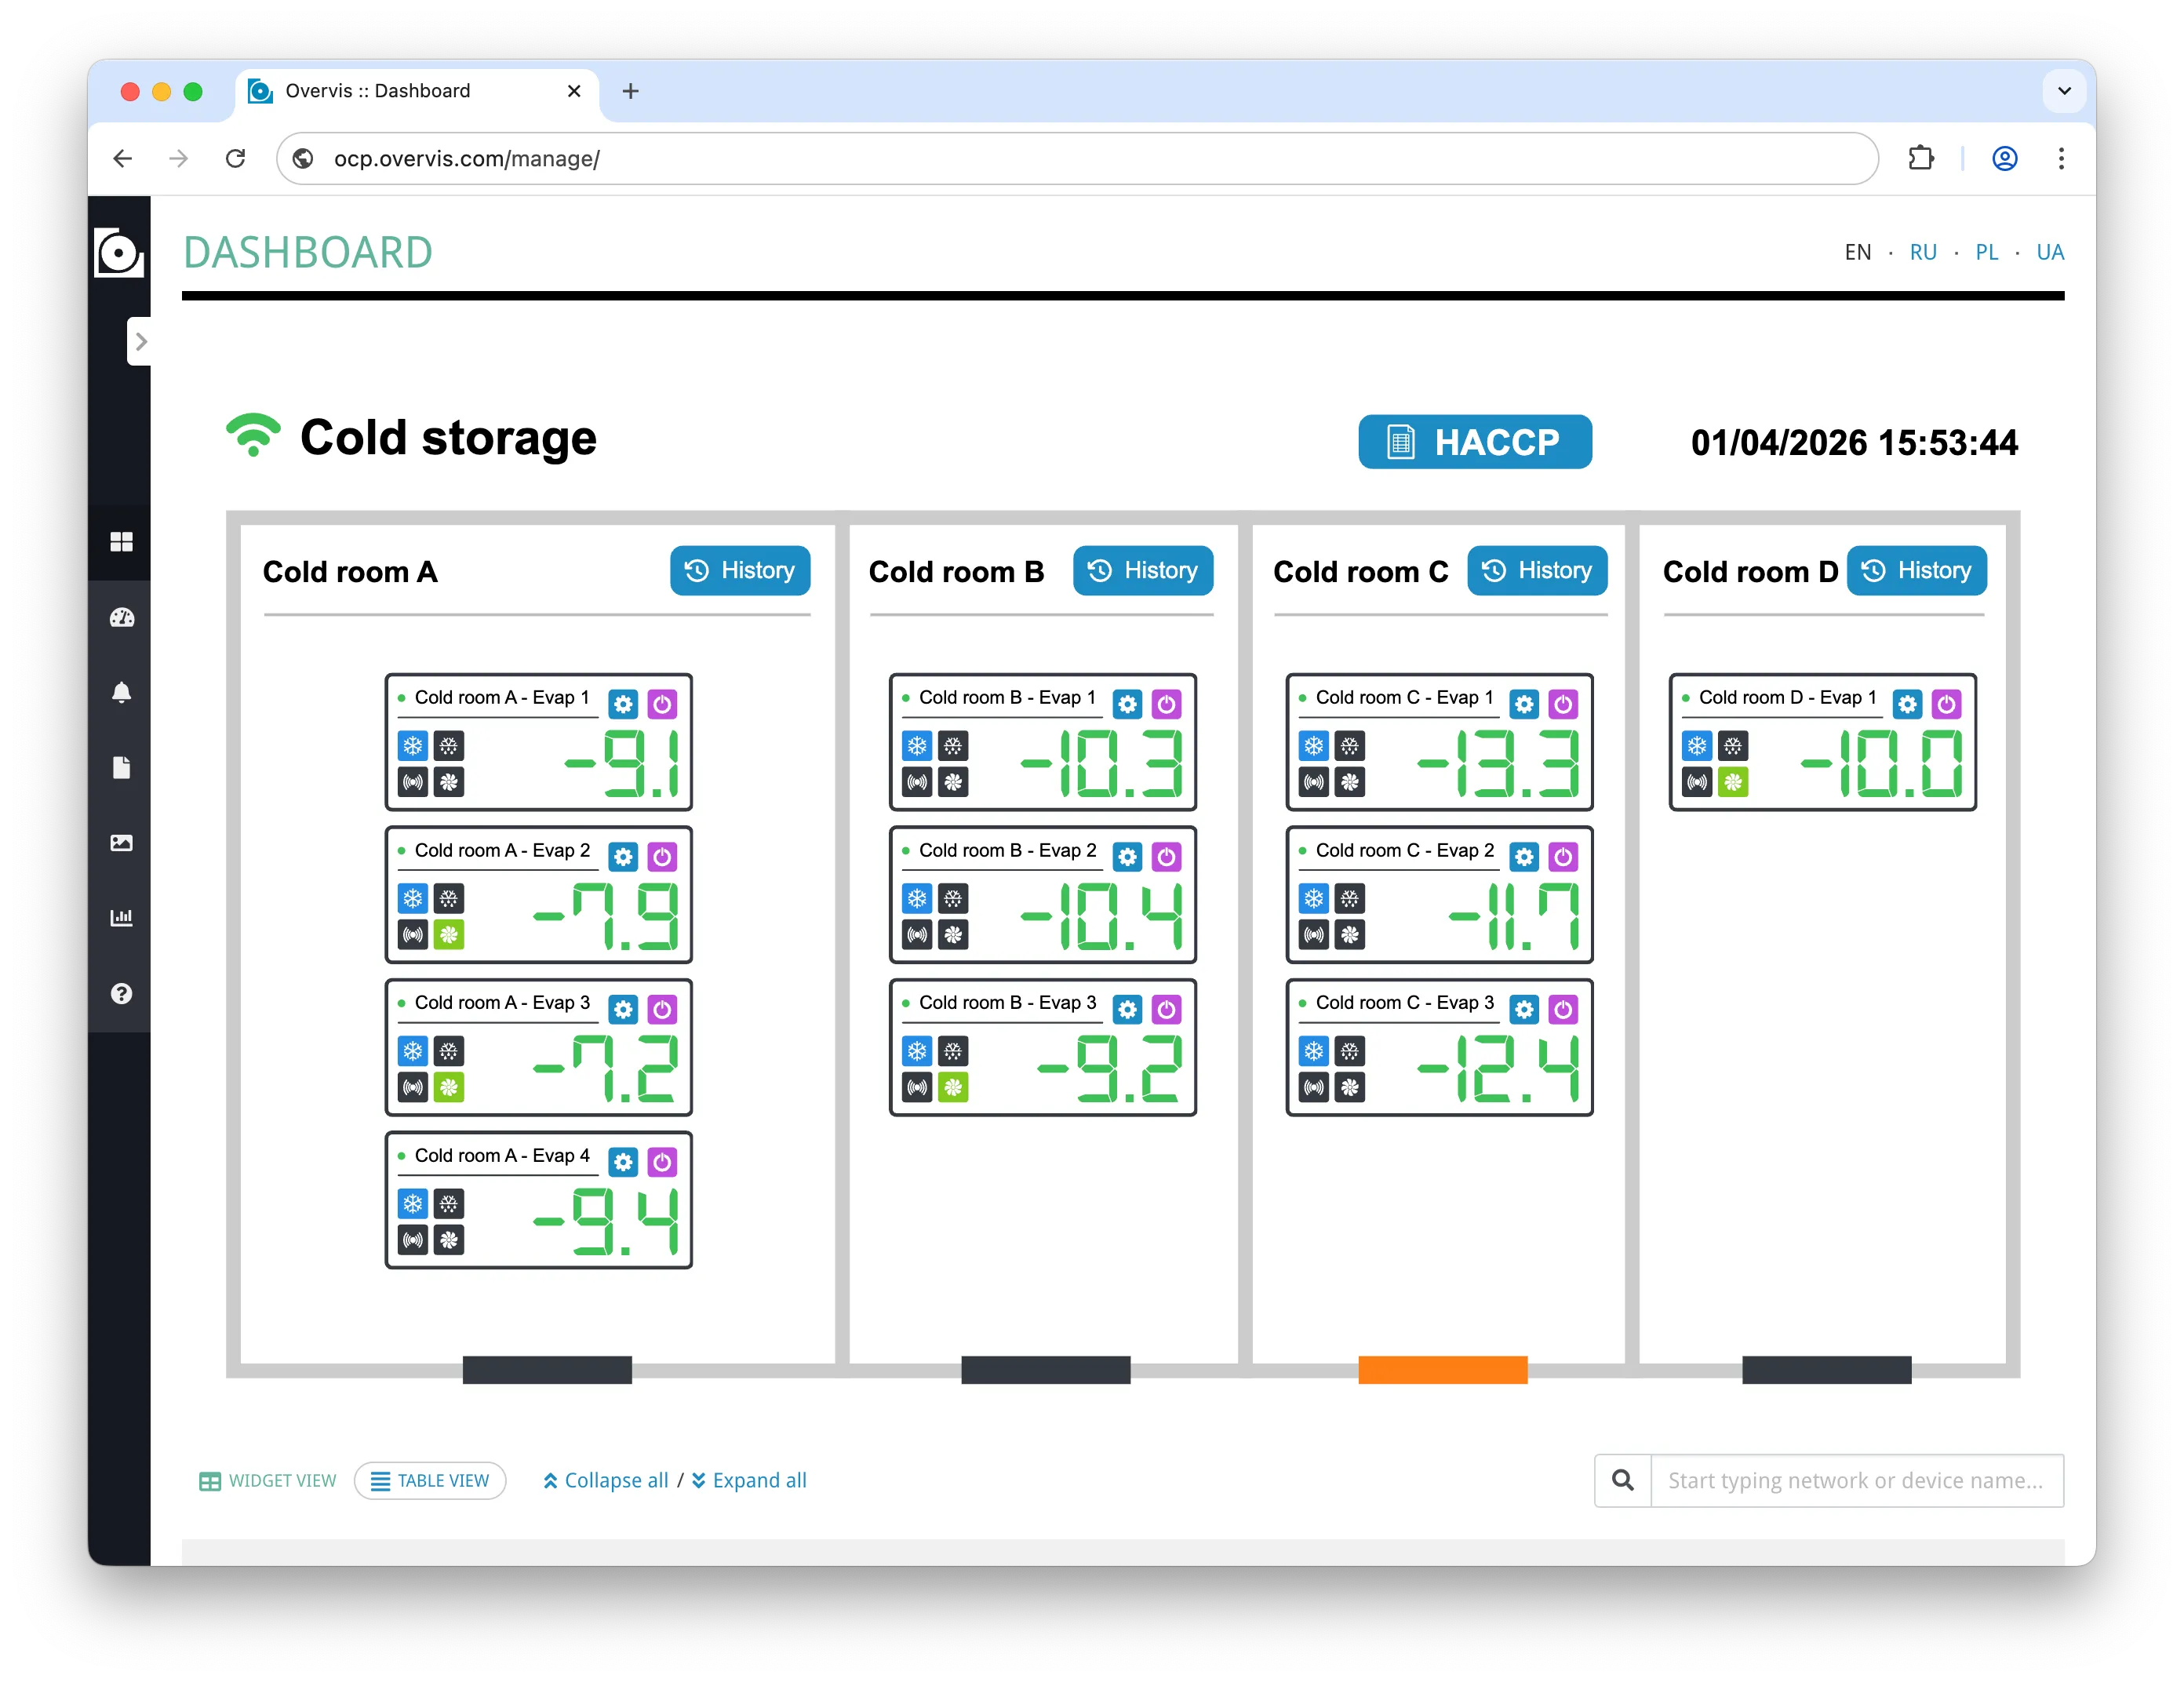
The Dashboard is the organization-level overview page in Overvis Cloud. It brings together the most important parameters from all your networks and devices into a single screen, so you can monitor live values, check connection status, see active alerts, and write values to programmable parameters — all without navigating to individual device pages.
The dashboard shows two kinds of content:
- Parameter widgets — individual parameters you have added to the dashboard. These are organized by network and device automatically.
- Visualizations — custom interactive widgets configured to appear on the dashboard. These are rendered above the parameter widgets. See Visualizations for details.
The parameter widget set is shared across the organization — all users in the same organization see the same parameters on the dashboard. There are no per-user layouts, custom arrangements, or multiple dashboards per organization.
Manage and Monitoring Modes
Section titled “Manage and Monitoring Modes”Overvis provides the dashboard in two modes:
| Mode | URL path | Purpose |
|---|---|---|
| Manage | /manage/ | Full-featured dashboard for operators and administrators. Supports adding/removing parameter widgets, writing values to programmable parameters, and navigating to network and device settings. |
| Monitoring | /view/ | Read-only dashboard for display screens and view-only users. Shows the same data and layout, but hides management controls (add/remove, write). |
Both modes show the same organization-wide parameter widgets and visualizations. Users who open the manage dashboard without management permissions are redirected to the monitoring dashboard automatically.
The dashboard offers two layout options, toggled with the Widget view / Table view buttons at the top of the page. The selected view is remembered in the browser.
When the dashboard has more than three devices (across all networks), Collapse all / Expand all buttons appear next to the view toggle, allowing you to expand or collapse all network and device panels at once.
Widget View
Section titled “Widget View”Widget view is the default layout. The page is organized as expandable panels grouped by network and device.
Network panels — each network appears as a collapsible section showing:
- Network name (dimmed if the network is disabled).
- Connection status icon — a green check mark when connected, or a red cross when disconnected.
- Time since the last connection (e.g. “3 minutes ago”), or “Not connected.” if the network has never connected.
- An alarm bell icon if any active alert is associated with the network.
- When expanded in manage mode: a link to network details, and a Manage link for VPN-type networks.

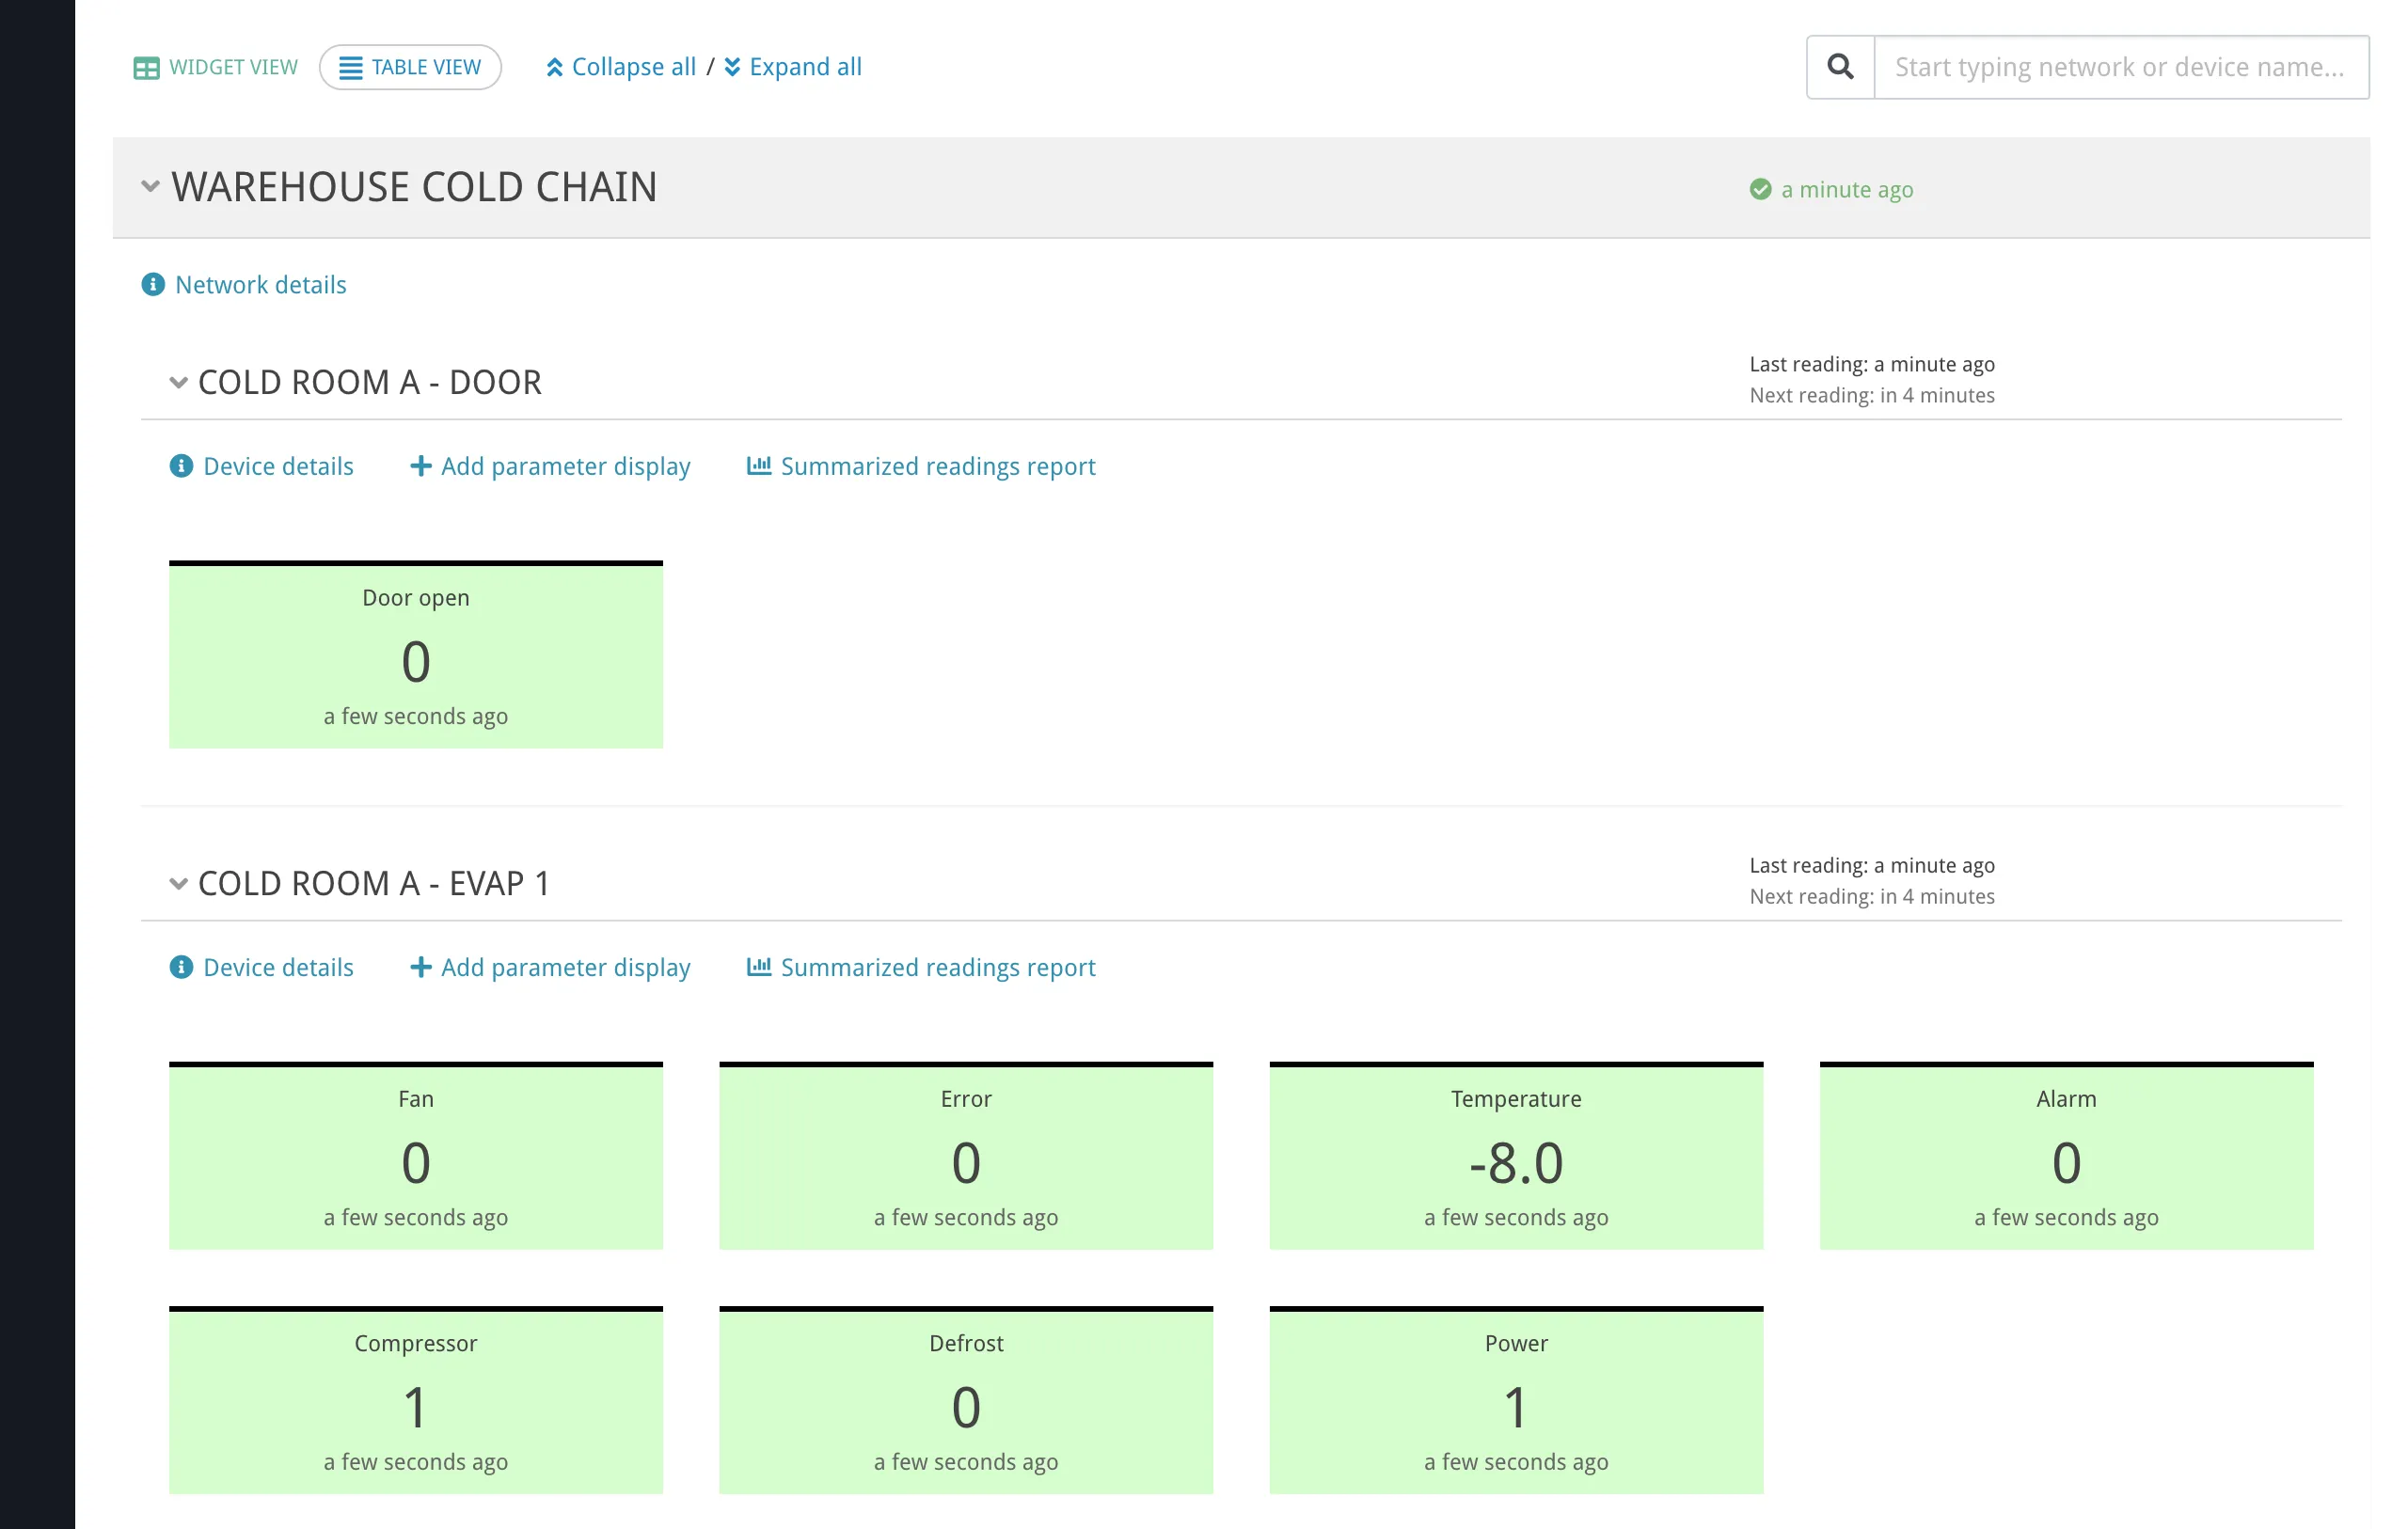
Device panels — inside each network, each device with dashboard parameters appears as a collapsible card showing:
- Device name.
- Last reading time (e.g. “Last reading: 3 minutes ago”), or “Never read.” if the device has not been read yet.
- Next scheduled reading (e.g. “Next reading: in 2 minutes”), or a status message if something prevents reading:
- “Network is unreachable” — the gateway/controller is offline.
- “No incoming network connection” — the reverse-connection gateway has not connected yet.
- “Device is unreachable” — the gateway is online but the device is not responding.
- “Currently reading” — a read is in progress right now.
- “Device is disabled” — the device has been disabled.
- “Background readings deactivated” — automatic readings are turned off.
- “Unknown device” — the device cannot be identified.
- Alert and event indicators for that device.
- A Summarized readings report link that opens a readings report for all parameter widgets displayed for that device.

Parameter widgets — inside each device panel, each parameter shows:
- Parameter name.
- Latest formatted value (with units), or ”–” if no reading is available or the device is disabled.
- Time of the latest reading.
- Visual status based on active alerts — normal (default), warning, or critical styling.
Expanding a parameter widget. Clicking a parameter widget expands it to show:
- Min and max values over the last 24 hours.
- A 24-hour history chart showing the last day of readings in 15-minute intervals.
- A Full history link to the complete readings report for that parameter.
- A realtime readings section that polls live values from the device every second while the widget remains expanded. Values are shown as a compact bar chart that fills with readings over time.
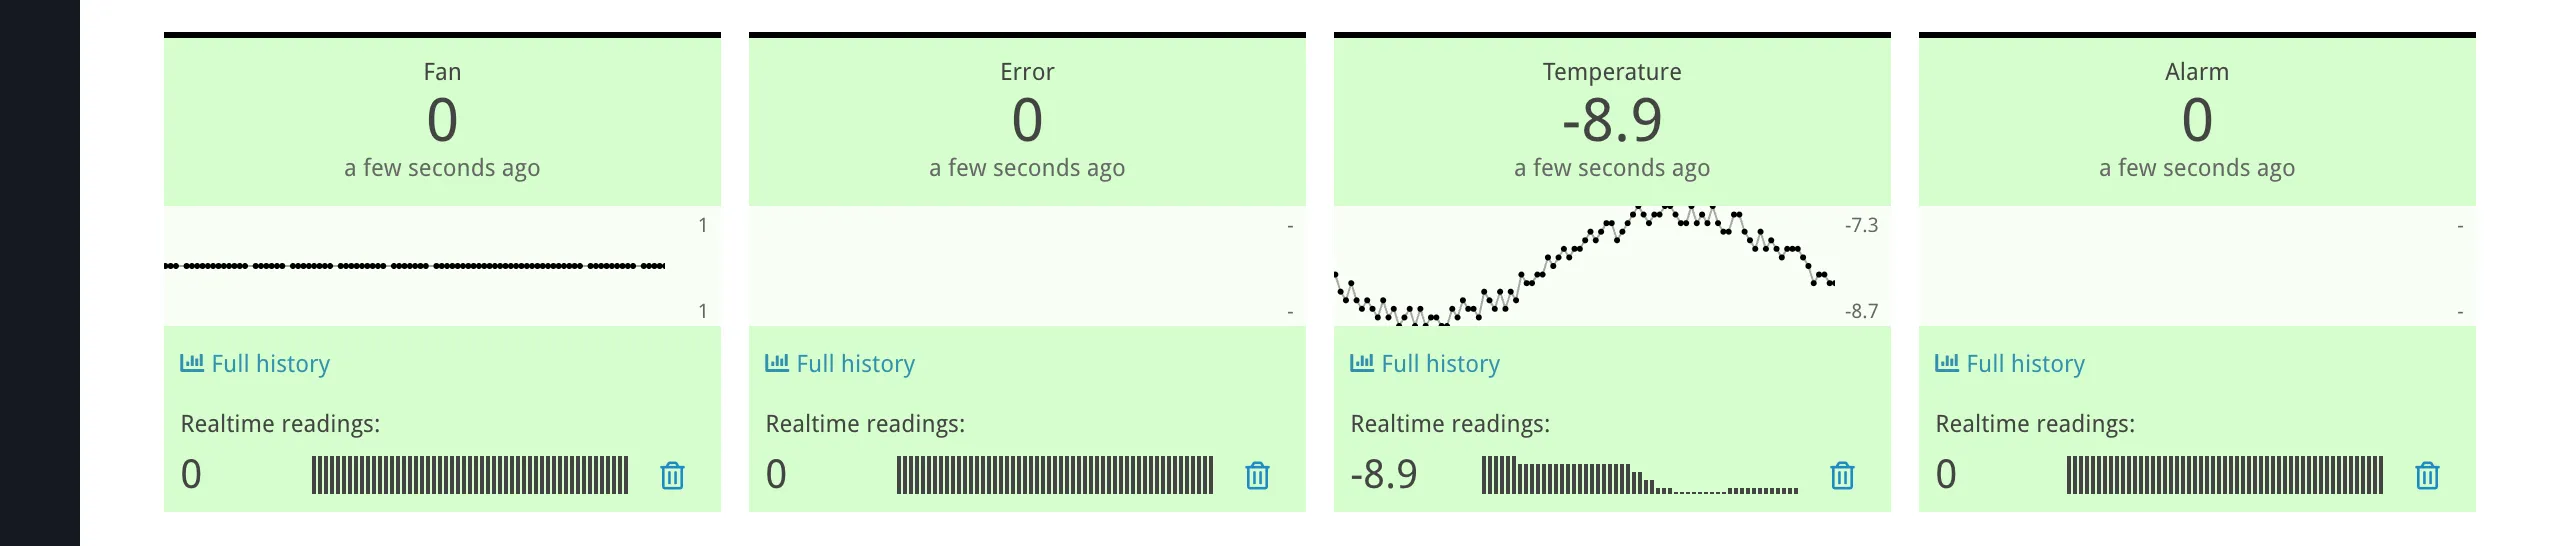
Realtime readings only work while the parameter widget is expanded. Collapsing the widget stops the polling. If the device is disabled, the realtime section shows “Device is disabled” instead.
Writing values. On the manage dashboard, clicking the value of a programmable parameter opens a write dialog where you can enter a new numeric value and send it to the device. Programmable parameters are indicated by a dashed underline and a pen icon on their value. Clicking the value opens the write modal; clicking elsewhere on the widget expands/collapses it.
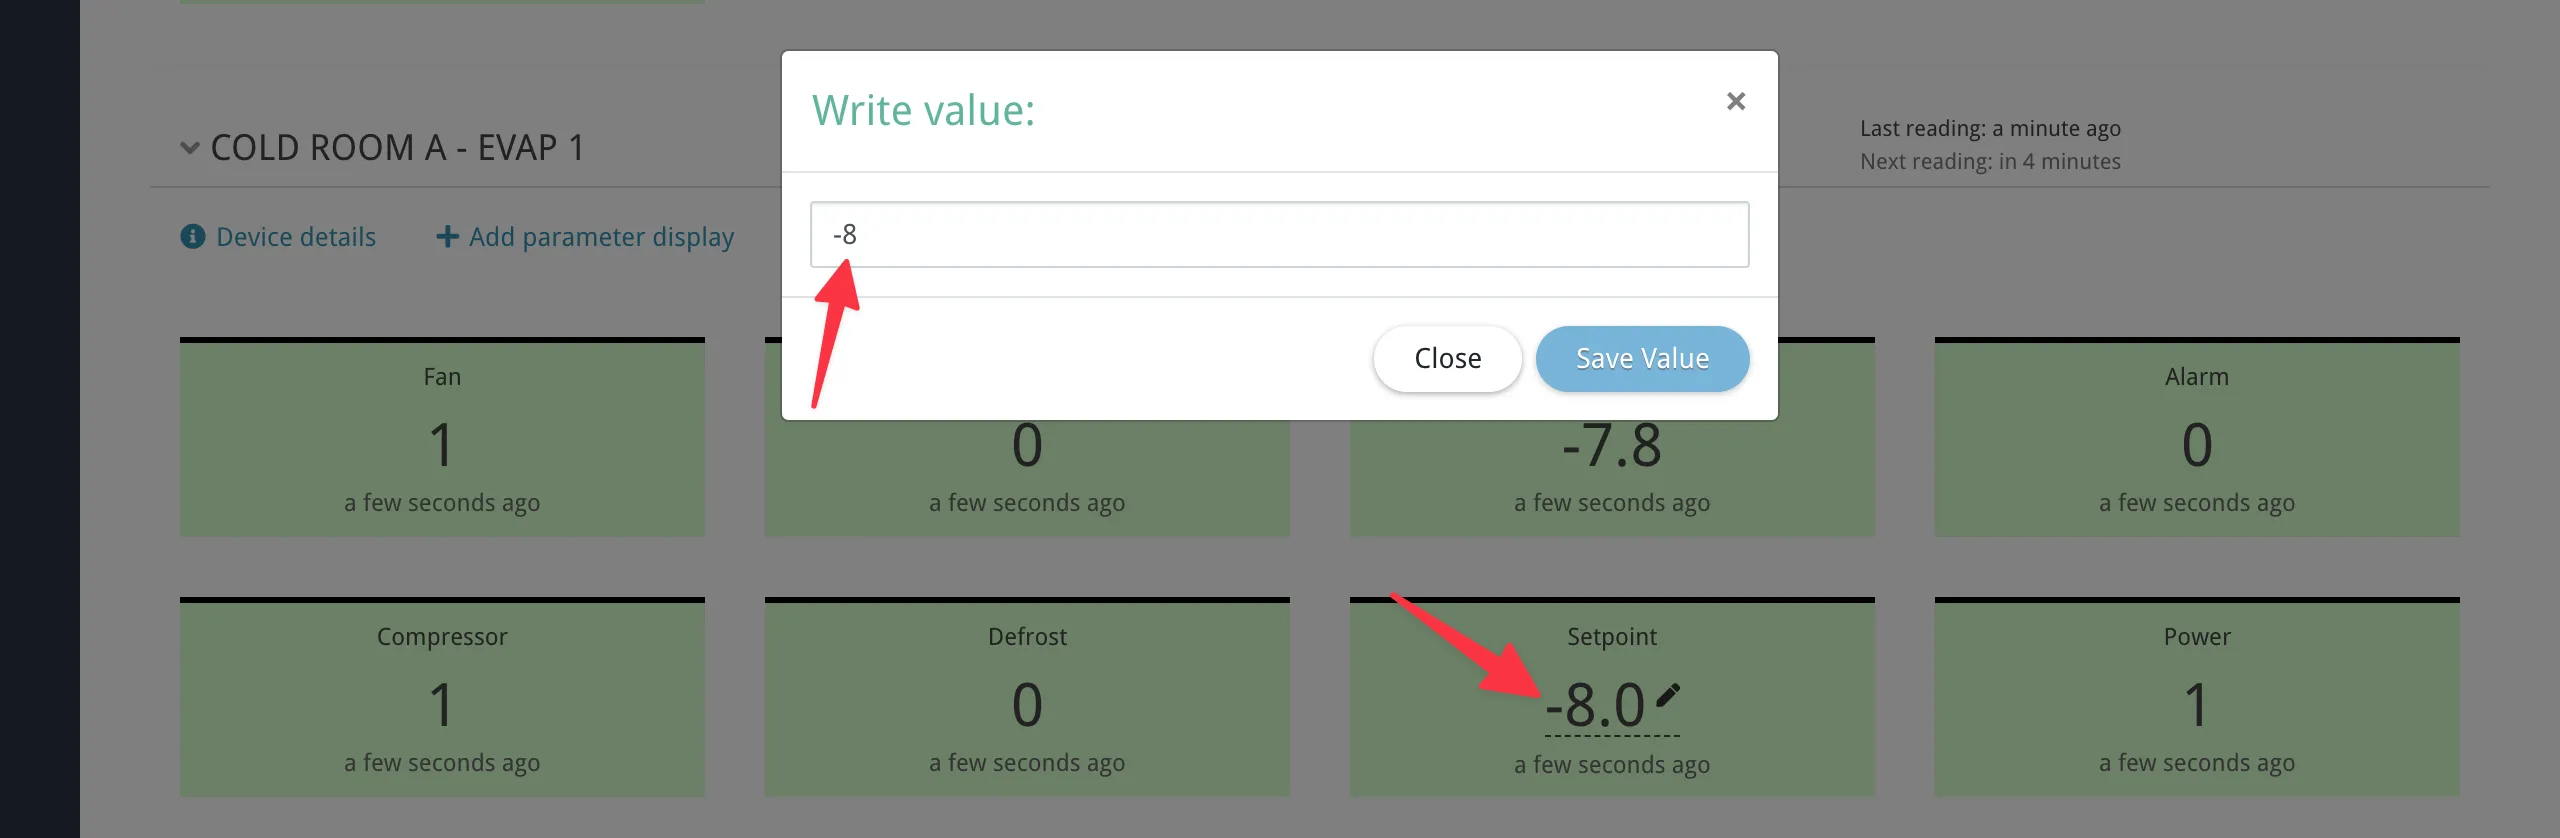
Table View
Section titled “Table View”Table view shows the same parameter widgets in a compact tabular layout. Instead of nested network and device panels, devices are listed as flat rows: each row is labeled with that device’s network name and device name, separated by » (same pattern as in the interface).
Expanding a device row shows a table with the columns listed below. In the UI, the header row shows Parameter as text; the next header cell is a sync icon only; the third and fourth header cells have no text labels.
| Column | Content |
|---|---|
| Parameter | Parameter name, plus alert/event indicators. |
| Sync | Toggle button to start/stop realtime reading for that parameter. The icon spins while active. |
| Value | Latest formatted value (live value when sync is active). |
| Chart | Link to the full readings history for that parameter. |
The sync icon in the device header row toggles realtime reading for all displayed parameters on that device at once.
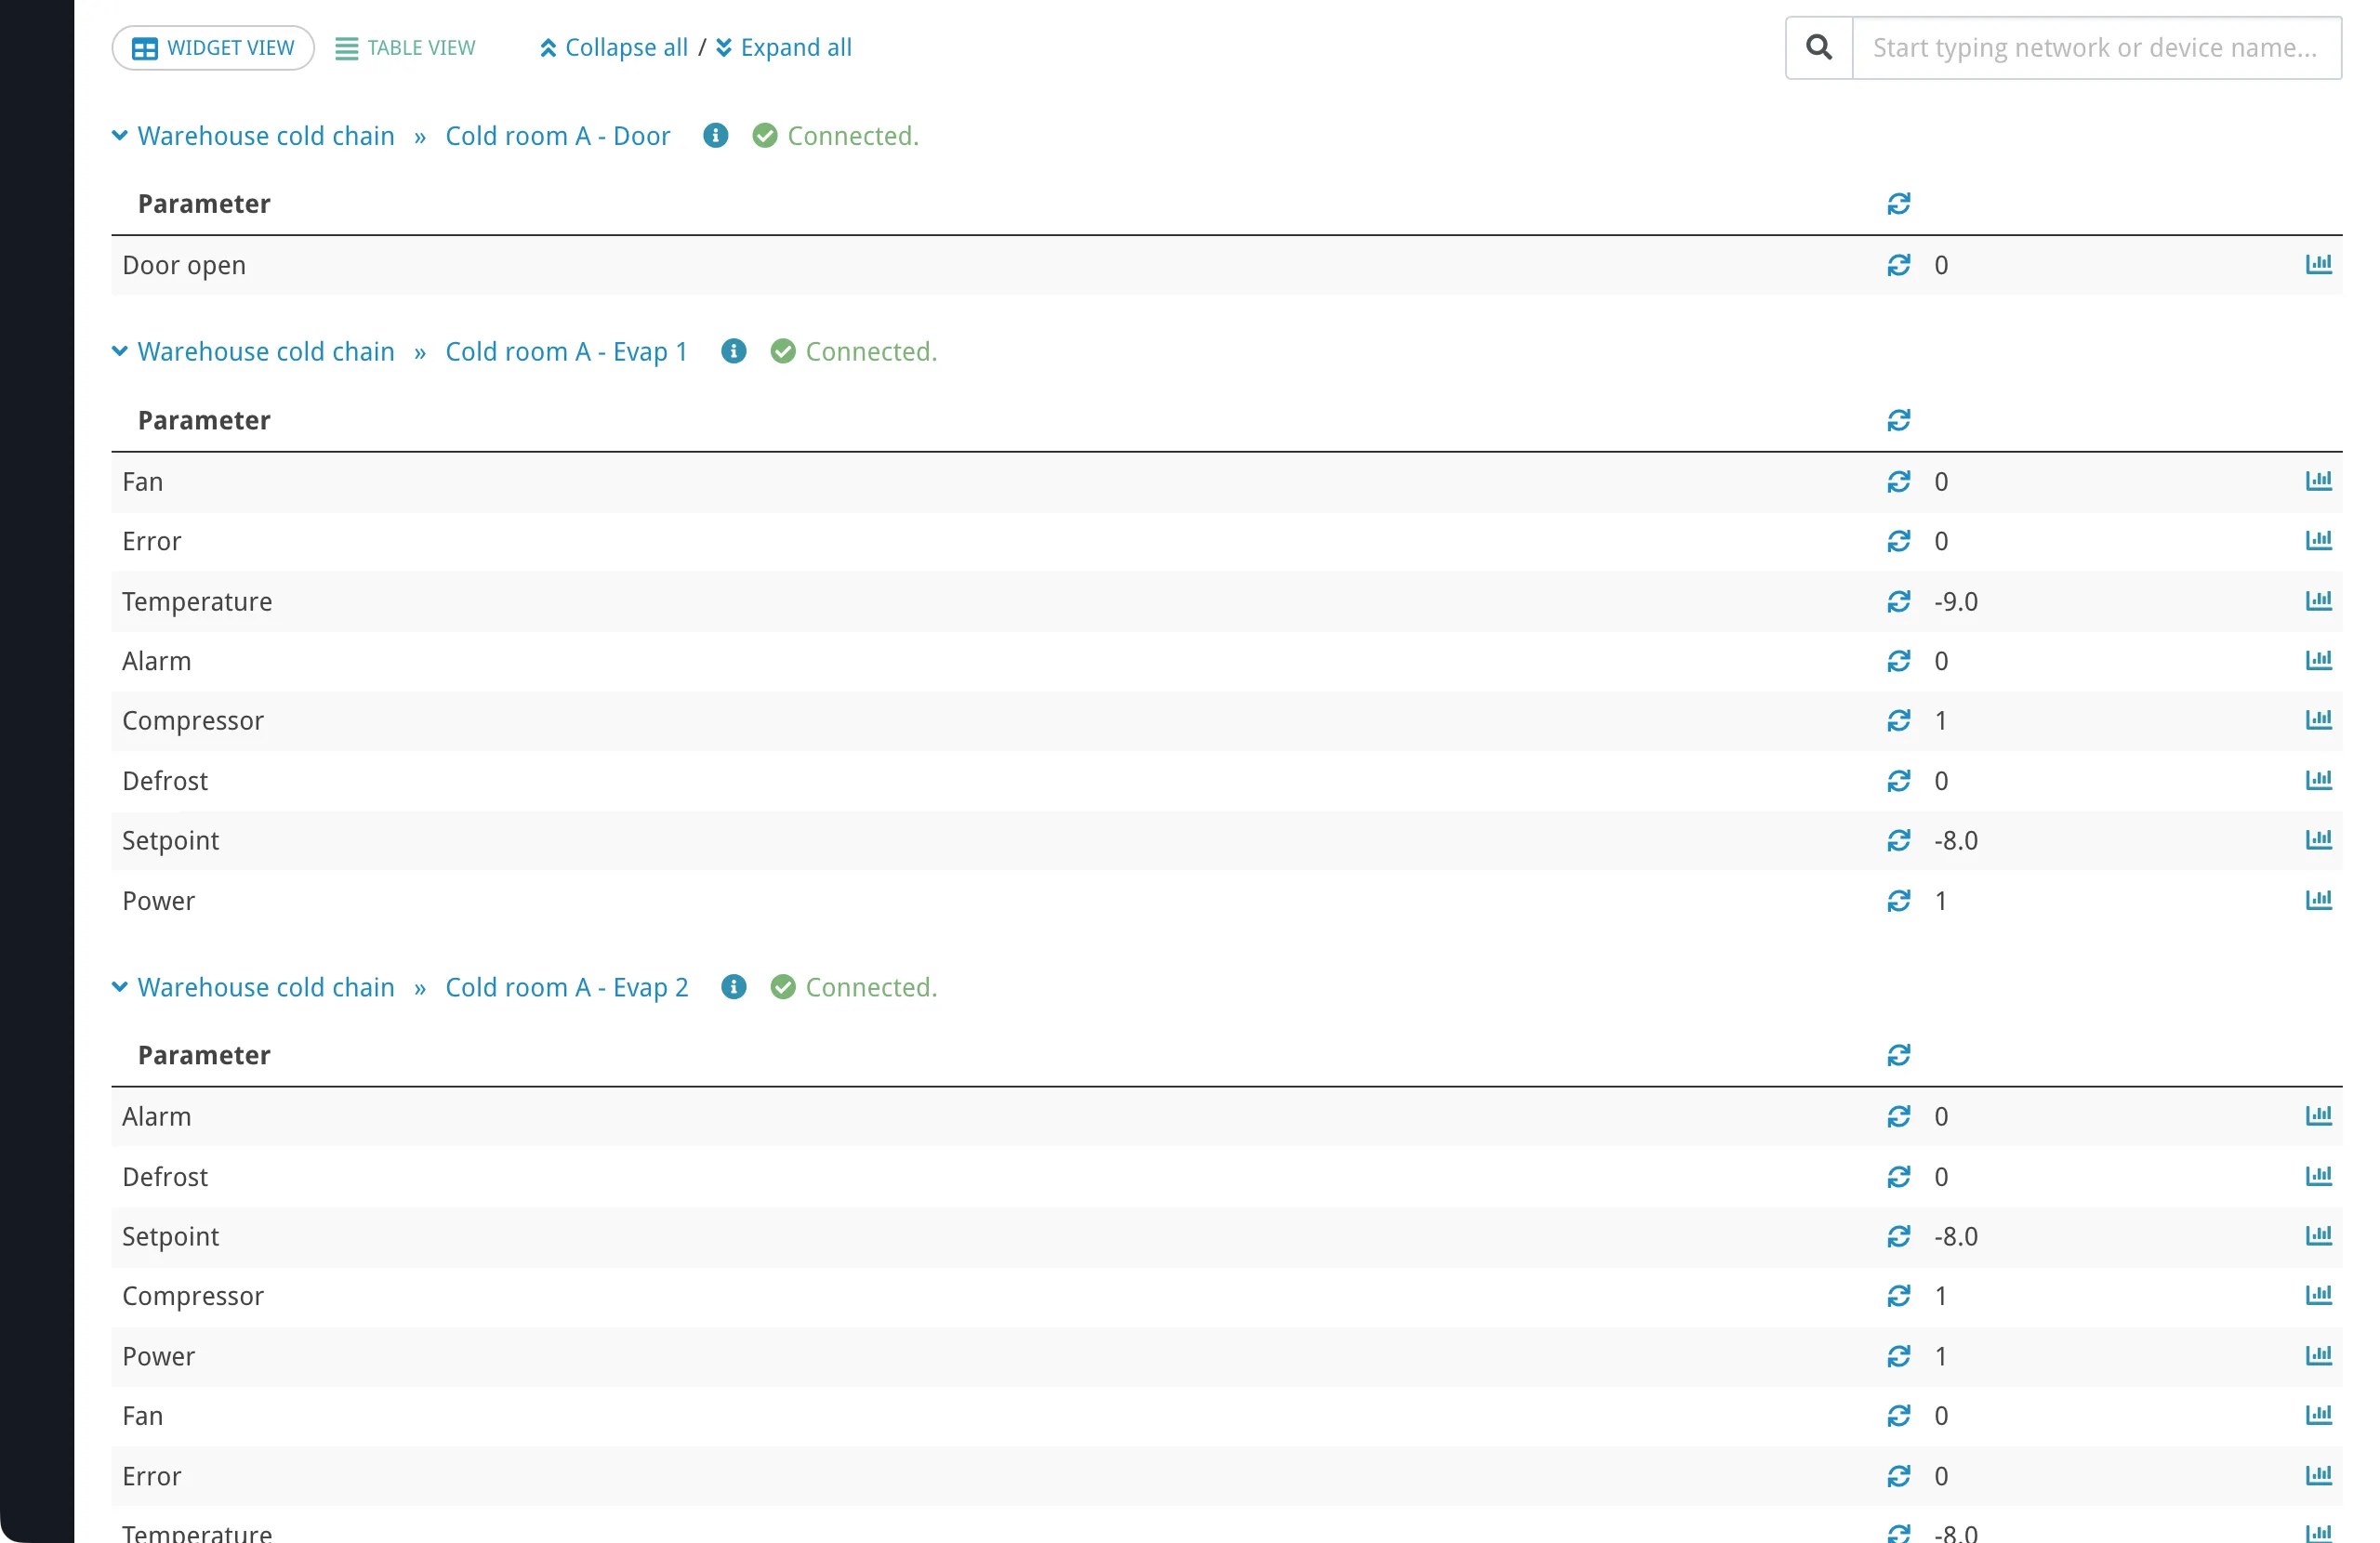
Table view does not provide write or remove controls. Use it for monitoring screens where you need to see many parameters at a glance.
Adding Parameters to the Dashboard
Section titled “Adding Parameters to the Dashboard”There are two ways to add parameters to the dashboard.
From the Manage Dashboard
Section titled “From the Manage Dashboard”Each device panel in widget view has an Add parameter display button (visible in manage mode only). Clicking it opens a modal that lists the device’s tracked parameters, grouped by category. Parameters already on the dashboard are excluded from the list.
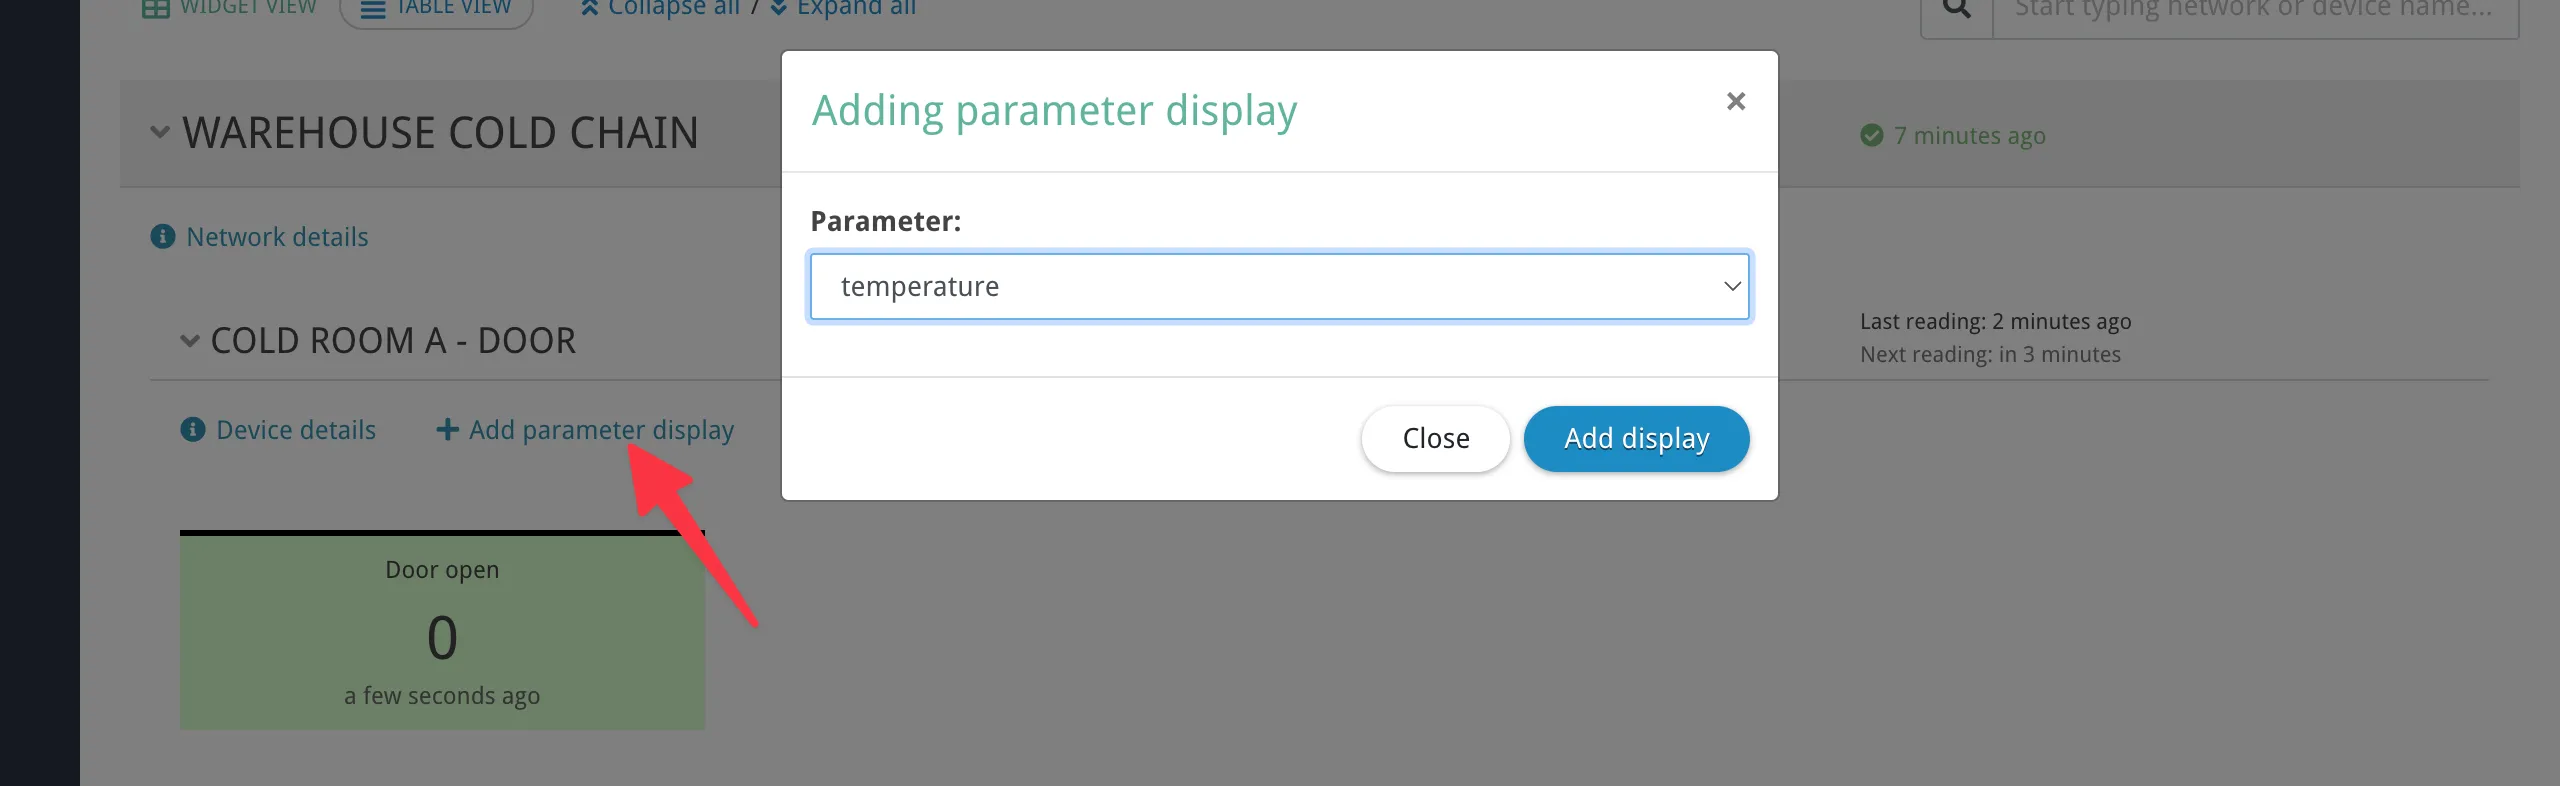
This method only offers parameters that are already marked as tracked. If the parameter you want is not listed, add it from the device page instead (see below).
From the Device Page
Section titled “From the Device Page”On the device details page, select one or more parameters using the checkboxes and click Add to dashboard.
This method is more flexible:
- It can add several parameters at once.
- If a selected parameter is not yet tracked, Overvis automatically marks it as tracked before adding it (since dashboard display requires periodic readings).
Removing Parameters
Section titled “Removing Parameters”On the manage dashboard in widget view, each parameter widget has a remove button (trash icon) to unpin it from the dashboard. Removing a parameter widget does not delete the parameter itself or its historical data — it only removes it from the dashboard view.
If a parameter is deleted from the device configuration, its dashboard widget disappears automatically.
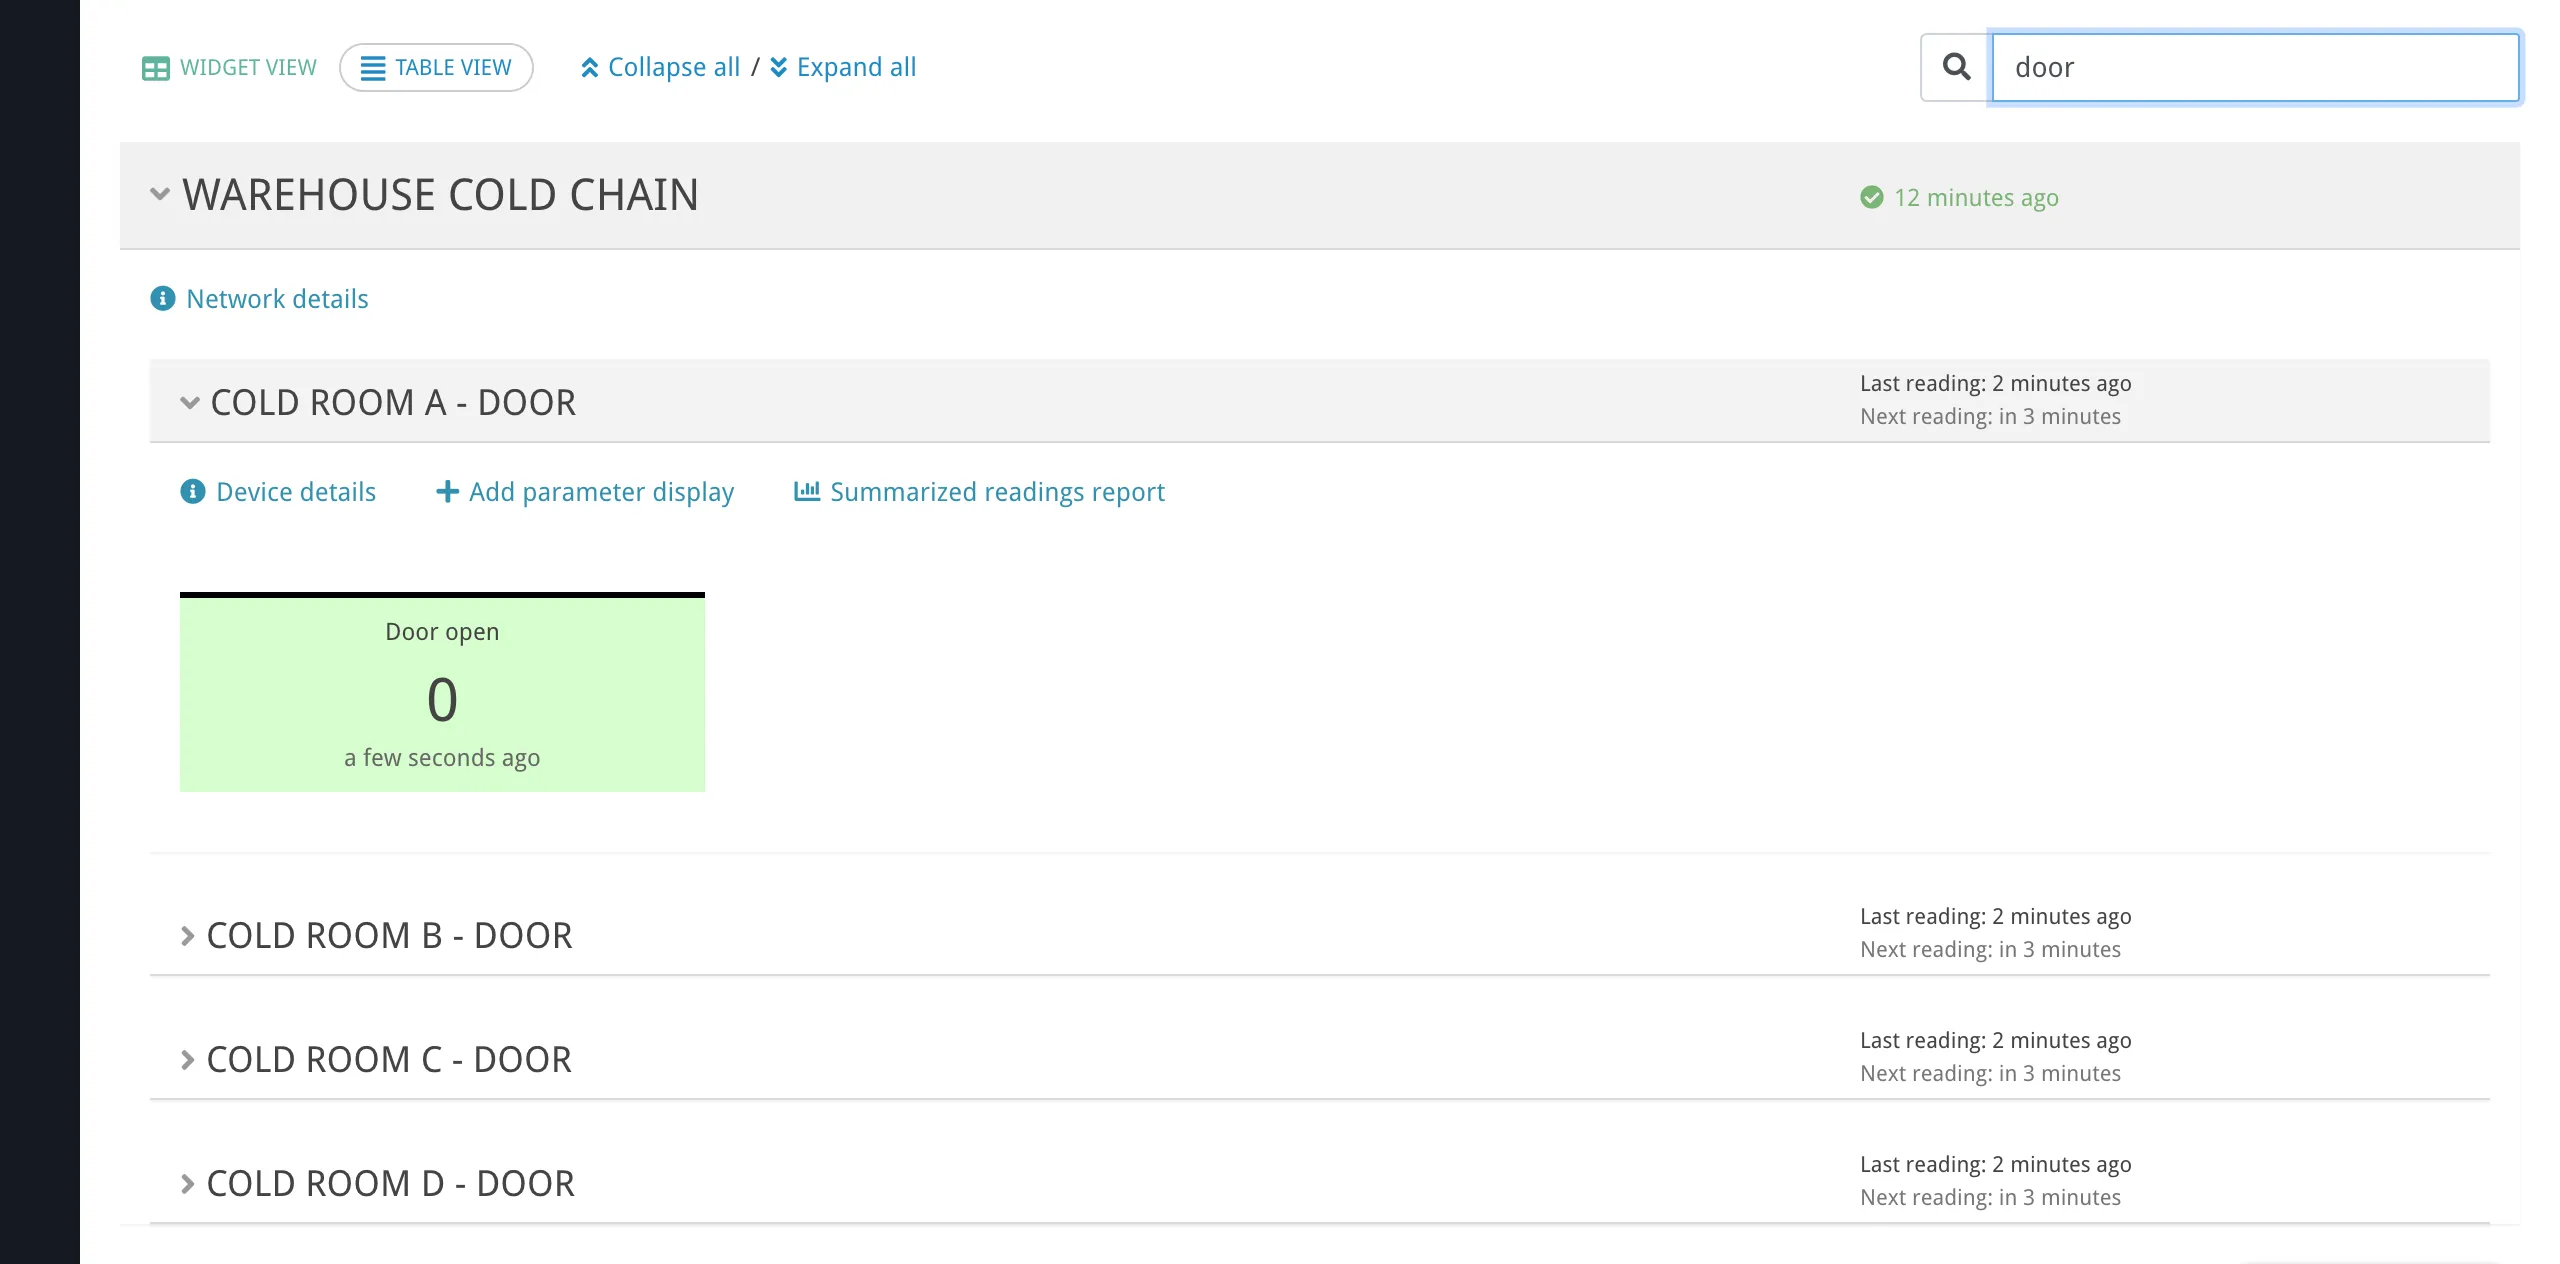
Search
Section titled “Search”The search field at the top of the dashboard filters by network name and device name. It does not search parameter names.
When you type multiple words, Overvis matches devices whose combined network and device name contains all the words (in any order). For example, typing “warehouse temperature” matches a device named “Temperature Controller” in a network named “Warehouse”.
Auto-Refresh
Section titled “Auto-Refresh”The dashboard keeps data current through automatic updates:
- Full structure (network list, device list, parameter widgets) is loaded once when the page opens.
- Values and status (parameter readings, connection status, device read times, alert state) are refreshed every 10 seconds for expanded networks and devices. Collapsed panels are not polled — their values update once they are expanded.
- Realtime readings for individually expanded parameter widgets are polled every 1 second while they remain expanded.
Alerts on the Dashboard
Section titled “Alerts on the Dashboard”The dashboard reflects active alert state at every level of the hierarchy:
| Level | Indicator |
|---|---|
| Network | Alarm bell icon in the network header when any alert under that network is active. |
| Device | Alert and event badges showing which alerts are active for that device. |
| Parameter | The parameter widget changes to a warning or critical style when an active alert references that parameter. |
For details on configuring alerts, see Alerts.
Disabled Networks and Devices
Section titled “Disabled Networks and Devices”Disabled networks and devices remain visible on the dashboard, but their behavior changes:
- Disabled devices show a “Device is disabled” status instead of the next reading time.
- Parameter values show ”–” and are not updated (no reads or writes are performed).
- The write dialog is not available for parameters on disabled devices.
- Realtime readings show “Device is disabled” instead of live values.
Disabling does not remove parameter widgets from the dashboard. When the network or device is re-enabled, normal polling and display updates resume. For more on disabling, see Networks, Devices & Parameters — Disabling.
State Persistence
Section titled “State Persistence”The dashboard remembers the following in the browser (per browser, not per user account):
- The selected view (widget or table).
- Which network and device panels are expanded or collapsed.
Search queries and expanded parameter widgets are not persisted — they reset when the page is reloaded.
Troubleshooting
Section titled “Troubleshooting”Parameter not appearing on the dashboard after adding it
Section titled “Parameter not appearing on the dashboard after adding it”If a parameter does not show up after you add it, reload the page — the dashboard loads its full structure once on page load and may not reflect changes made in another tab. If the parameter still does not appear, check that it belongs to a device in the current organization and that the parameter has not been deleted.
Values showing ”–” or not updating
Section titled “Values showing ”–” or not updating”A dash (”–”) instead of a value means Overvis has no recent reading for that parameter. Common reasons:
- Device is disabled — enable the device to resume readings.
- Network is unreachable — the gateway/controller is offline. Check the network connection status in the network panel header.
- Device is unreachable — the gateway is online but the specific device is not responding. Check the Modbus address and wiring. See Connecting Equipment — Troubleshooting.
- Parameter has never been read — if the device shows “Never read.”, wait for the next scheduled reading cycle or trigger a manual read from the device page.
If values update on the device page but not on the dashboard, expand the network and device panels — collapsed panels are not polled for new values.
Cannot write a value to a parameter
Section titled “Cannot write a value to a parameter”The write dialog only appears under all of these conditions:
- You are on the manage dashboard (
/manage/), not the monitoring dashboard (/view/). - You are using widget view, not table view.
- The parameter is programmable (shown with a dashed underline and pen icon).
- The device is not disabled.
If the value still cannot be written, the device may be unreachable. Check the device status in the panel header.
Search not finding a device
Section titled “Search not finding a device”The search field only matches network names and device names — it does not search parameter names. If you are searching for a parameter by name, you need to find it by its device or network name instead.
Multiple words are matched independently: all words must appear somewhere in the combined network name and device name (in any order).
Realtime readings not appearing
Section titled “Realtime readings not appearing”Realtime readings require expanding (clicking) an individual parameter widget. If you expand the widget and still see no realtime values:
- The device may be disabled or unreachable — check the device status.
- The network may be disconnected — check the connection status icon in the network header.
In table view, use the sync toggle icon to start realtime readings for individual parameters or all parameters on a device.
Common Questions
Section titled “Common Questions”Can I create multiple dashboards or custom layouts?
Section titled “Can I create multiple dashboards or custom layouts?”No. Each organization has one dashboard with one shared set of parameter widgets. All users in the organization see the same parameters. The dashboard layout (grouping by network and device) is automatic and cannot be rearranged.
Why do my expanded panels reset when I reload the page?
Section titled “Why do my expanded panels reset when I reload the page?”The expand/collapse state of network and device panels is saved in your browser’s local storage — it persists across reloads. However, expanded parameter widgets (focused for realtime readings) and search queries reset on reload by design.
If you notice panel state is lost, you may have cleared your browser data, or you are using a different browser/device.
How do I see historical data for a parameter?
Section titled “How do I see historical data for a parameter?”Expand a parameter widget in widget view to see a 24-hour sparkline (mini chart). Click the Full history link below the chart to open a detailed readings report. In table view, use the chart icon in the last column to go directly to the readings report.
What is the difference between widget view and table view?
Section titled “What is the difference between widget view and table view?”Widget view shows parameters as interactive cards with sparkline mini charts, realtime readings, write controls, and the ability to add/remove parameters. It is best for active monitoring and control.
Table view shows parameters in a compact table with sync toggles for realtime values. It does not have write or add/remove controls. It is best for monitoring screens and situations where you need to see many parameters at once.
Why does the dashboard show outdated values for some devices?
Section titled “Why does the dashboard show outdated values for some devices?”The dashboard only refreshes values for expanded network and device panels. If a network or device panel is collapsed, its parameter values are not polled until you expand it. Expand the panel to see the latest values.
How do I add a parameter that is not listed in the “Add parameter display” modal?
Section titled “How do I add a parameter that is not listed in the “Add parameter display” modal?”The dashboard’s “Add parameter display” modal only shows parameters that are already tracked (have automatic periodic readings enabled). If the parameter you want is not listed:
- Go to the device page.
- Select the parameter using its checkbox.
- Click Add to dashboard.
Overvis will automatically enable tracking for the parameter and add it to the dashboard.