Resource Consumption Report
The Resource Consumption Report is a tool for analyzing accumulated counter and meter data, showing resource usage growth over selected time periods segmented into half-hour, hourly, or daily intervals.
This report helps you analyze readings from parameters that represent continuous resource usage like energy meters (kWh), water meters (m³), gas meters, and any accumulating counter values. If a parameter value continuously grows over time, this report can analyze its growth patterns.
How it works
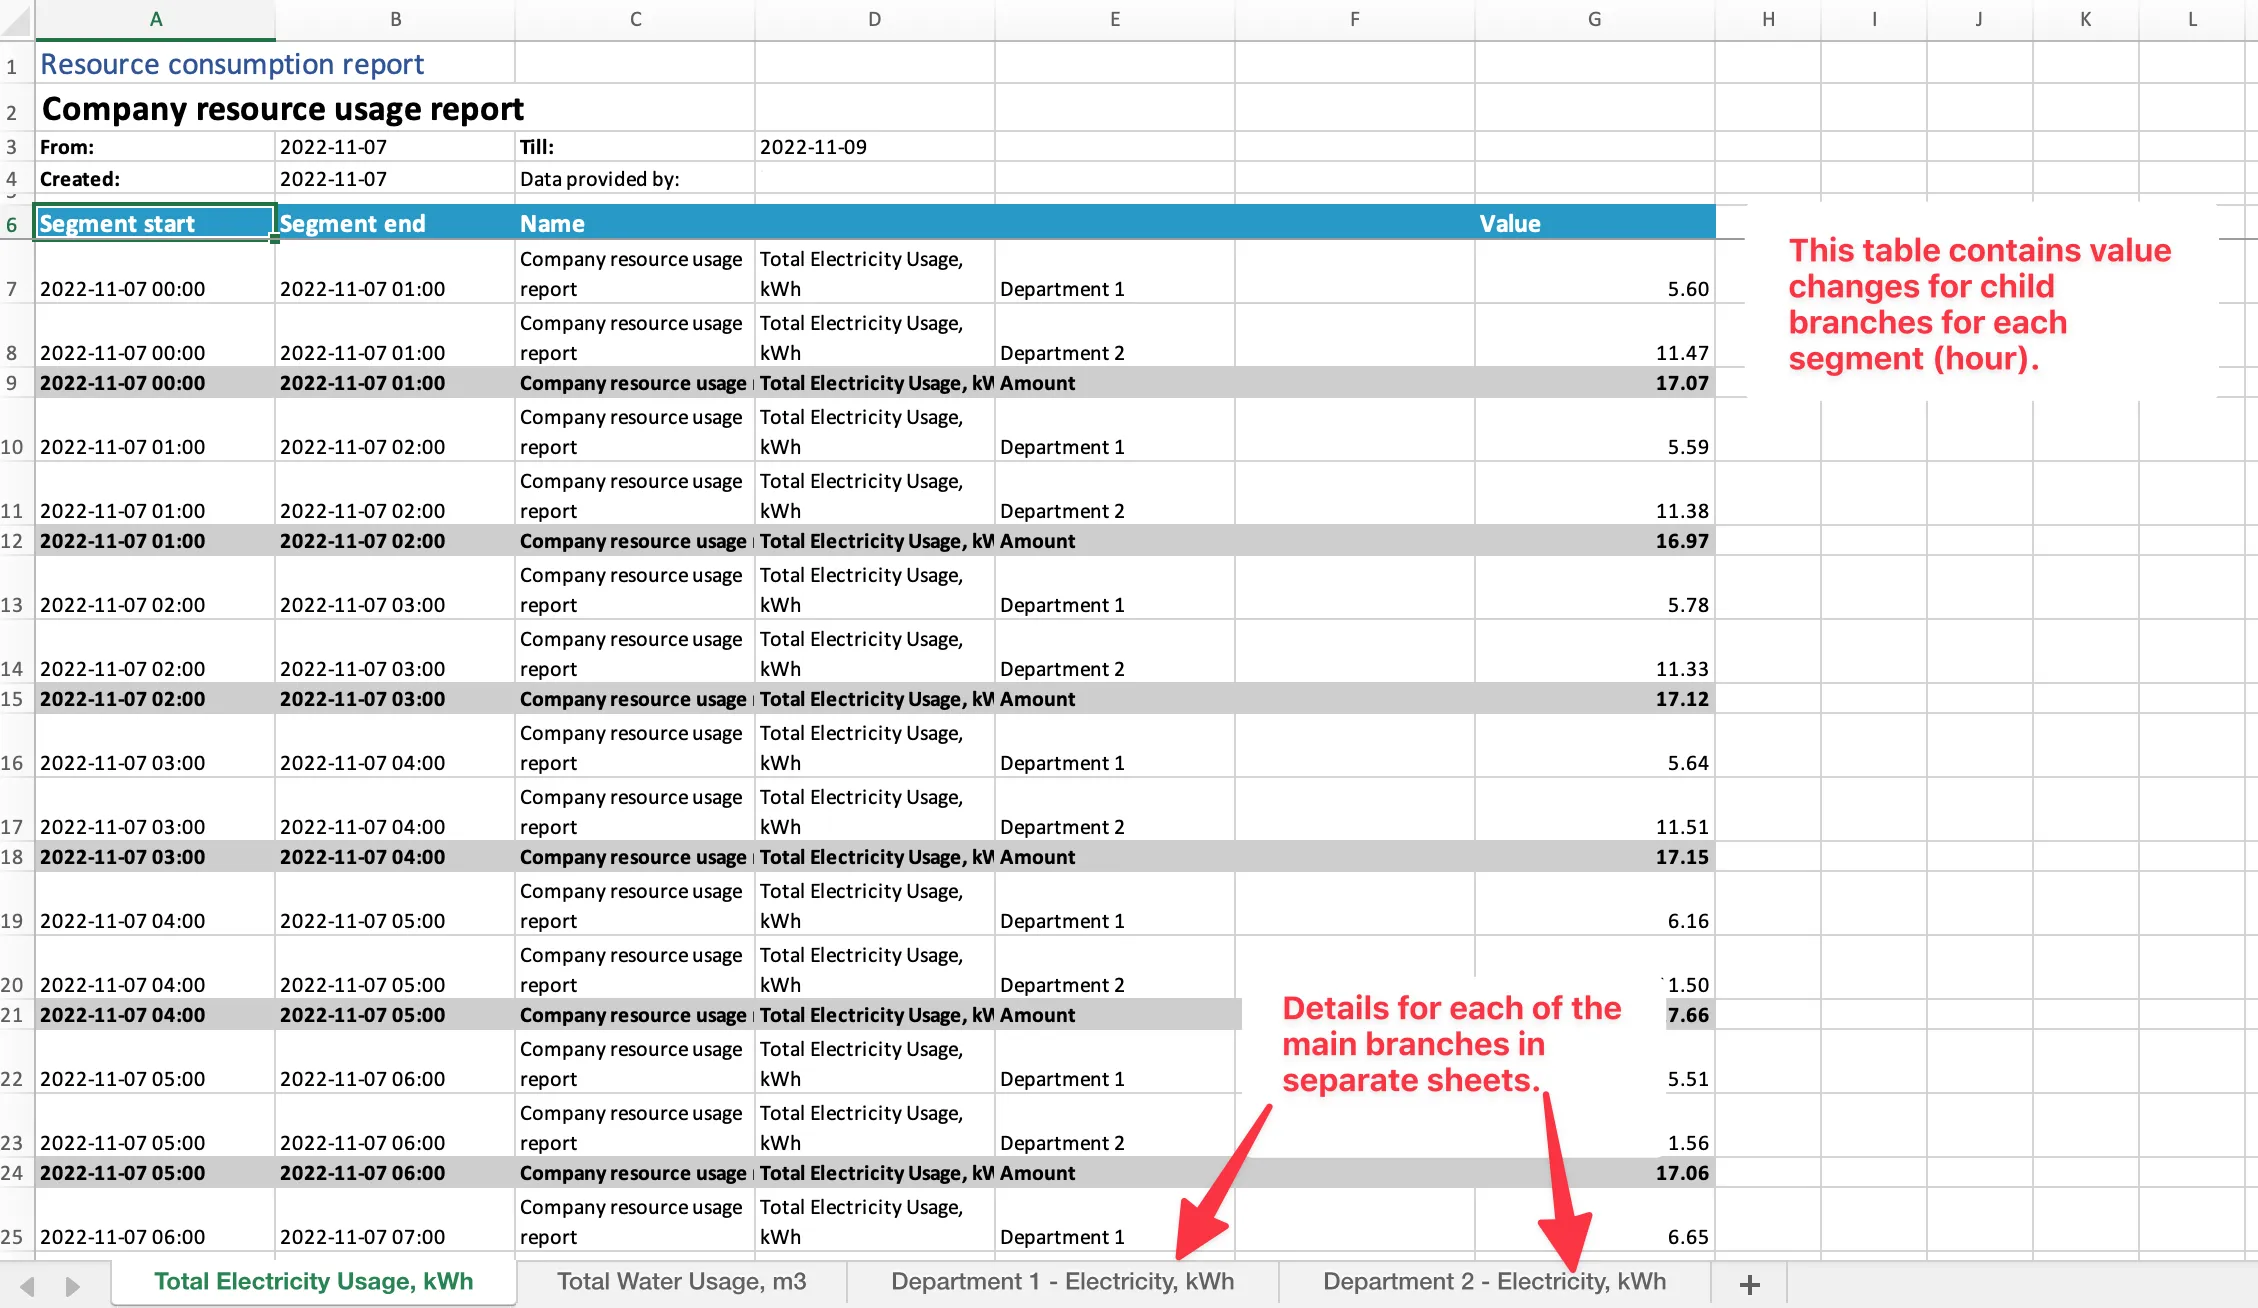
Section titled “How it works”The report divides the selected time range into segments (half-hour, hour, or day). For each segment, it finds the highest recorded reading within that segment and subtracts the latest reading recorded before the segment started. This difference — the delta — represents how much the counter grew during that interval. If the parameter has a multiplier or shift configured, those are applied to the delta (delta × multiplier + shift).
Reports are organized as a tree. Main branches (top-level) each produce a separate chart. Branches can contain child nodes — other branches, individual parameter values, formulas, or links to branches from other reports. A branch’s value equals the sum of all its children, so you can group meters by department, building, or resource type and see both the total and the breakdown.
Example scenario
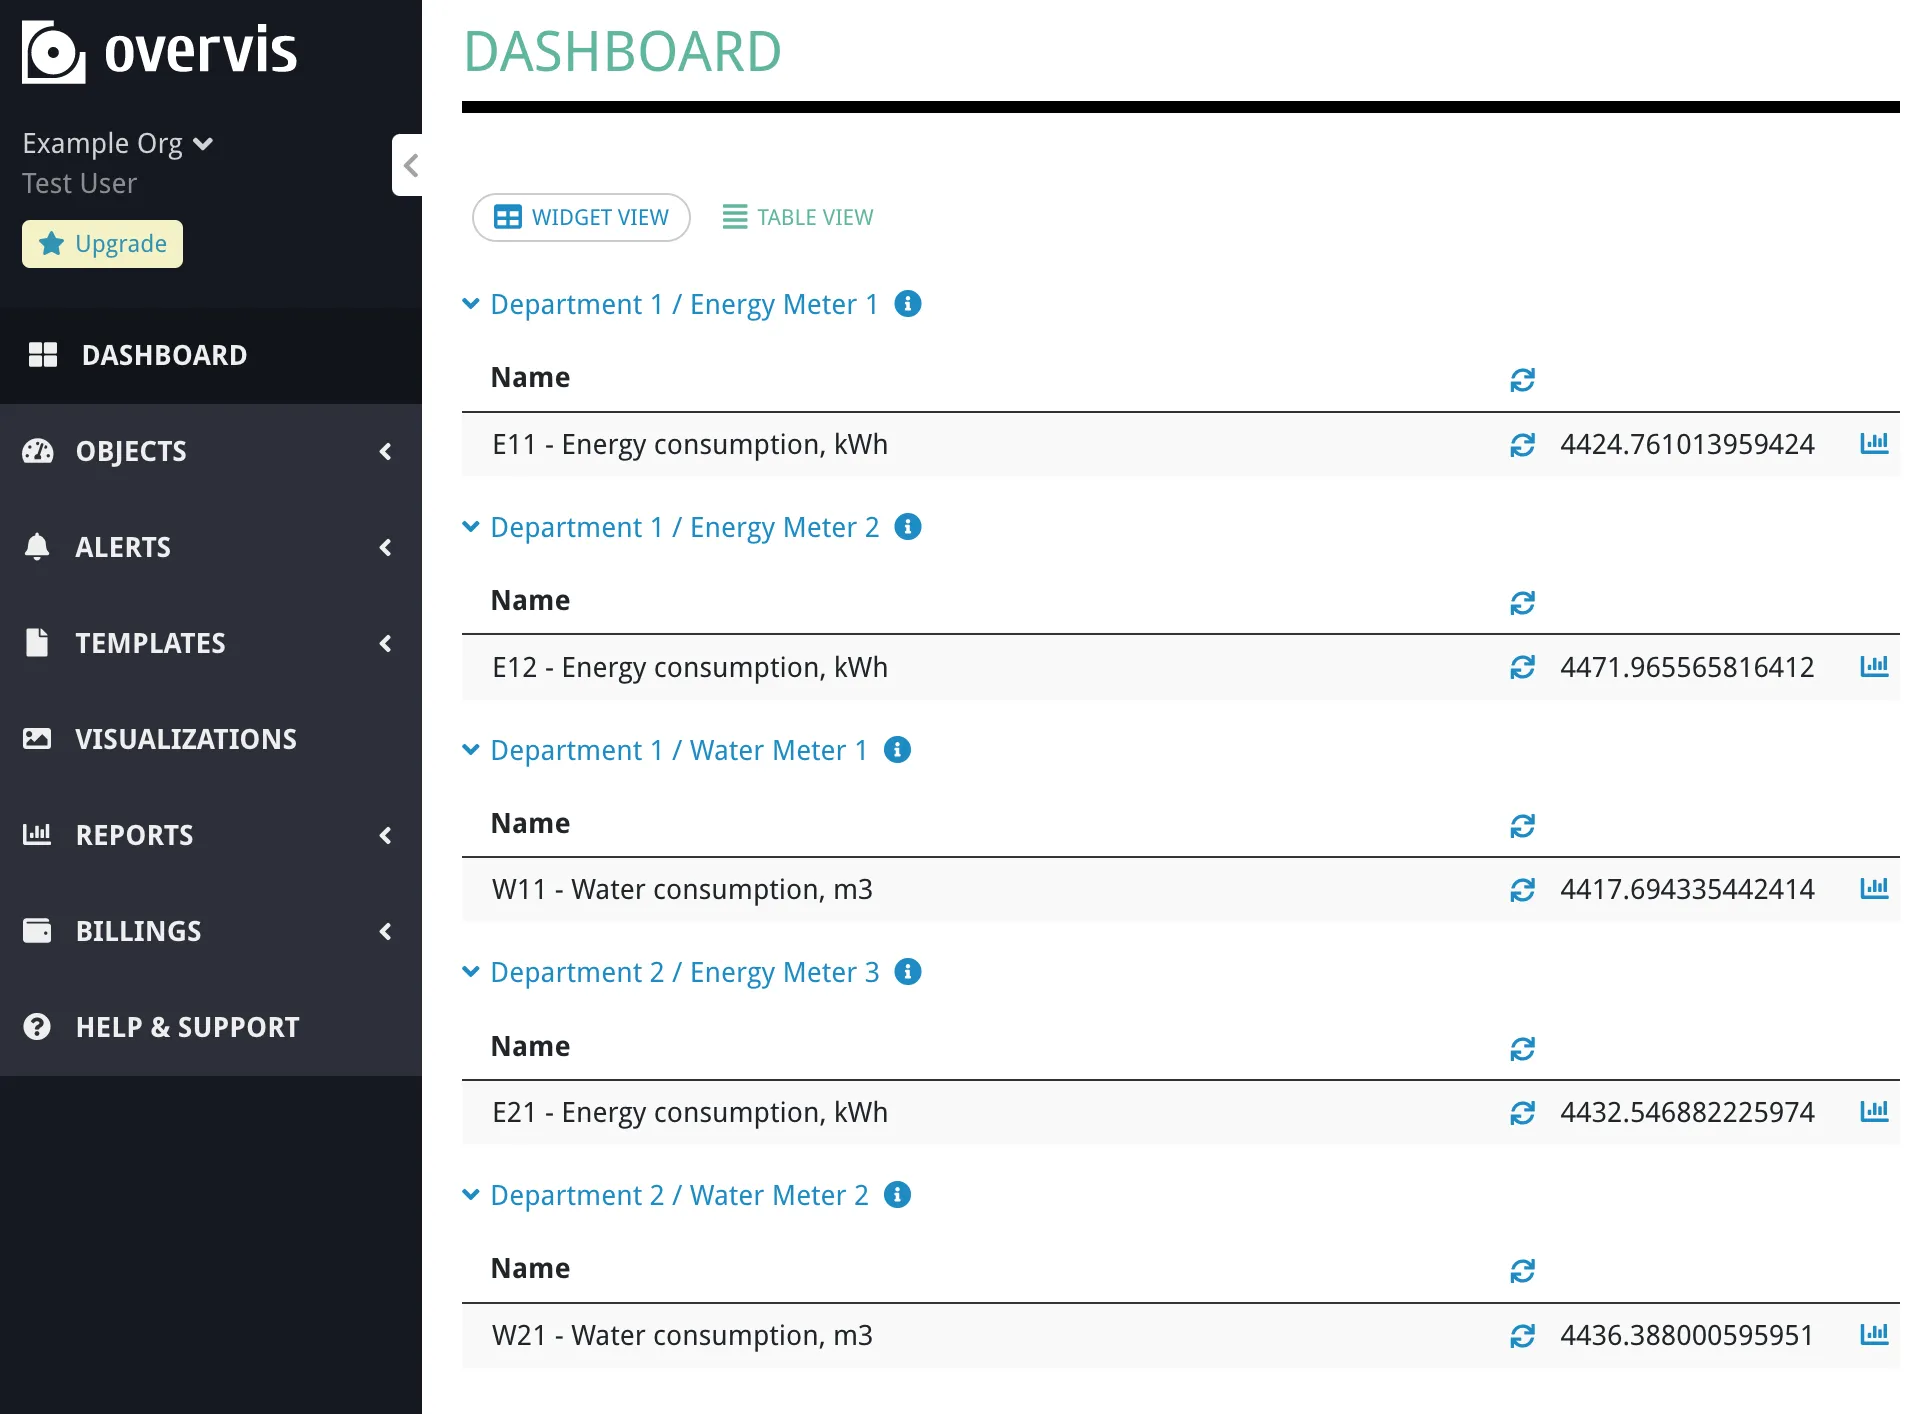
Section titled “Example scenario”Consider a facility with multiple departments, each with their own meters:
- Department 1
- Energy Meter 1 (E11) - kWh
- Energy Meter 2 (E12) - kWh
- Water Meter 1 (W11) - m³
- Department 2
- Energy Meter 3 (E21) - kWh
- Water Meter 2 (W21) - m³
You can structure a report to analyze this data:
Total Resources├── Total Energy│ ├── Department 1 Energy│ │ ├── E11│ │ └── E12│ └── Department 2 Energy│ └── E21└── Total Water ├── Department 1 Water │ └── W11 └── Department 2 Water └── W21With this structure, the report shows total energy and water consumption for the entire company, broken down by department, down to individual meters. You can compare departments side by side and identify which department or meter contributes most to overall usage.
Viewing a report
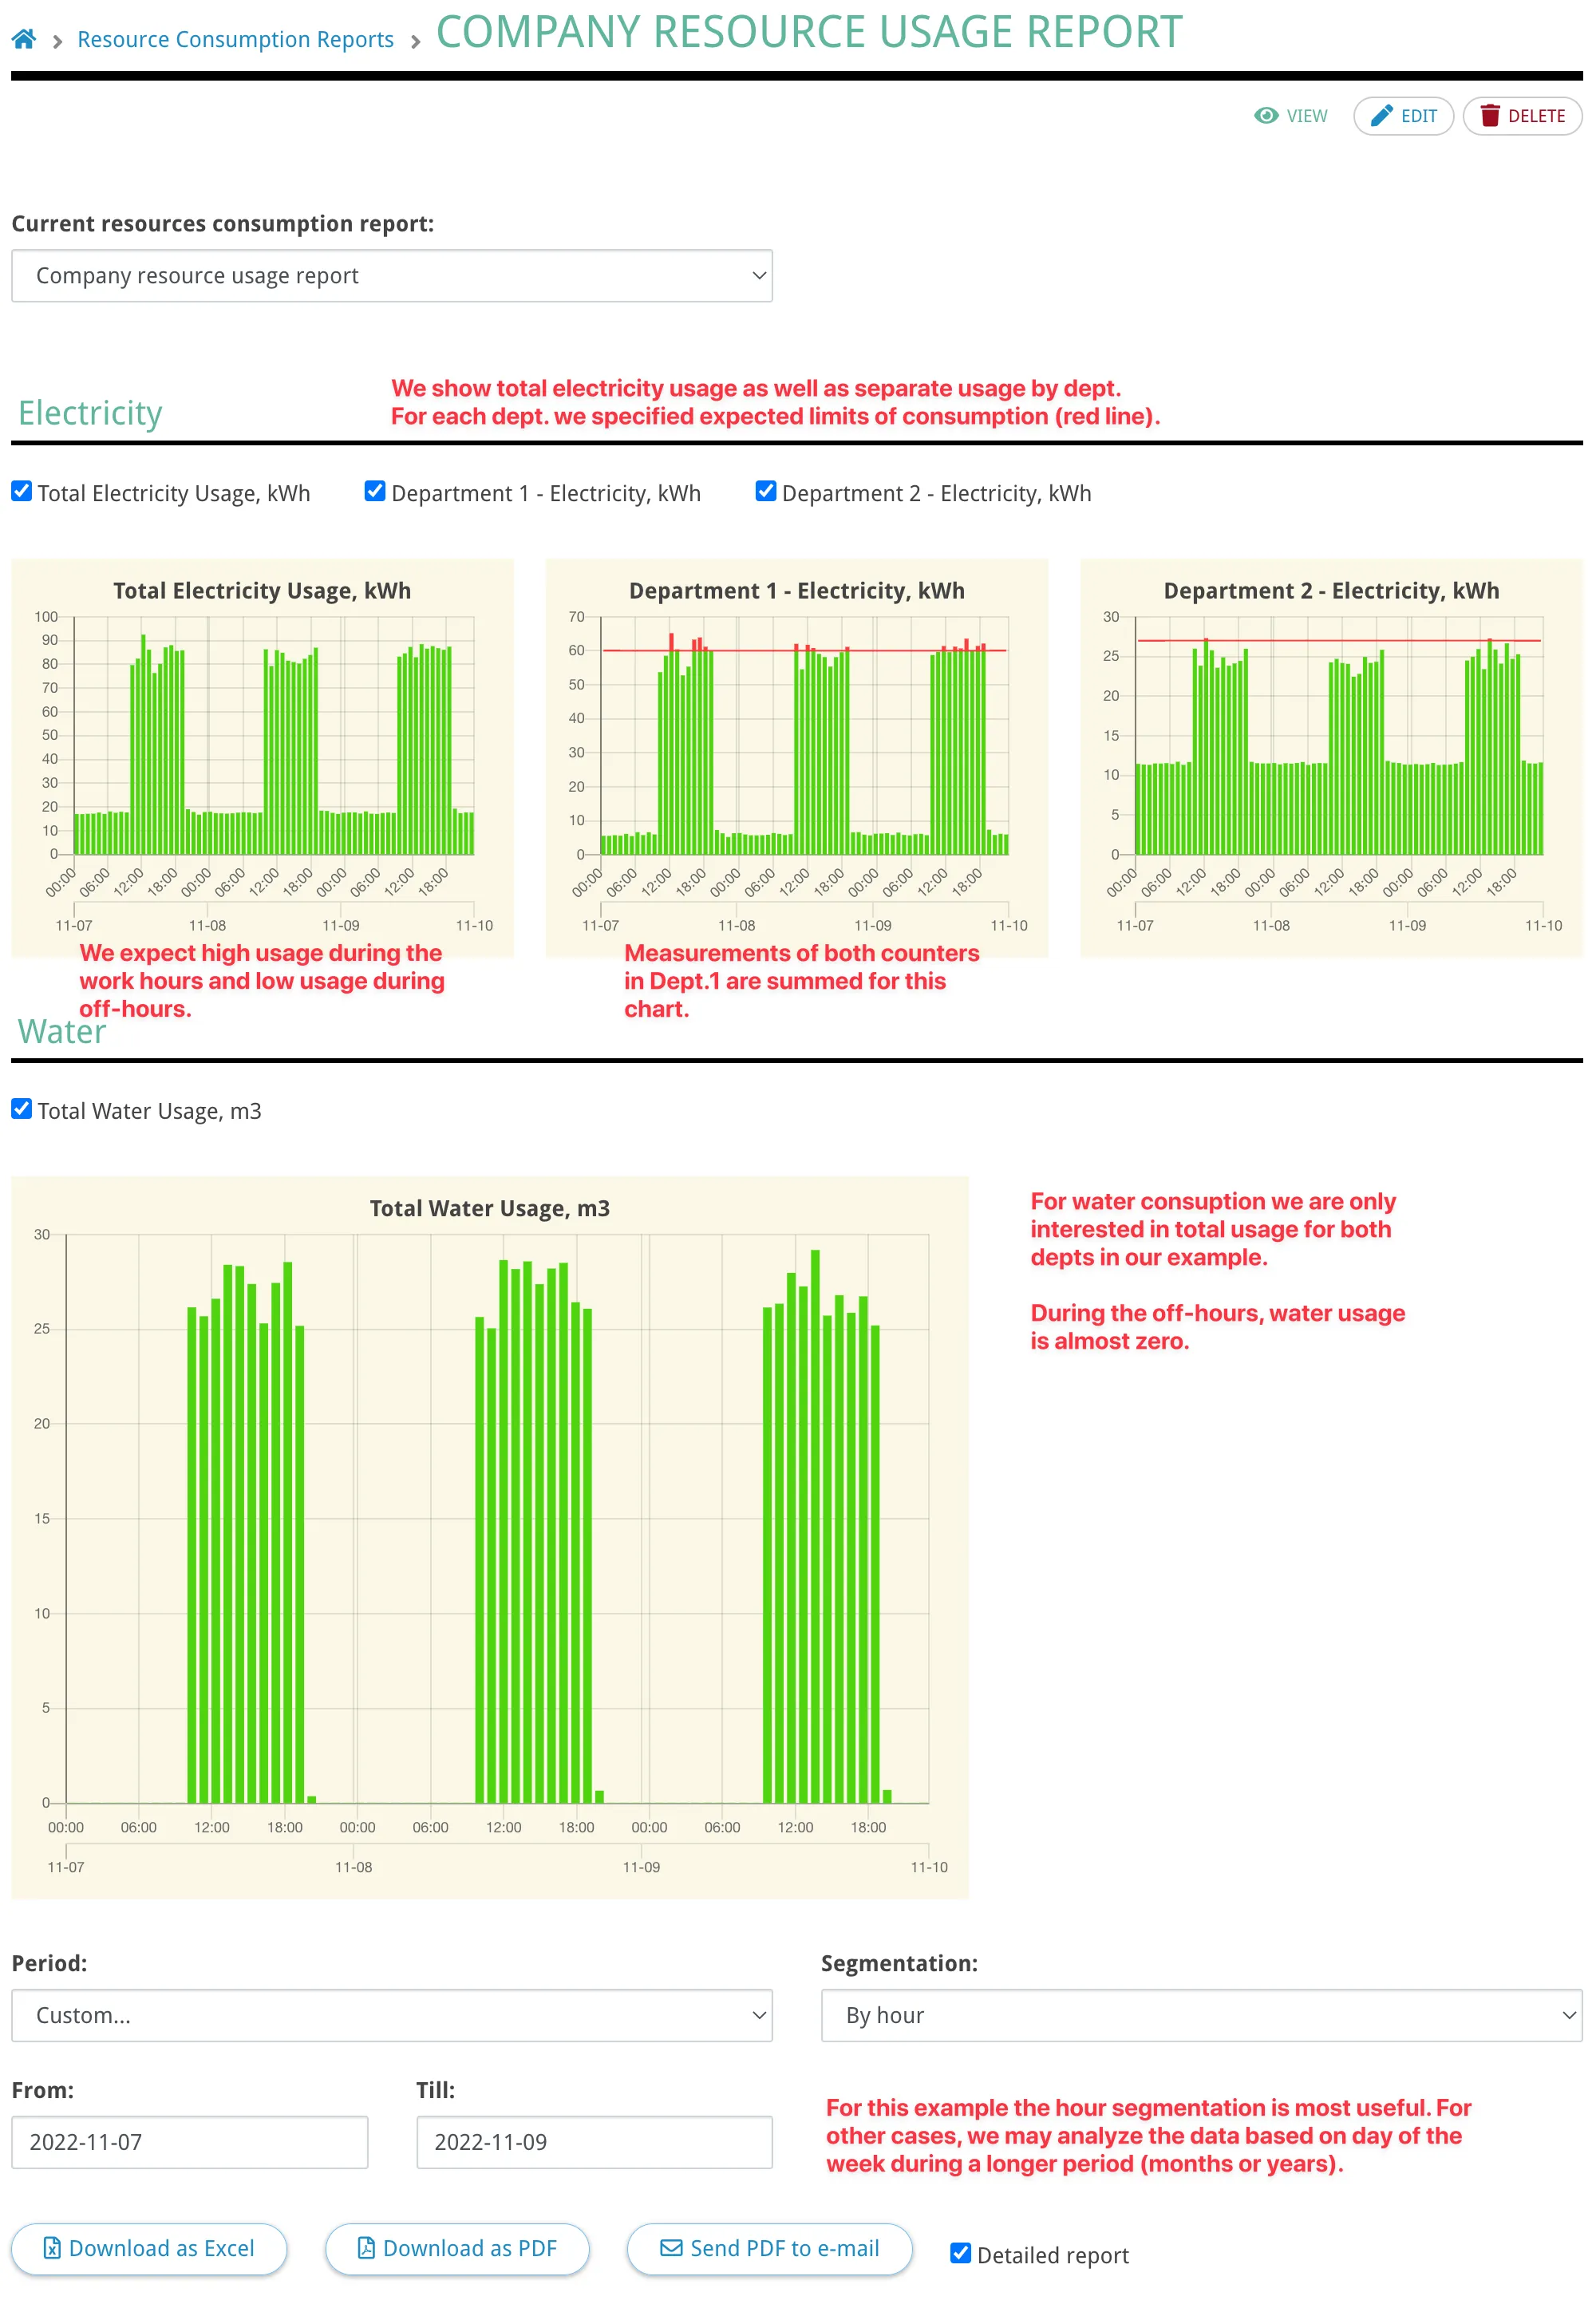
Section titled “Viewing a report”The report view page shows interactive bar charts — one per main branch. Each bar represents a time segment, and its height shows the consumption delta for that period. If level markers are configured, they appear as horizontal reference lines on the chart and the bars are color-coded when they exceed a threshold.
A legend above the charts lists all main branches as checkboxes. Uncheck a branch to hide its chart. A dropdown at the top lets you switch between reports in the same organization.
Exporting
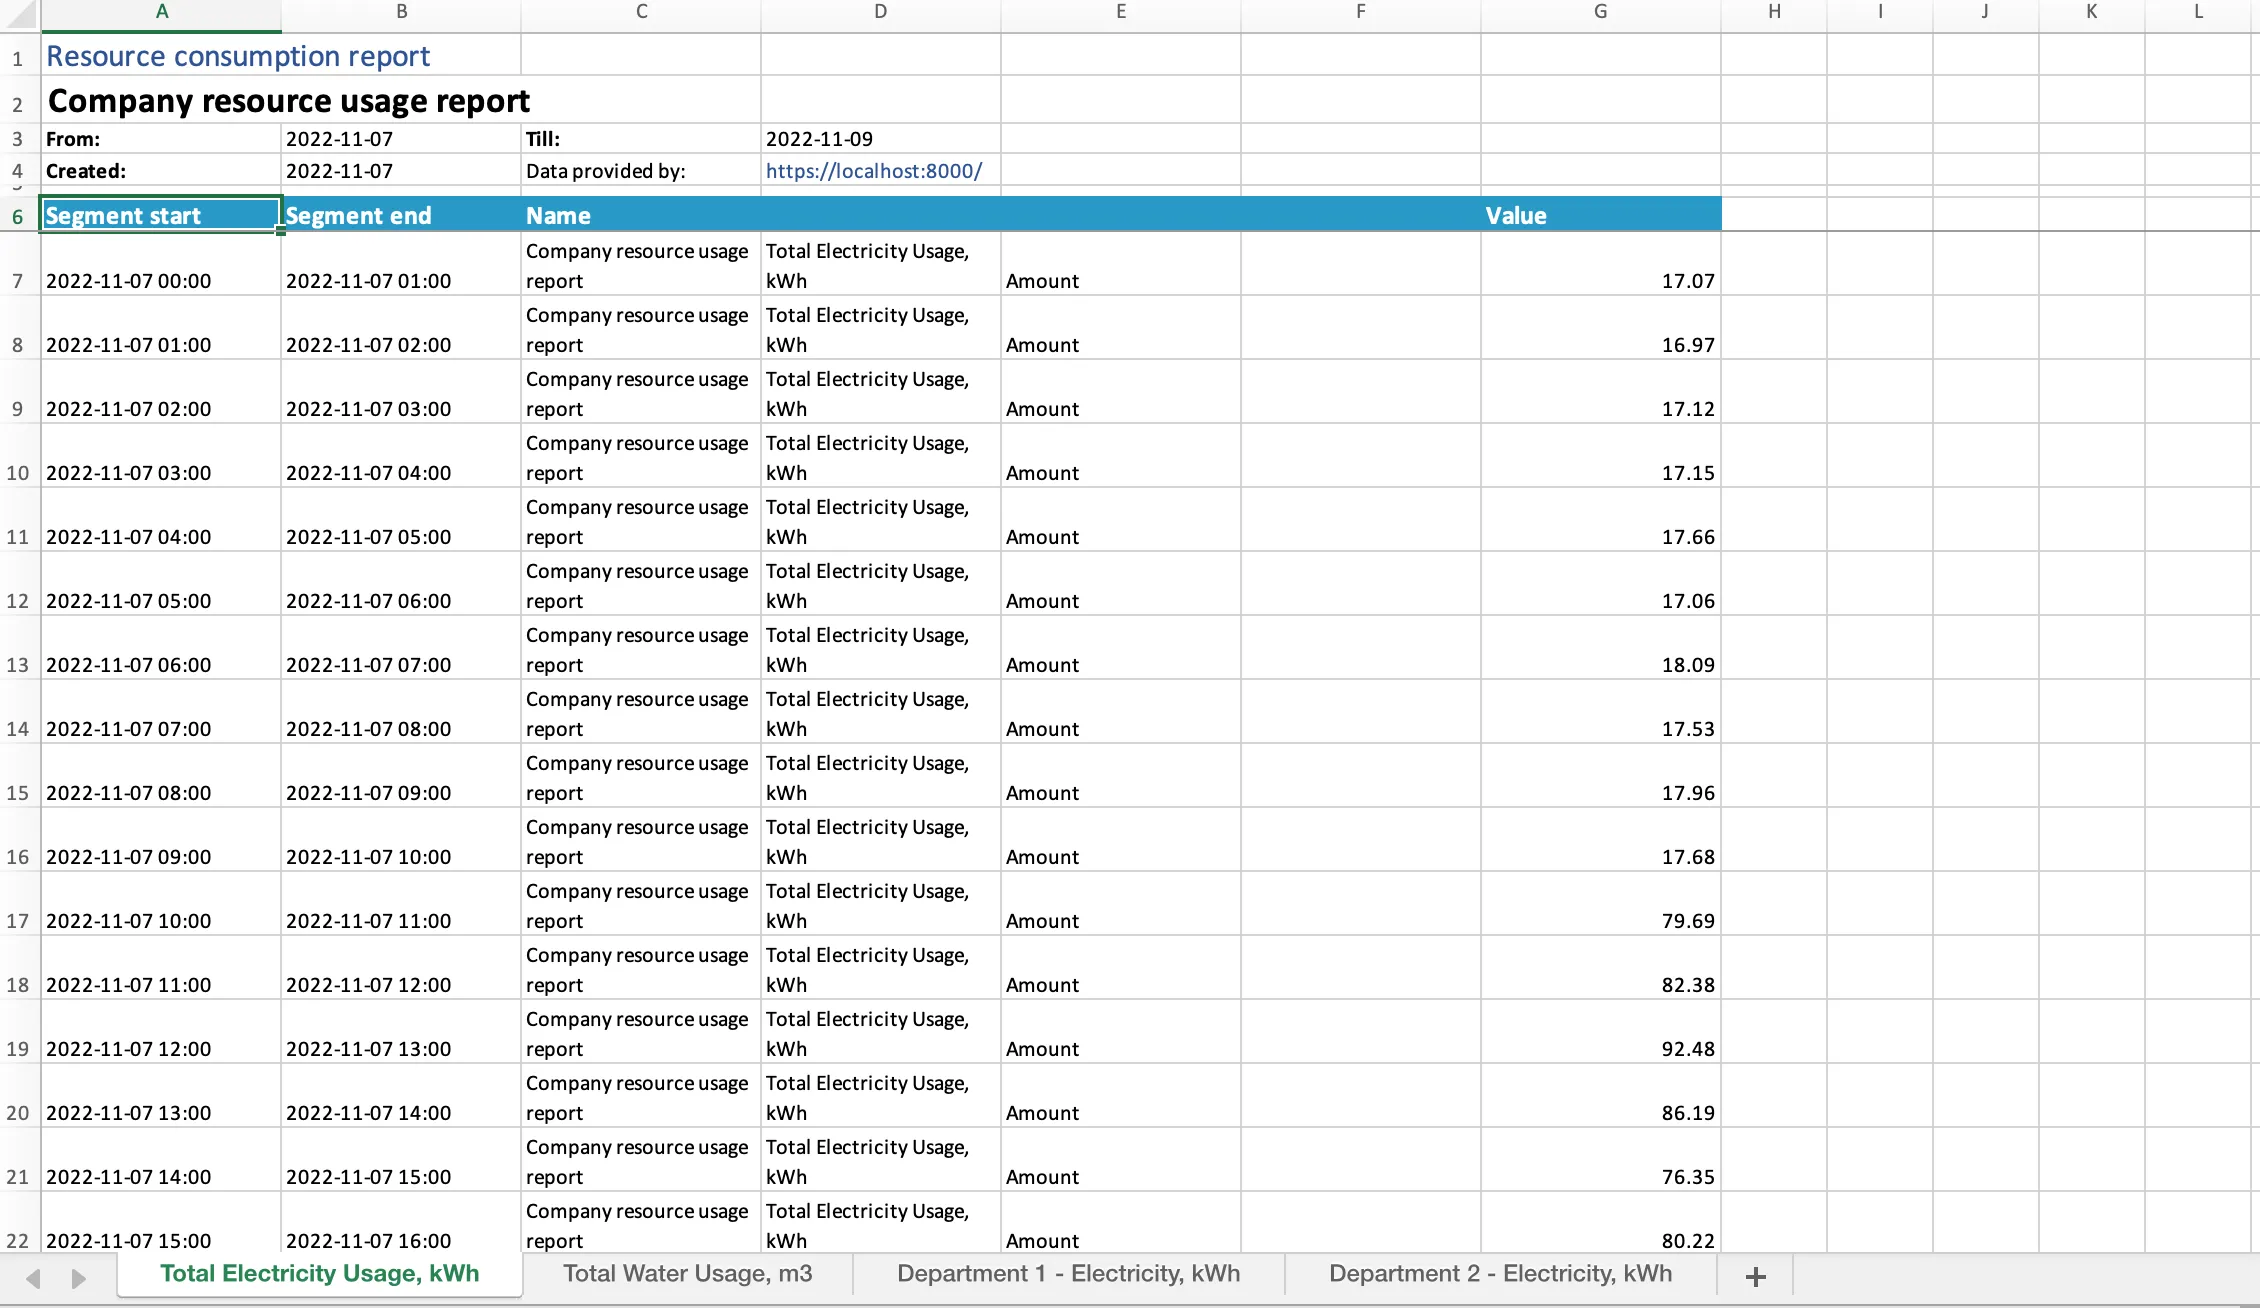
Section titled “Exporting”Below the charts, three export buttons are available: Download as Excel, Download as PDF, and Send PDF to e-mail. Only the branches currently visible (checked in the legend) are included in exports.
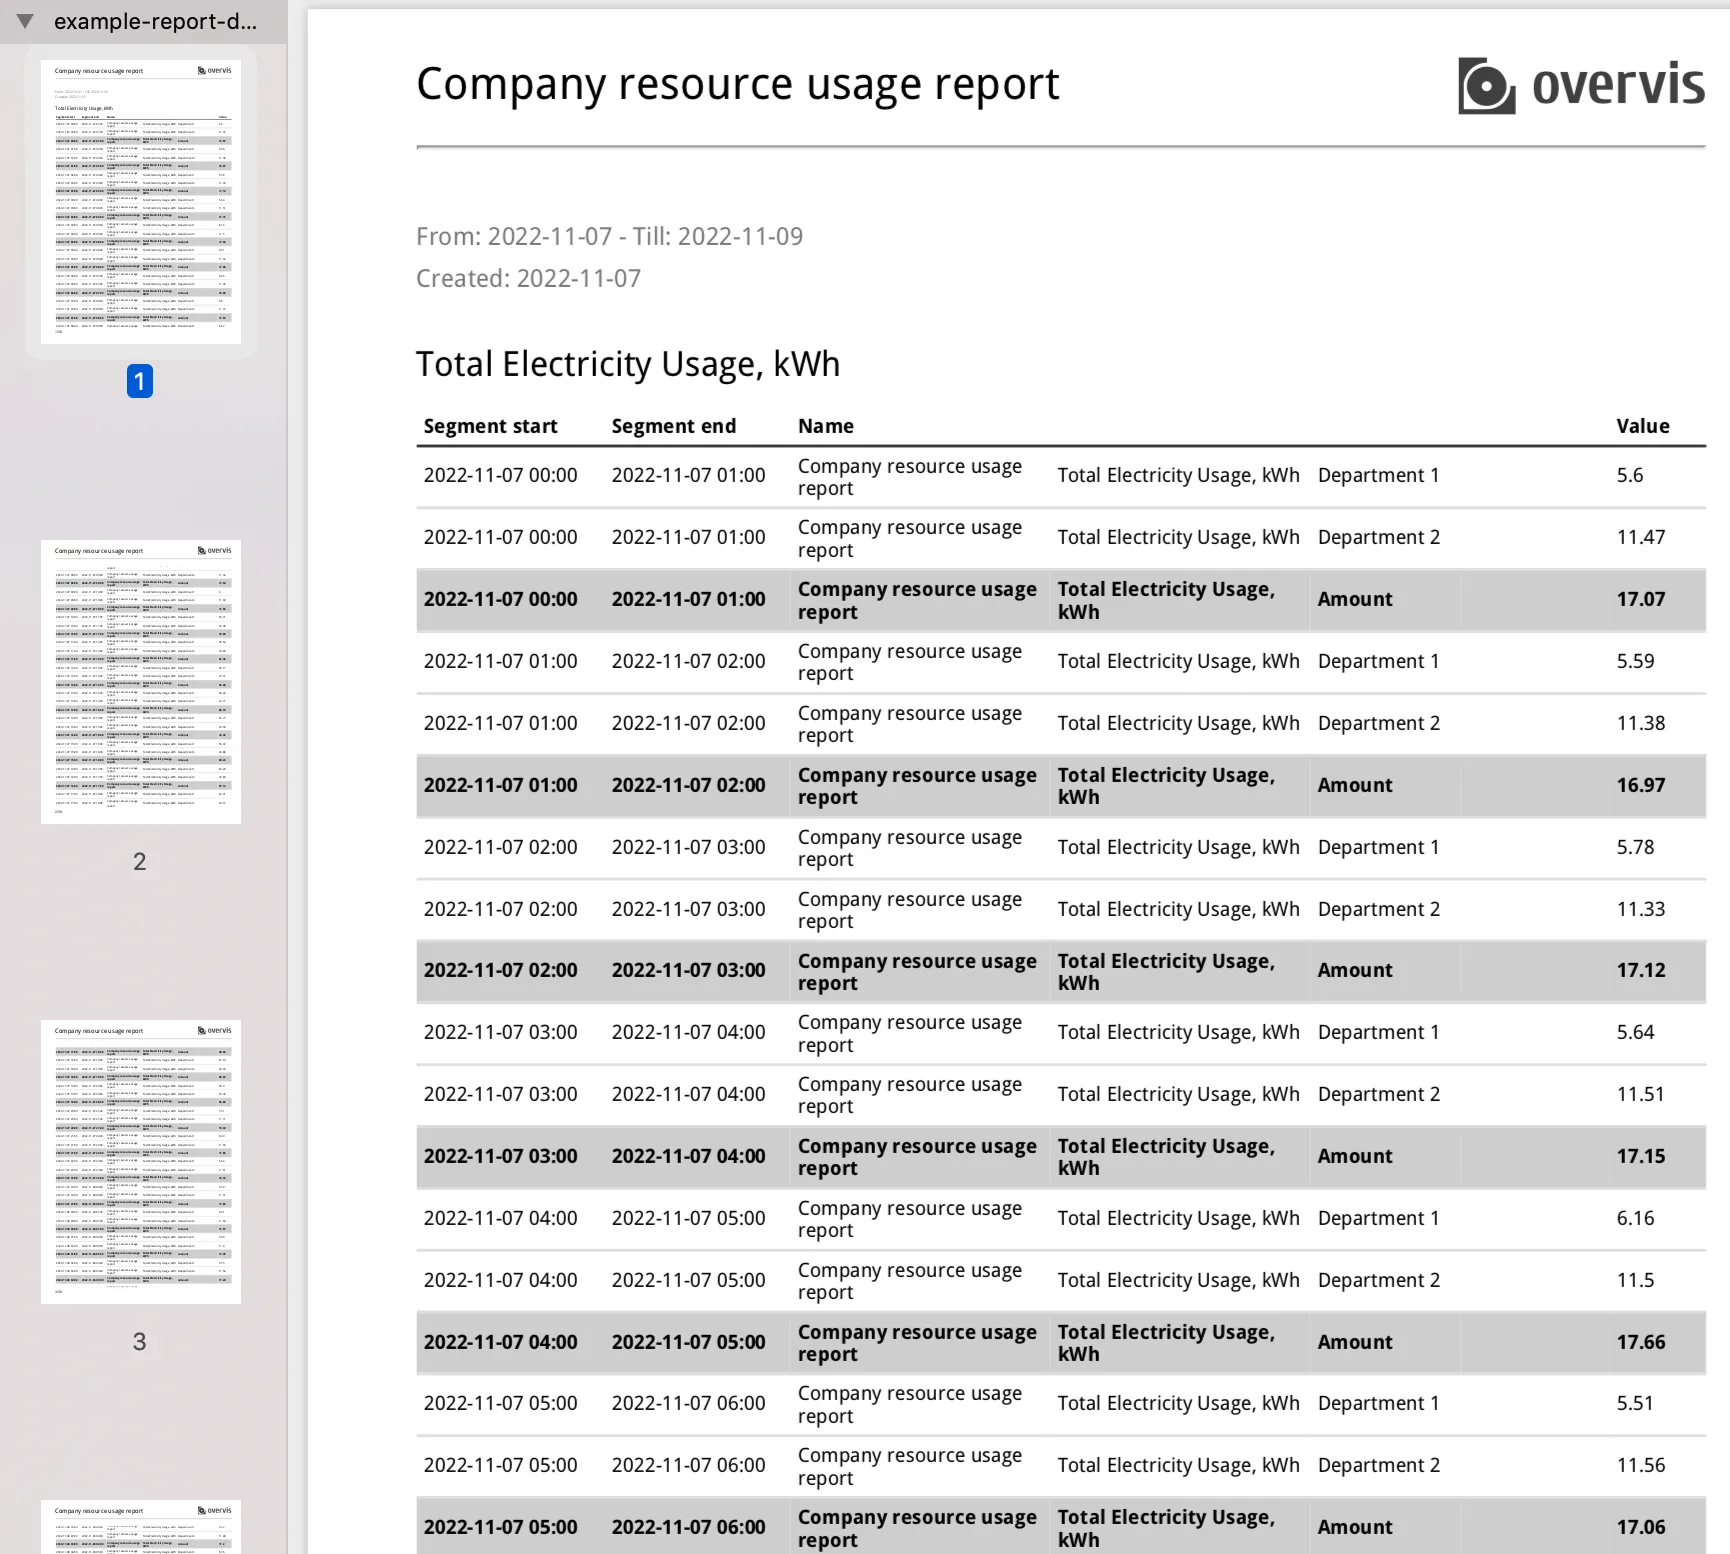
Detailed report — a checkbox next to the export buttons (visible to managers only). When checked, the exported file includes the full hierarchy of branches, sub-branches, individual meter readings, and formula calculations. When unchecked (or when viewing as a monitor), the export shows only the main (top-level) branches — a summary suitable for executive reports.
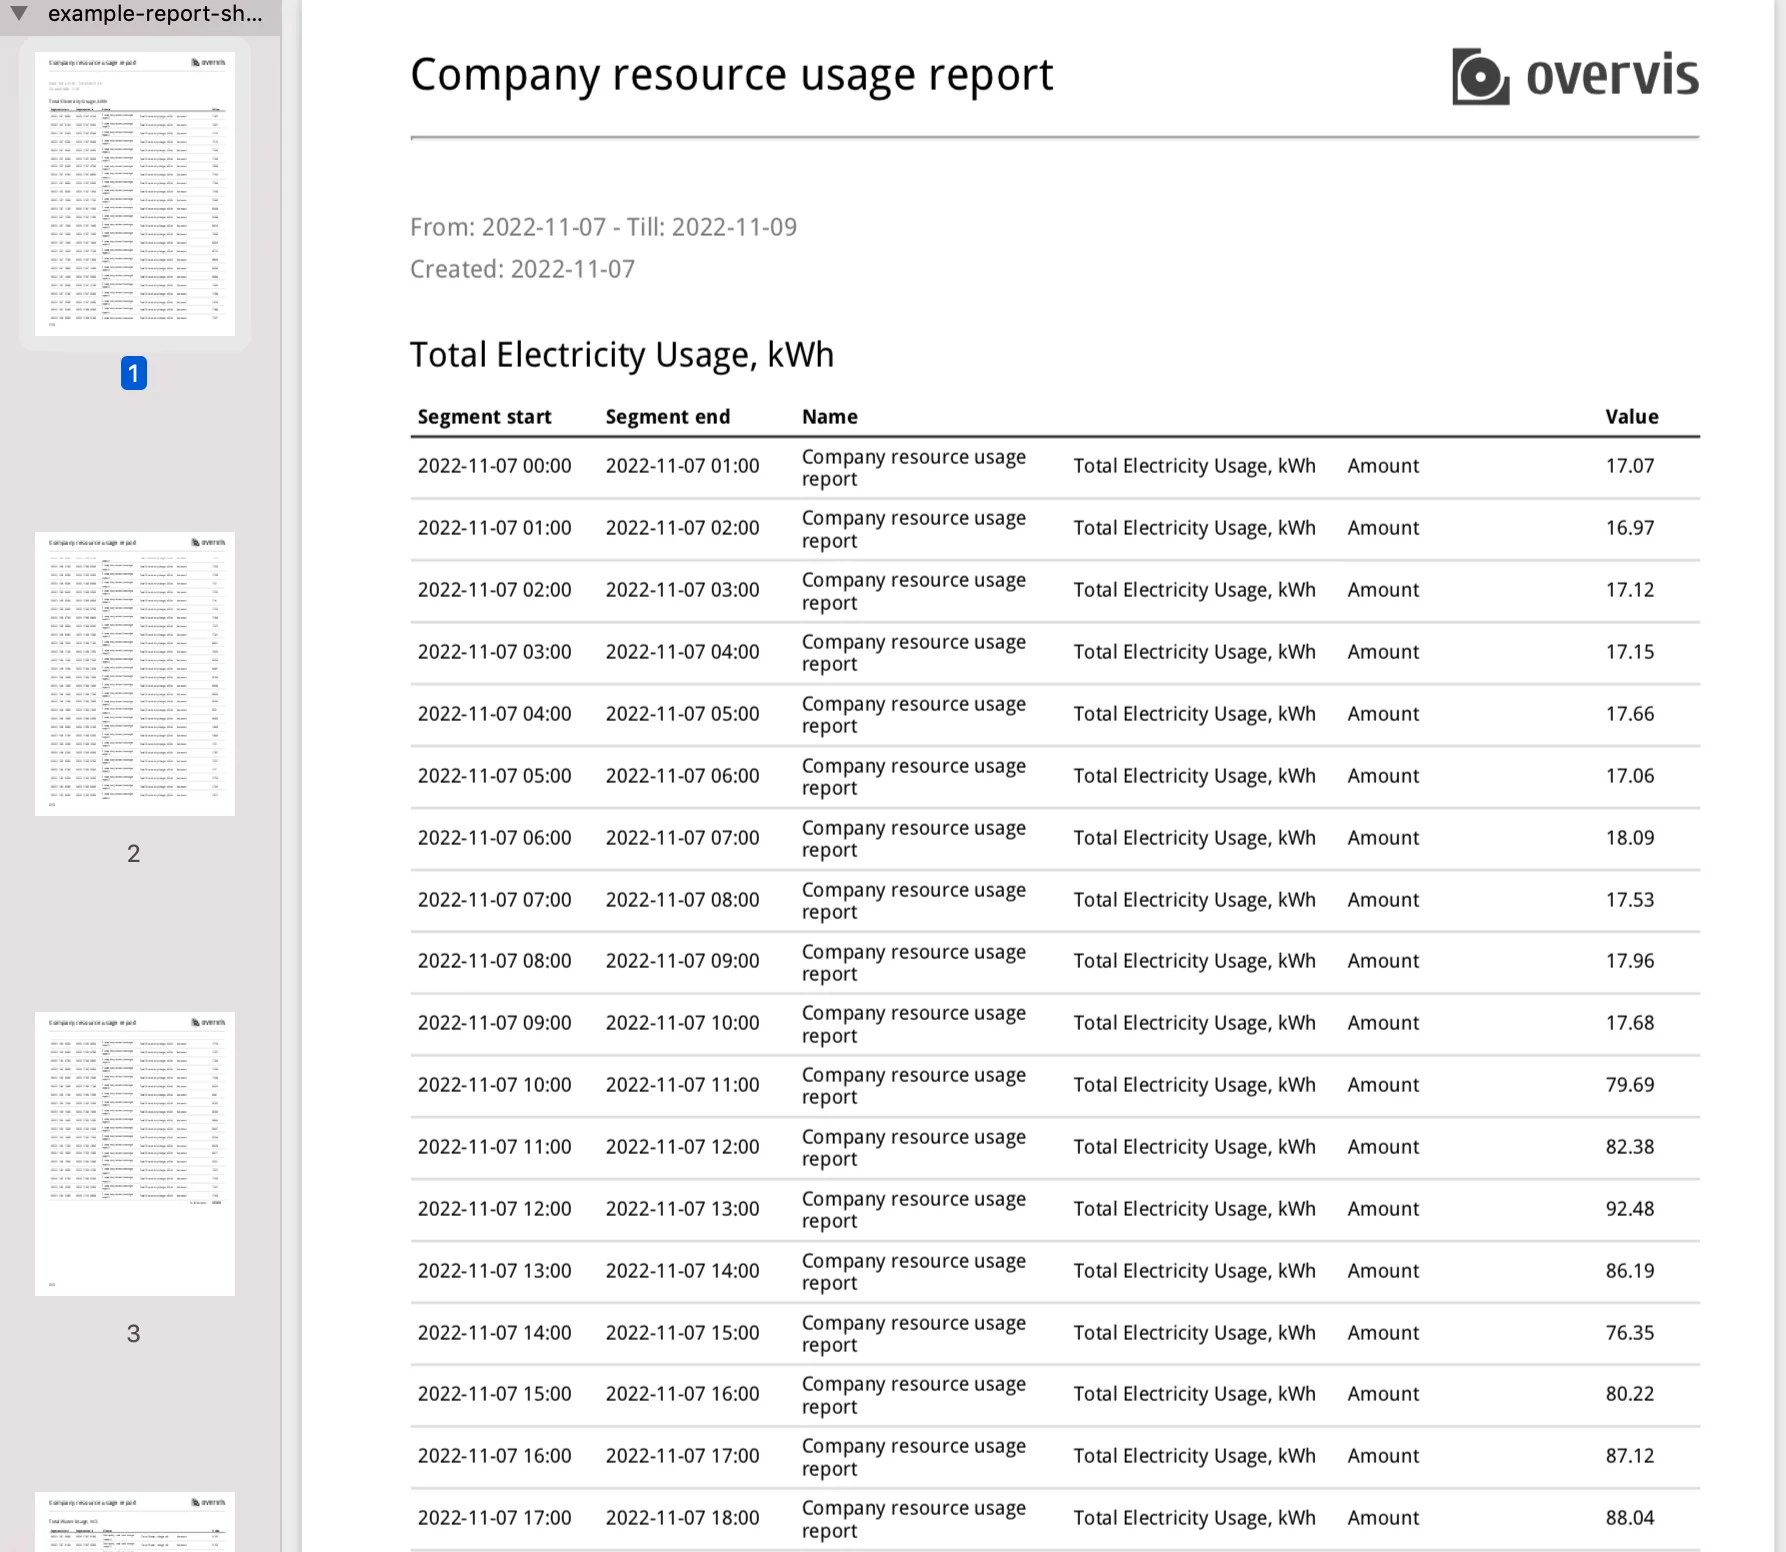
Short report — generated when the detailed checkbox is off. Shows only top-level branches with their aggregated values.
Send PDF to e-mail — click the button, enter the recipient’s email address, and the report is generated and delivered immediately. This uses the same time range, segmentation, and branch selection as the regular PDF export.
Creating a report
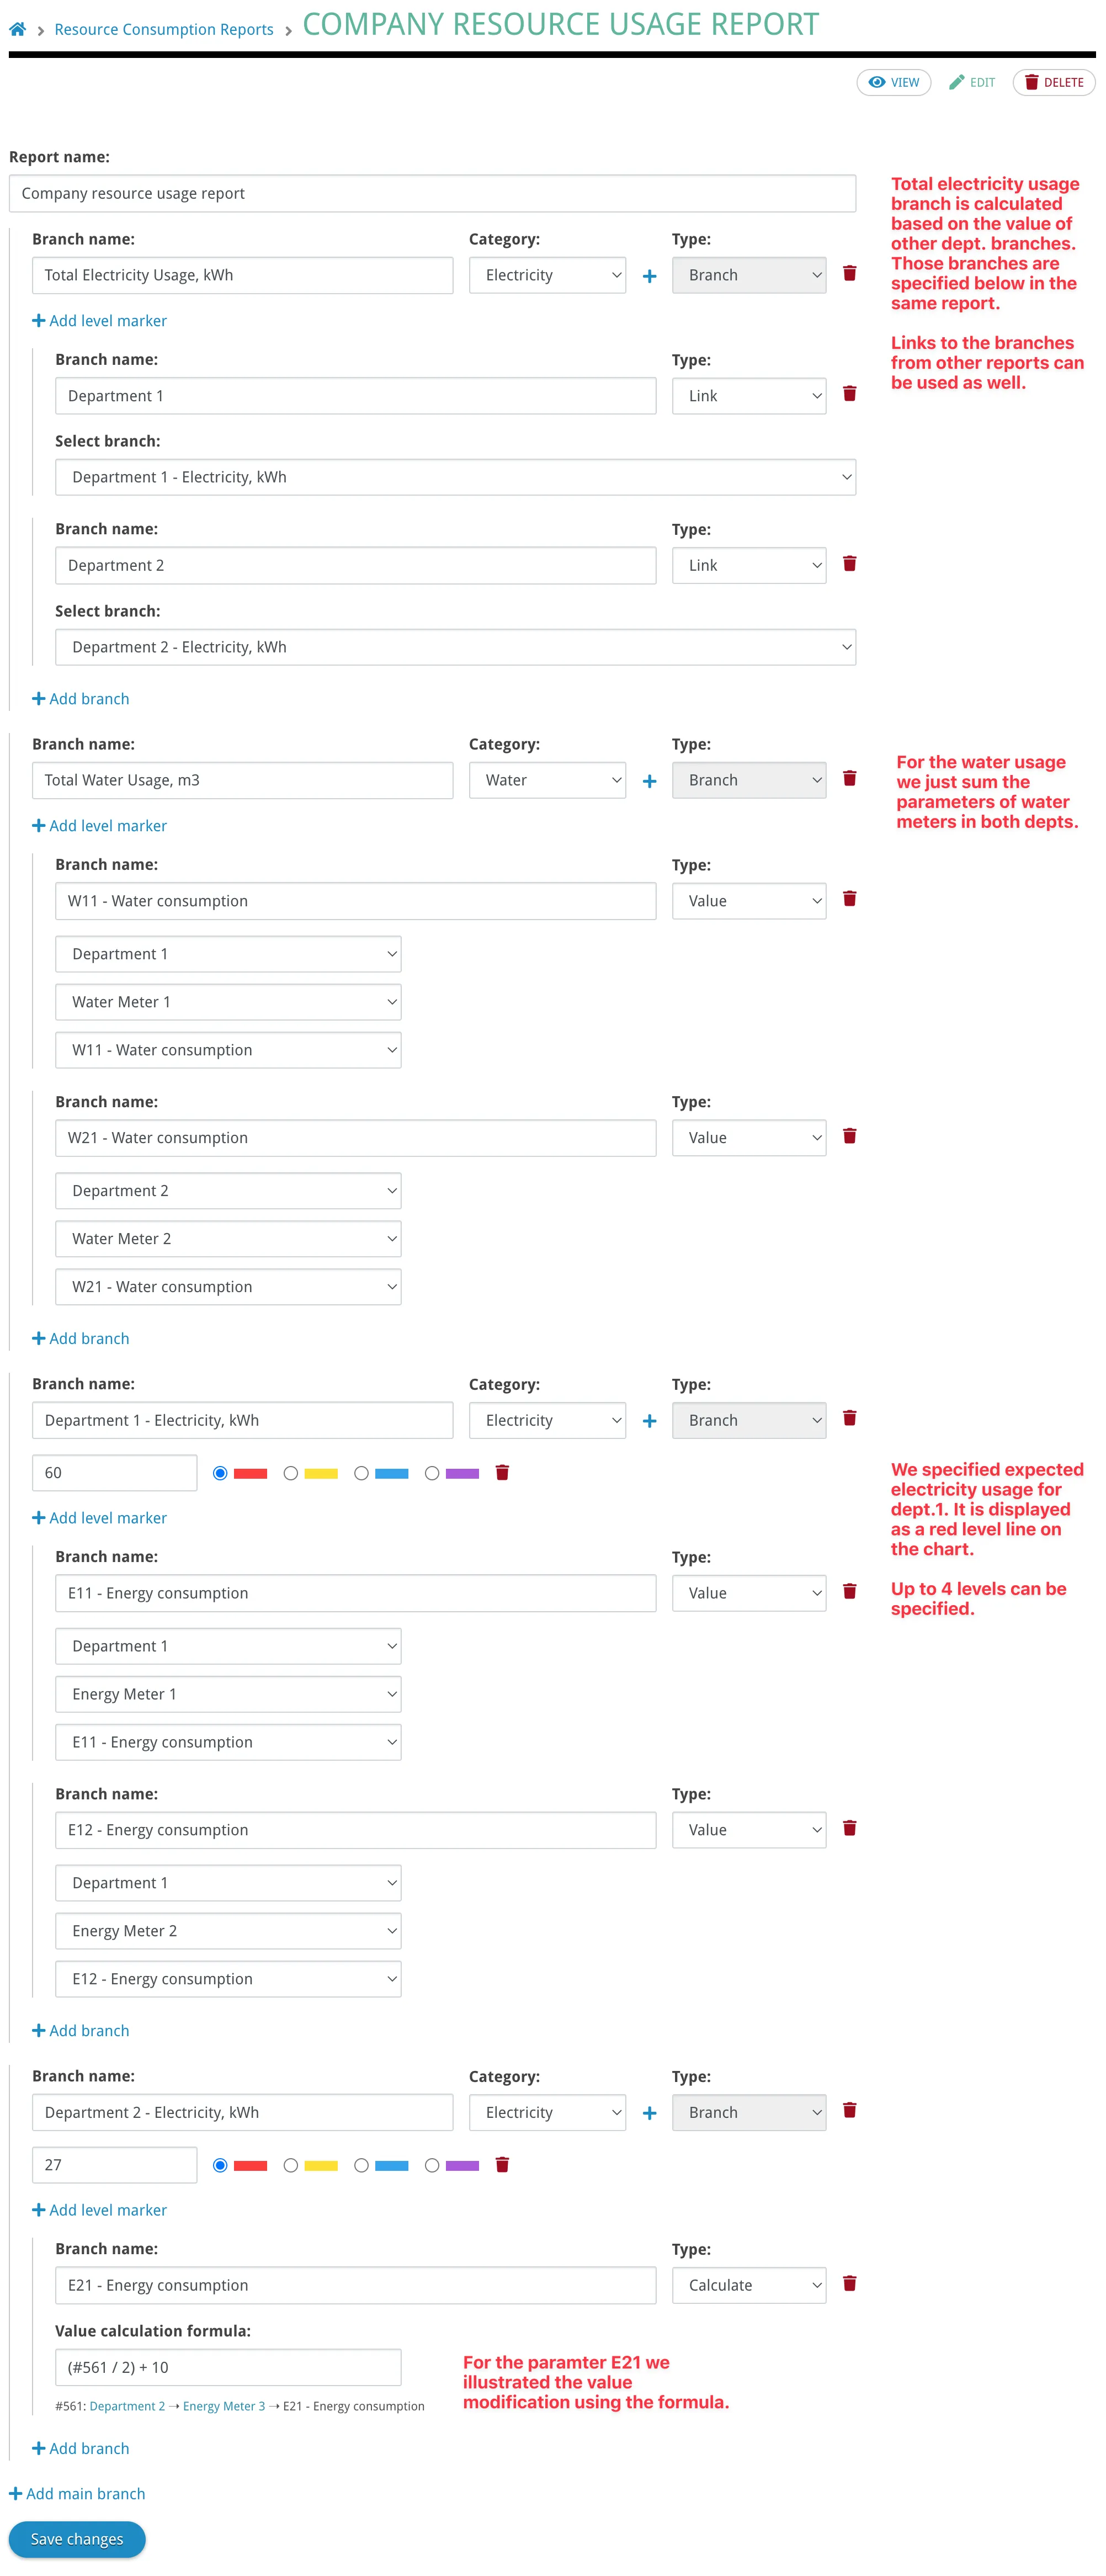
Section titled “Creating a report”Navigate to Reports → Resources Consumption and click Create new to open the report constructor. A report is defined by its tree structure — you build a hierarchy of branches that describes how your consumption data should be grouped and calculated.
Node types
Section titled “Node types”Each node in the tree has a type that determines where its value comes from:
| Type | Purpose |
|---|---|
| Branch | A container for child nodes. Its value equals the sum of all children. Use branches for grouping — by department, building, resource type, etc. You can nest branches up to 5 levels below the root. |
| Value | References a single device parameter. Displays that parameter’s consumption (delta) per time segment. You select the parameter through a three-step dropdown: network → device → parameter. |
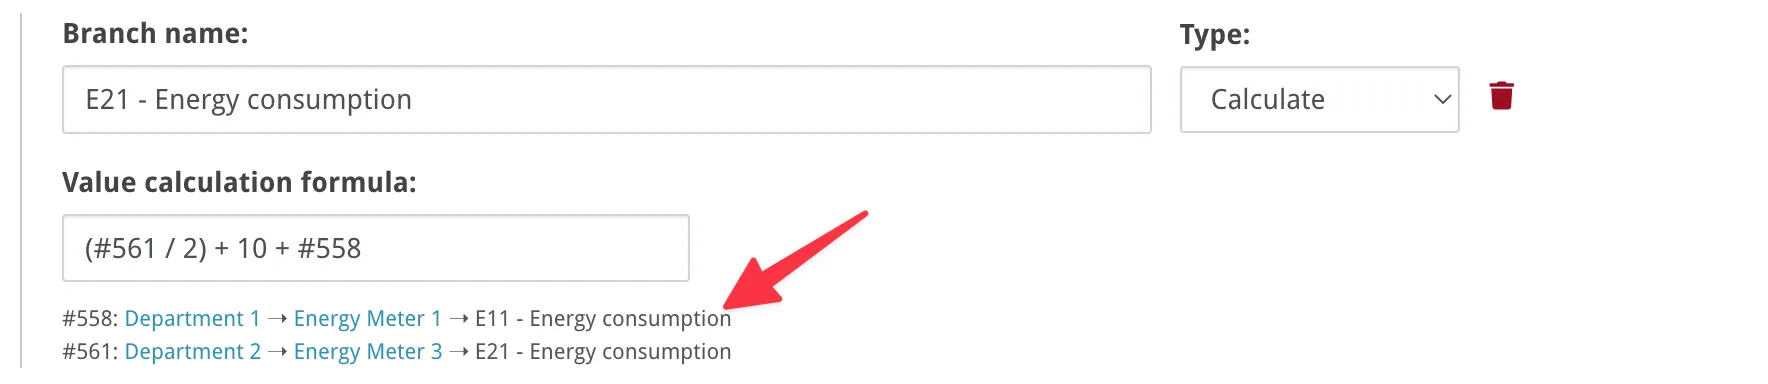
| Calculate | Evaluates a formula that combines multiple parameters. Reference parameters by their ID with the # prefix (e.g. #561 * 2 + #558). See Using Formulas for syntax details. |
| Link | References an existing branch from this or another report in the same organization. The link picker shows all branches from all reports, so you can reuse common structures without duplicating them. |
To build the tree, start by clicking Add main branch to create a top-level (root) branch. Within each branch, click Add branch to add children of any type. The tree grows from top to bottom — main branches at the top, leaf nodes (Value, Calculate, Link) at the bottom.
Main branch settings
Section titled “Main branch settings”Main (top-level) branches have two additional settings that affect the online view:
Category — an optional label that groups related branches under a heading. For example, you might group all energy branches under “Energy” and all water branches under “Water”. Branches without a category appear first, followed by category groups. Categories are only used in the online view and do not appear in Excel/PDF exports.
Level markers — up to 4 threshold values, each with a color. On the chart, these appear as horizontal reference lines and as color-coded stacked bar segments. For example, you might set a yellow marker at 50 kWh and a red marker at 100 kWh to highlight when consumption exceeds expected levels. Level markers are only used in the online view and do not appear in Excel/PDF exports.
Time range and segmentation
Section titled “Time range and segmentation”When viewing a report, you choose the time range and segmentation interval using the controls above the charts.
The time range determines which period to analyze. The preset dropdown offers Last day, Last 7 days, and Last 30 days, or you can select Custom and pick specific dates with the date pickers.
The segmentation determines how the time range is divided into intervals: By half-hour (30-minute intervals), By hour, or By date (daily intervals). Smaller intervals produce more detail but also more data points — on large date ranges with many parameters, you may need a larger interval to avoid hitting export limits.
Charts and exports use the timezone detected from your browser. All segment boundaries are aligned to your local timezone.
Using formulas
Section titled “Using formulas”The Calculate node type uses formulas to combine multiple parameters. Formulas reference parameters by their ID (prefixed with #) and are evaluated for each time segment using that segment’s delta values.
Example formula:
(#561 + 10) / 2 + #558This formula takes the delta of parameter #561, adds 10, divides by 2, then adds the delta of parameter #558.
If a referenced parameter has no data for a given segment (e.g. the device was offline or the parameter was deleted), its value is treated as 0.
Supported operators
Section titled “Supported operators”Overvis uses the math-expression-evaluator library:
| Symbol | Explanation |
|---|---|
+ | Addition operator, e.g. 2+3 results 5 |
- | Subtraction operator, e.g. 2-3 results -1 |
/ | Division operator, e.g. 3/2 results 1.5 |
* | Multiplication operator, e.g. 2*3 results 6 |
Mod | Modulus operator, e.g. 3 Mod 2 results 1 |
( ) | Parentheses for grouping |
^ | Power operator, e.g. 2^3 results 8 |
Example Formulas
Sum of two meters:
#561 + #562Difference between meters:
#561 - #562Apply scaling factor:
#561 * 1.15Weighted combination (example):
(#561 * 0.8 + #562 * 0.2) / (#563 + 10)Finding parameter IDs
Section titled “Finding parameter IDs”Go to the device page and hover over any parameter to see its ID in the tooltip:
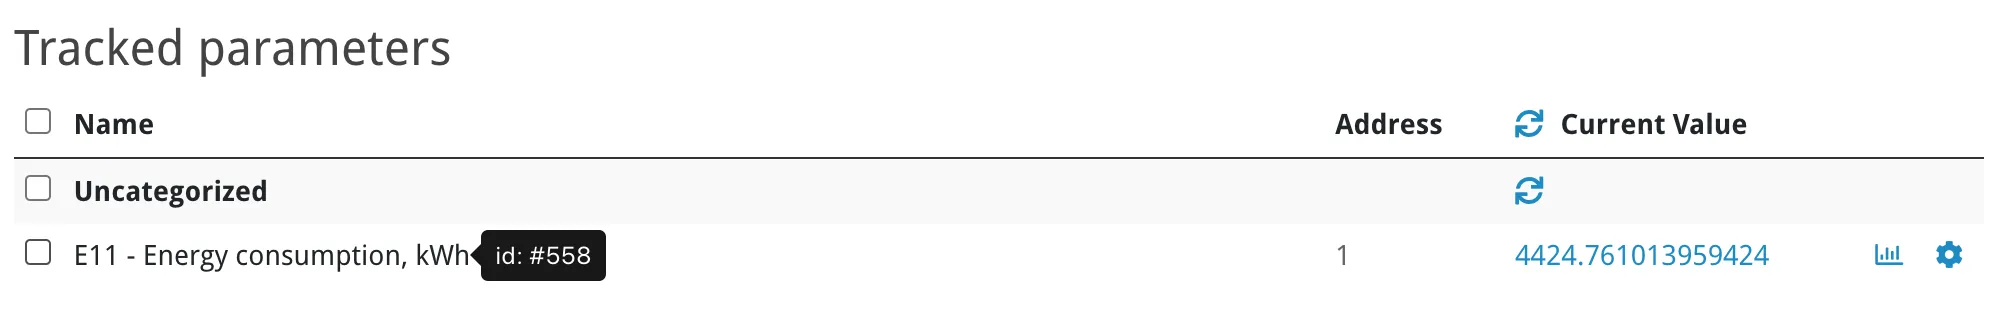
When you enter a formula, the parameter names appear below the input field. Missing or incorrect IDs are highlighted:
Access control
Section titled “Access control”Users with the manager role can create, edit, and delete reports, and have access to the Detailed report checkbox for exports.
Monitors can be granted view-only access to a specific resource consumption report. They can view the charts and download exports, but only the short (non-detailed) version — the detailed checkbox is hidden. Monitors cannot create or edit reports. Monitor access is configured when inviting a user to the organization, where you can bind the monitor role to a specific report.
Troubleshooting
Section titled “Troubleshooting”“Segment limit exceeded” error when exporting
Section titled ““Segment limit exceeded” error when exporting”The requested combination of date range, segmentation, and number of parameters exceeds the export limit. The error message shows the nearest available date for your chosen segmentation.
Solutions:
- Reduce the date range.
- Use a larger segmentation interval (e.g. “By date” instead of “By hour”).
- Hide some main branches before exporting — only visible branches (checked in the legend) are included.
All values show as zero
Section titled “All values show as zero”The parameters you selected are likely not accumulating counters. This report calculates the difference (delta) between readings within each segment. If the parameter value doesn’t change between readings (e.g. it’s an instantaneous measurement like temperature), all deltas will be zero.
Solutions:
- Verify the selected parameters represent accumulating counters (energy, water, gas meters, etc.).
- For non-accumulating parameters, use the Parameter Values Report instead.
Unexpected or negative values
Section titled “Unexpected or negative values”Negative deltas can occur when a meter counter resets or rolls over.
Solutions:
- Check the raw parameter readings on the device page to confirm the counter reset.
- If the parameter has a multiplier or shift configured, verify those values are correct — the delta is computed as
(value - previous_value) × multiplier + shift.
Charts show no data for some segments
Section titled “Charts show no data for some segments”The device may have been offline or not polling during those time periods. Segments with no readings are skipped in the chart.
Solutions:
- Check the device connection status for the affected time range.
- Verify the device was polling during that period.
Formula shows 0 for all segments
Section titled “Formula shows 0 for all segments”Possible causes:
- A parameter ID in the formula doesn’t match any existing parameter (missing IDs are treated as 0).
- The formula syntax is invalid (parse errors default to 0).
Solutions:
- Hover over each parameter on the device page to confirm its ID.
- Verify all
#idreferences in the formula match existing parameters in your organization. - Check the formula for syntax errors — when entering a formula, parameter names appear below the input field and missing or incorrect IDs are highlighted.
Exported report is empty or missing branches
Section titled “Exported report is empty or missing branches”Only the branches visible in the online view (checked in the legend) are included in exports.
Solutions:
- Make sure the branches you need are checked in the legend before downloading.
Chart data looks different from the export
Section titled “Chart data looks different from the export”The online chart may clamp the start date if the requested range would exceed the chart data point limit. The export uses the full requested date range. This means you may see a shorter time range in the chart than what appears in the downloaded XLSX/PDF.
Common questions
Section titled “Common questions”What types of parameters work with this report?
Section titled “What types of parameters work with this report?”Any parameter that represents an accumulating counter — the value grows over time. Common examples: energy meters (kWh), water meters (m³), gas meters, run-hour counters, production counters. Parameters that represent instantaneous values (temperature, pressure, voltage) are not suitable for this report; use the Parameter Values Report instead.
Can I include parameters from different devices in one report?
Section titled “Can I include parameters from different devices in one report?”Yes. The tree structure lets you combine parameters from any devices across any networks in the same organization. This is useful for aggregating consumption across multiple meters or locations.
How does the delta calculation work exactly?
Section titled “How does the delta calculation work exactly?”For each time segment, the system finds the highest recorded reading within that segment and subtracts the latest reading recorded before the segment started. If there is no prior reading, zero is used. The result is then multiplied by the parameter’s multiplier and adjusted by its shift value (if configured).
Can I reuse parts of one report in another?
Section titled “Can I reuse parts of one report in another?”Yes, use the Link node type when creating a report. It lets you reference any branch from any report in the same organization, so you don’t have to rebuild common structures.
Can I schedule automatic report delivery?
Section titled “Can I schedule automatic report delivery?”No. Resource Consumption Reports can only be sent via email manually using the Send PDF to e-mail button. For scheduled automatic report delivery, see the Parameter Values Report.
What is the maximum report tree depth?
Section titled “What is the maximum report tree depth?”You can nest branches up to 5 levels below the root (main) branches. The root branch is level 0, and child branches can go down to level 5.
Why can’t I see the “Detailed report” checkbox?
Section titled “Why can’t I see the “Detailed report” checkbox?”The detailed export option is only available to users with the manager role. Monitors see only the short (summary) version of exports.
What happens if I delete a device or parameter used in a report?
Section titled “What happens if I delete a device or parameter used in a report?”If a parameter referenced by a Value node is deleted, that node will show no data (empty deltas). If a parameter referenced in a Calculate formula is deleted, its value is treated as 0 in the formula. The report structure itself is preserved — you can edit it to replace the missing parameter.
Is there a limit on how much data I can export?
Section titled “Is there a limit on how much data I can export?”Yes. Exports are limited by the total number of data points (segments × parameters). The exact limits depend on the format — PDF has a lower limit than Excel. If you exceed the limit, you’ll see a “Segment limit exceeded” error with a suggested date range. Reduce the date range or use a larger segmentation interval.