Overvis Hazard Analysis and Critical Control Points (HACCP) Report
HACCP (Hazard Analysis and Critical Control Points) is a systematic food safety management approach that identifies, evaluates, and controls hazards throughout the food production and storage chain. In refrigeration and cold chain operations, HACCP requires continuous temperature monitoring at critical control points, with documented evidence that safety limits are maintained.
The Overvis HACCP Report tool automates temperature monitoring compliance for refrigeration and freezer control points. It pulls temperature readings from monitored devices and produces structured reports that:
- Display temperature values at configurable time intervals (from 15 minutes to daily)
- Detect when temperatures exceed operational or critical thresholds
- Flag missing data or unknown equipment status
- Support documenting corrective actions for detected exceptions
- Enable formal review and sign-off by authorized personnel
- Export to Excel for record-keeping and audits
This tool supports temperature monitoring documentation requirements under common HACCP frameworks, including Codex Alimentarius principles and EU food hygiene regulations (EC 852/2004). It is designed specifically for refrigeration and freezer HACCP review and is not a general-purpose HACCP system covering all hazard types.
Each report is scoped to a single organization. If you manage multiple facilities, generate separate reports for each organization.
All temperatures are treated as Celsius. All date and time calculations use the organization’s configured timezone, including correct handling of daylight saving time transitions.
Quick Start
Section titled “Quick Start”-
Configure the report (see Report Builder). Go to Reports > HACCP: the action tab reads HACCP report, while the page heading is HACCP. Set the report name, date range, time interval (cadence), and temperature display mode. Add one or more temperature parameters by selecting a network, device, and parameter for each. Optionally configure setpoint, defrost, and on/off parameters. Set operational and critical thresholds as needed.
-
Save as a template (optional, see Report Templates). Save the current configuration as a template for future reuse. Templates store everything except the date range, so you can quickly regenerate reports for new periods without reconfiguring parameters and thresholds each time.
-
Generate the report (see Generated Report). Click Generate report to produce the report from live data. The exception summary appears immediately, showing any threshold violations, data gaps, and unknown equipment states across the selected period.
-
Document corrective actions (see Corrective Action Notes). Review the exception summary and add corrective action notes to any exceptions that require them. Notes are attached to specific exception intervals and are included in the final report.
-
Submit review (see Report Review). An authorized user adds review comments and submits the review. This creates a permanent, immutable snapshot of the report — including all readings, exceptions, and corrective action notes as they were at generation time.
-
Export to Excel (see Excel Export). Export the report to an Excel file at any point after generation, whether before or after review. The exported workbook contains the same data shown in the browser.
Navigation
Section titled “Navigation”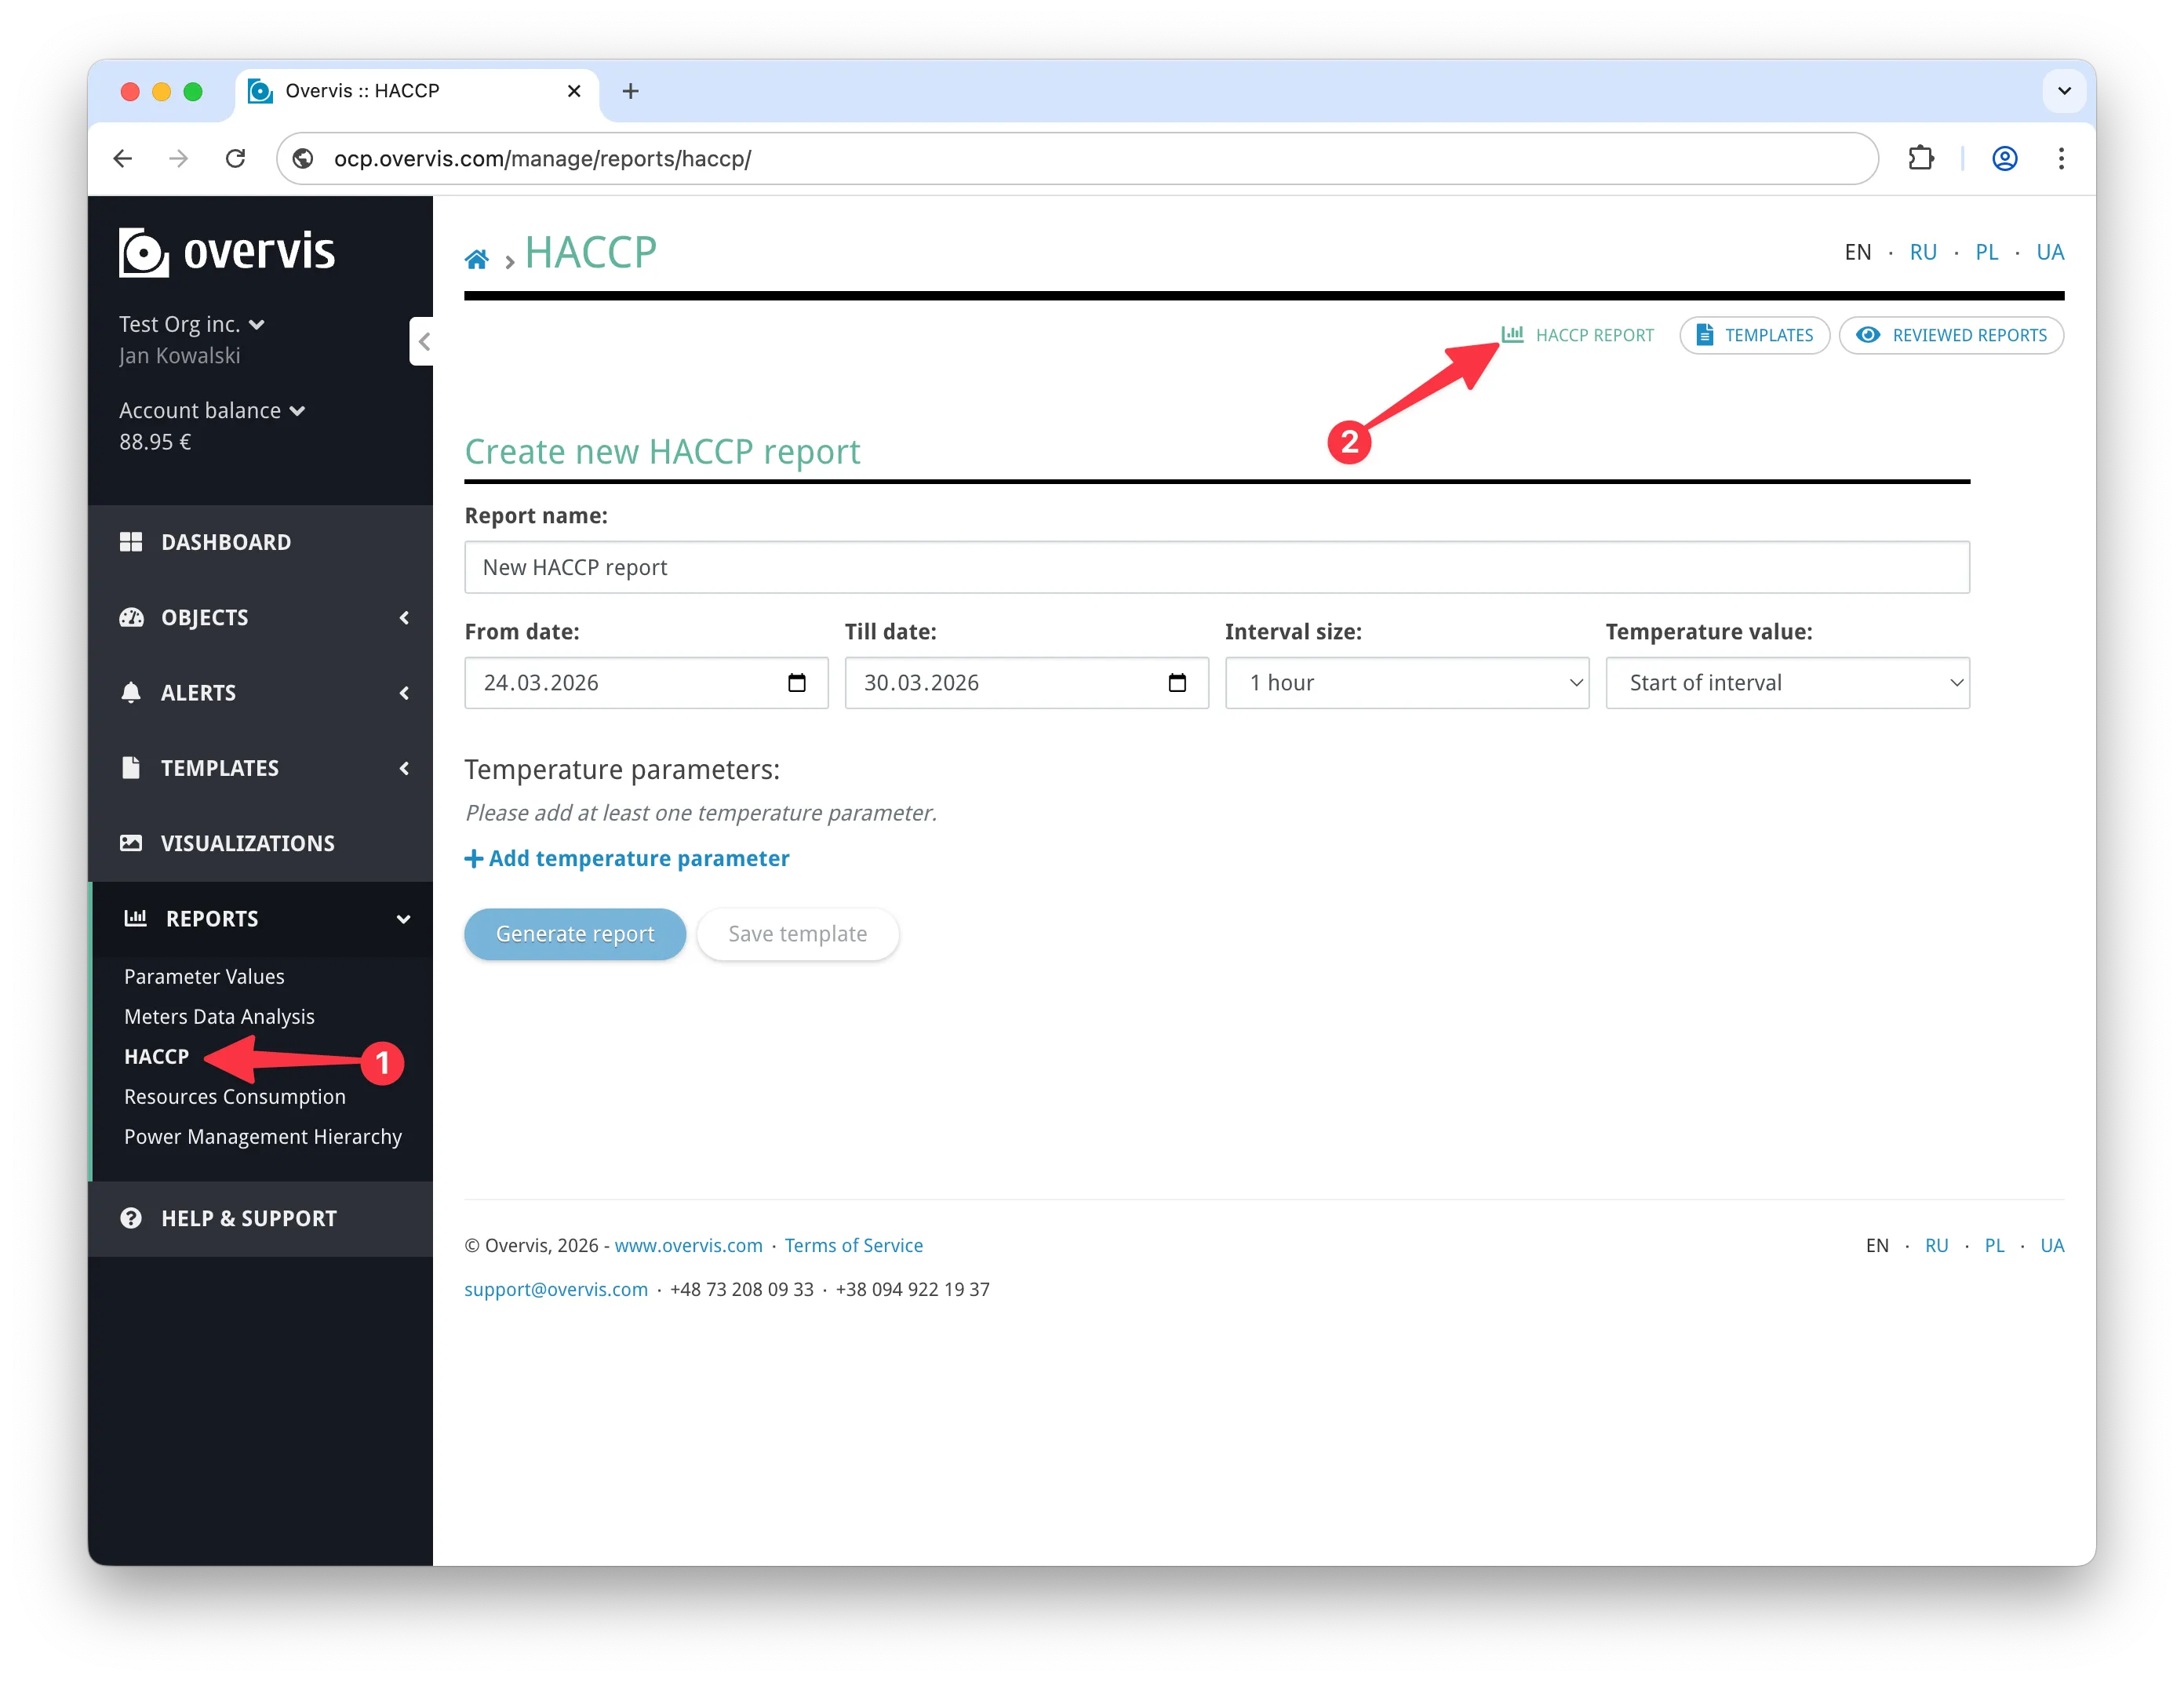
To open the HACCP report, go to Reports > HACCP in the main navigation menu (1) (tab HACCP report; builder page heading HACCP).
The feature is organized into three sections (2), accessible via navigation tabs at the top of the page:
- HACCP report — short tab label; the builder page heading is HACCP. The report builder where you configure parameters, generate reports, document corrective actions, and submit reviews.
- Templates — short tab label; the templates list page heading is HACCP Templates. Saved report configurations that can be loaded into the builder for quick regeneration with new date ranges.
- Reviewed Reports — short tab label; the list page heading is Reviewed HACCP Reports. All submitted report snapshots, available for viewing and export.
The navigation tabs remain visible on all HACCP pages, including template detail, delete confirmation, and reviewed report detail pages.
Report Builder
Section titled “Report Builder”The report builder is the main working area of the page whose heading is HACCP (the action tab label is HACCP report). It allows you to configure which temperature parameters to monitor, set the reporting period and time interval, define acceptable temperature thresholds, and generate the report.
The builder is always visible at the top of that page. After you generate a report, the results appear below the builder. You can freely adjust builder settings without losing the generated report or any draft corrective action notes — changes only take effect when you click Generate report again. Regenerating the report replaces the previous results and discards all draft corrective action notes.
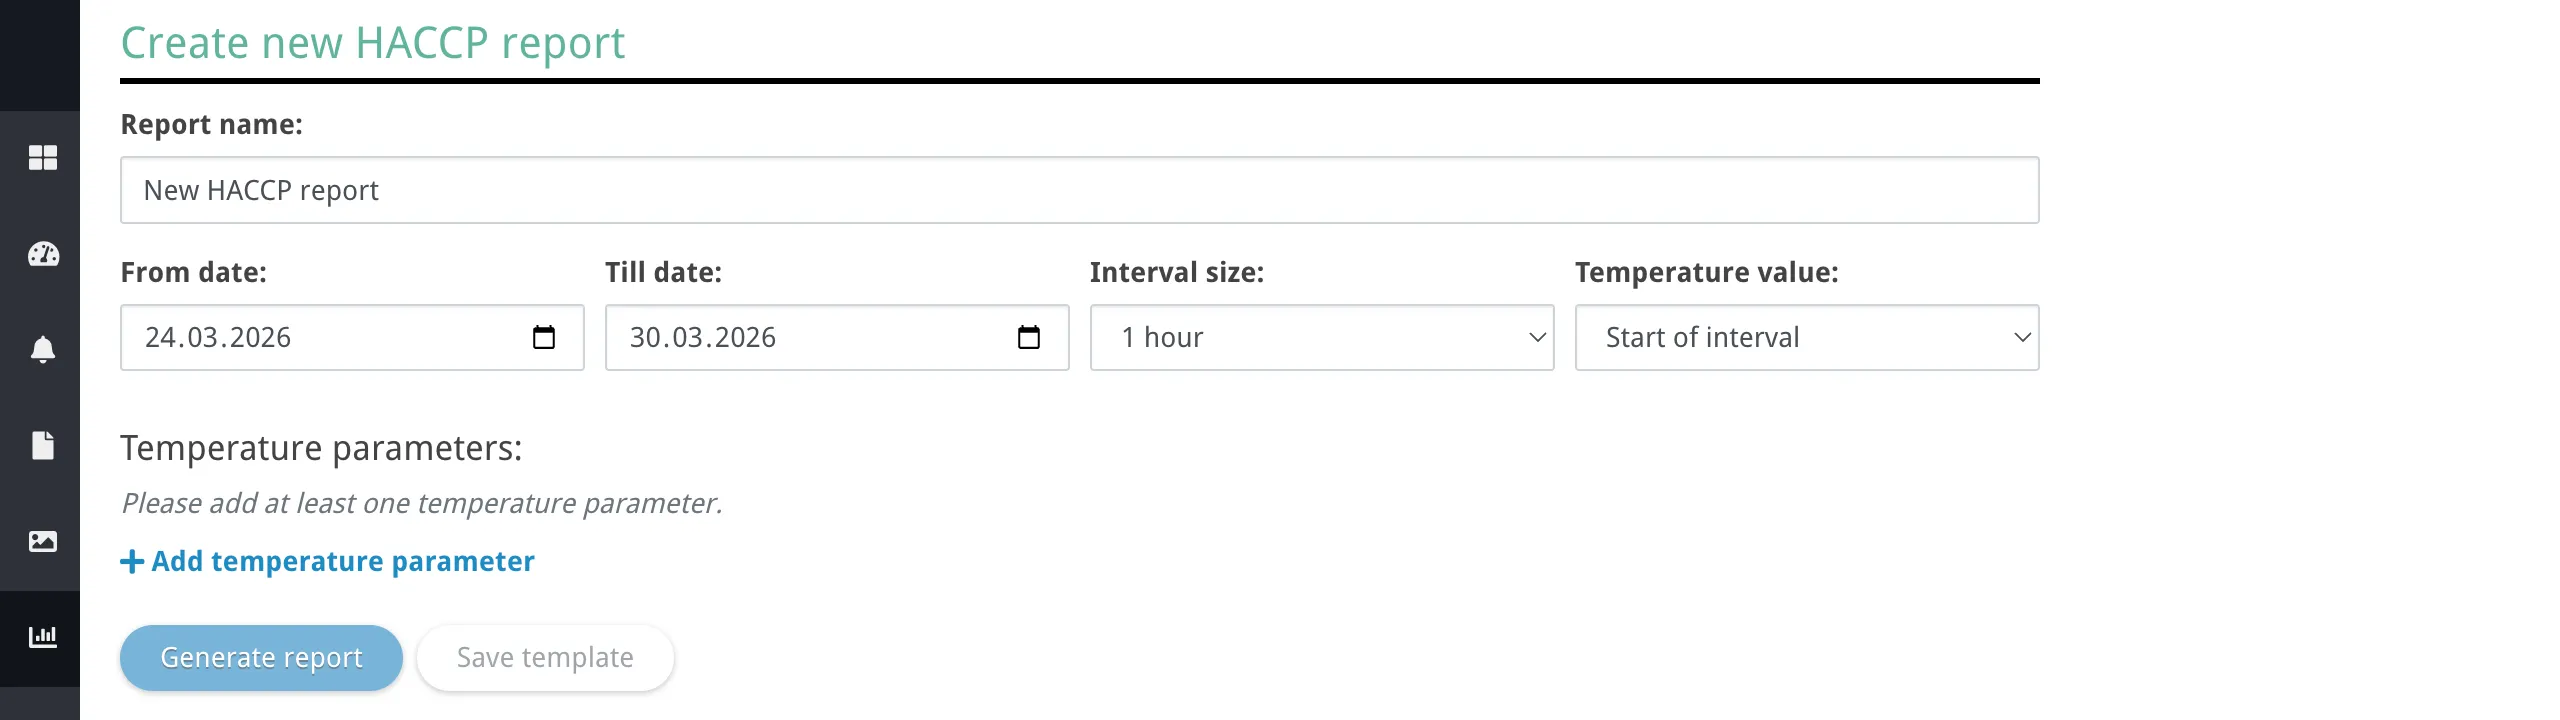
Report Settings
Section titled “Report Settings”-
Report name — a free-text name for the report. This name appears in the report header, in template and reviewed report lists, and in the exported Excel file. Required.
-
From date / Till date — the date range for the report, inclusive. Defaults to the last 7 days. You can select any date range; the system enforces a total dataset size limit that depends on the number of parameters and interval size. All dates and times throughout the report use the organization’s stored timezone. If you need a different timezone for the organization, ask your Overvis administrator or support — the UI may not expose a dedicated timezone field under Organization settings in all deployments.
-
Interval size — the time cadence at which readings are grouped into segments. Available options:
- 1 day — one segment per calendar day
- 1 hour — segments aligned to each hour of the day
- 30 minutes — segments aligned to each half-hour
- 15 minutes — segments aligned to each quarter-hour
Shorter intervals produce more detailed reports but increase the report size. The combination of date range, interval size, and number of configured parameters determines the total dataset size.
-
Temperature value — controls how the temperature reading is computed for each segment when multiple readings exist within it:
- Start of interval — the reading closest to the beginning of the segment
- Average — the arithmetic mean of all readings in the segment
- Minimum — the lowest reading in the segment
- Maximum — the highest reading in the segment
This choice affects both the displayed values and threshold exception detection. For example, if Average is selected, a brief spike above a critical limit may not trigger an exception if the average stays within range.
Temperature Parameters
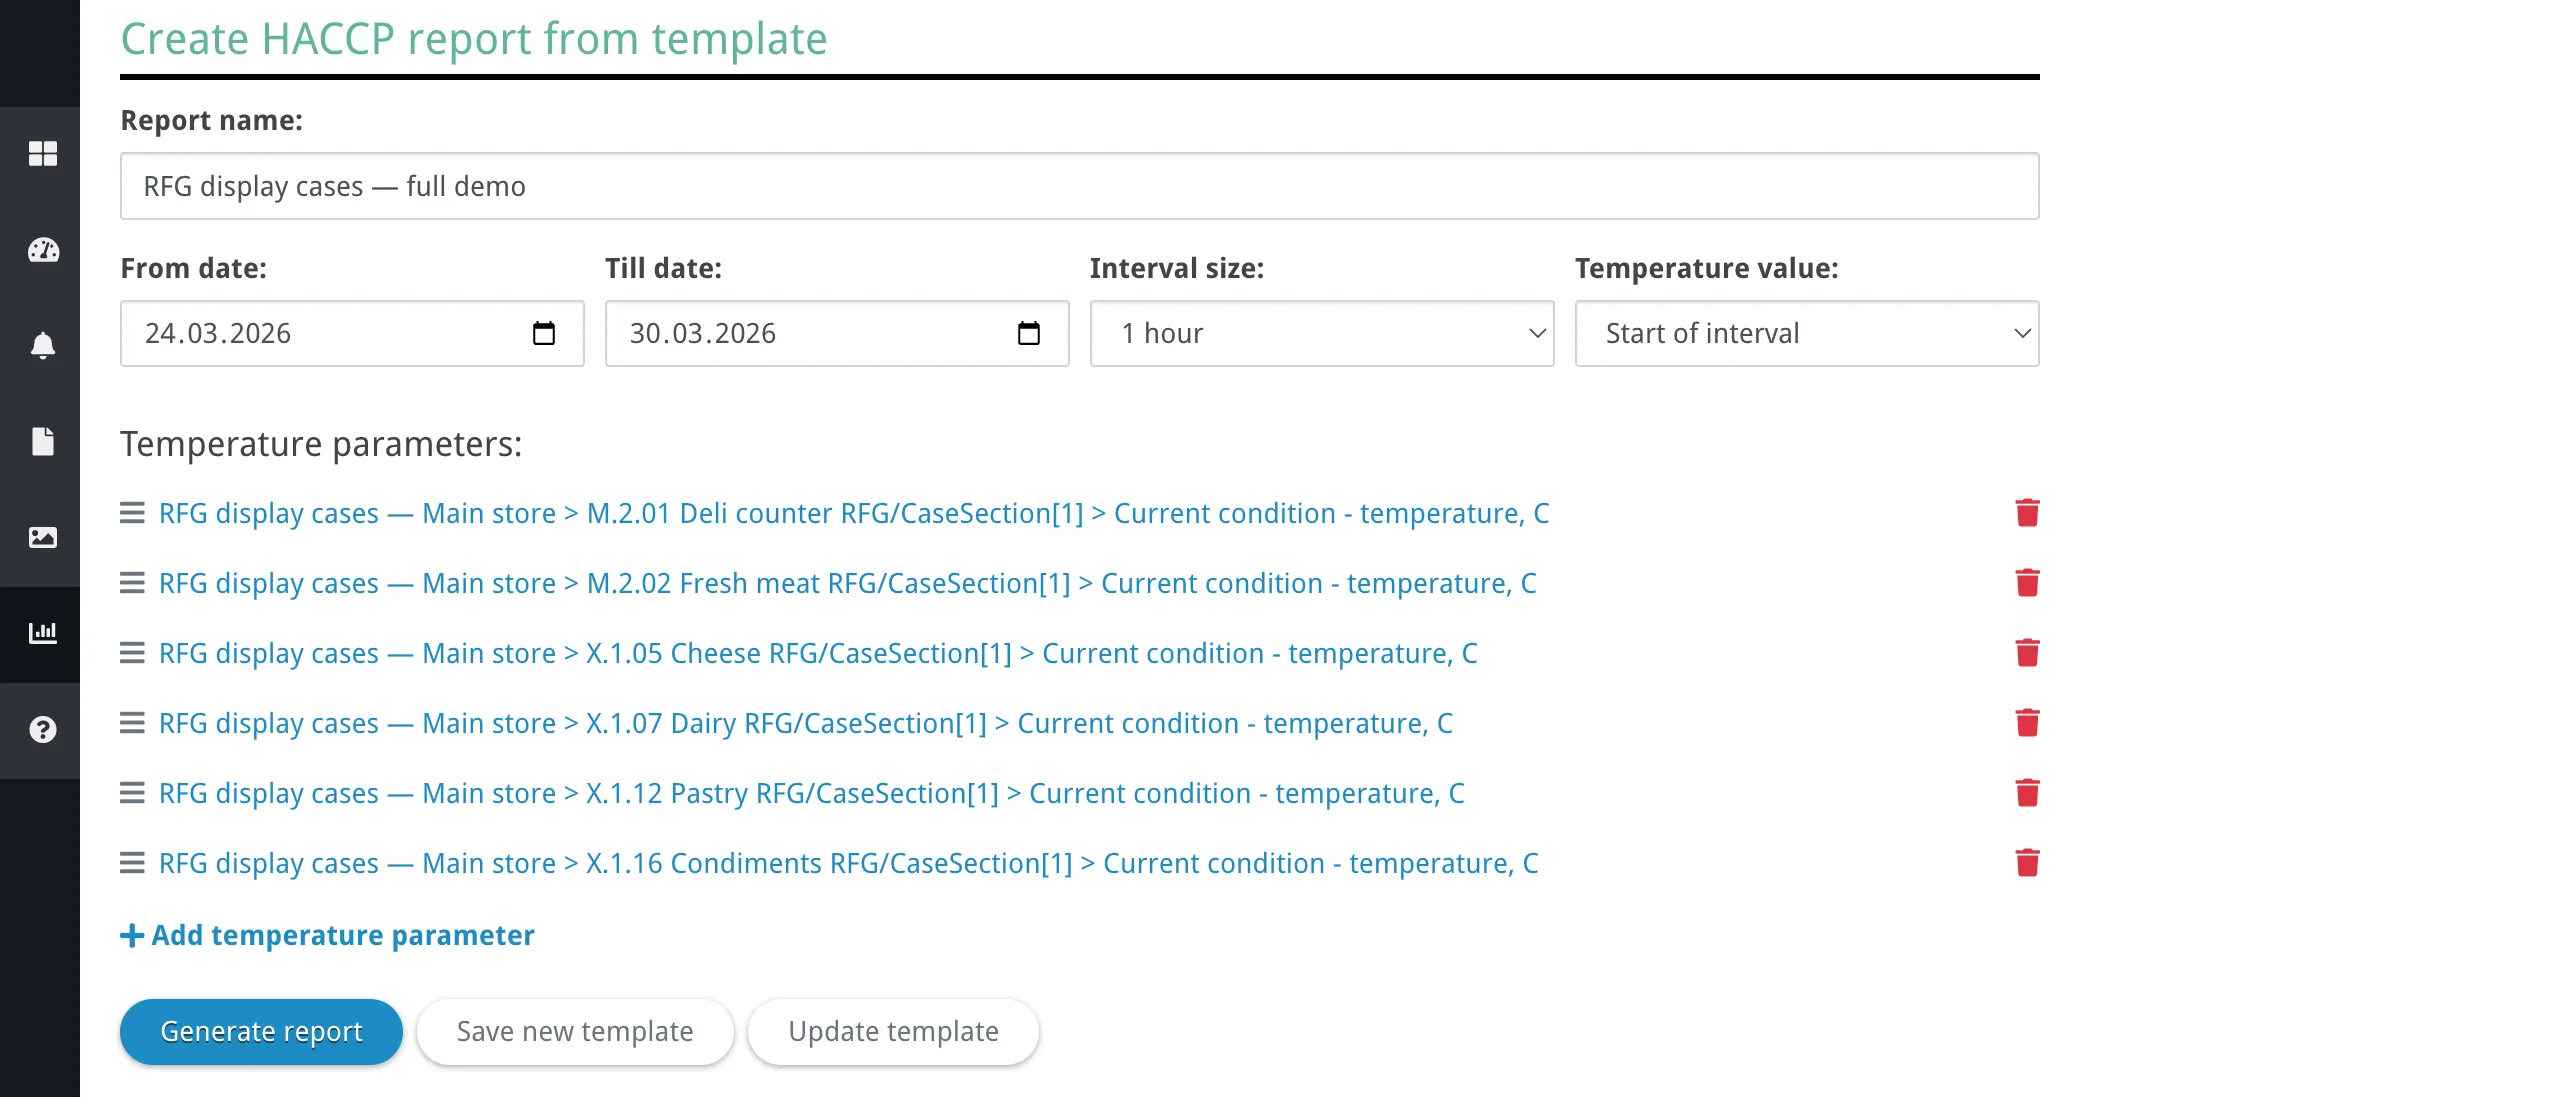
Section titled “Temperature Parameters”The temperature parameters list defines which control points are included in the report. Each entry represents one monitored temperature parameter along with its optional supporting parameters and thresholds.
You must configure at least one temperature parameter before the report can be generated. Up to 100 parameters can be included in a single report.
To add a parameter, click Add temperature parameter below the list. To edit an existing parameter, click its name in the list. To remove a parameter, click the trash icon on its row. To reorder parameters, drag using the handle on the left side of each row — the list previews the new position while dragging.
Parameter Configuration Dialog
Section titled “Parameter Configuration Dialog”The parameter configuration dialog opens when you add or edit a temperature parameter. It contains the following sections:
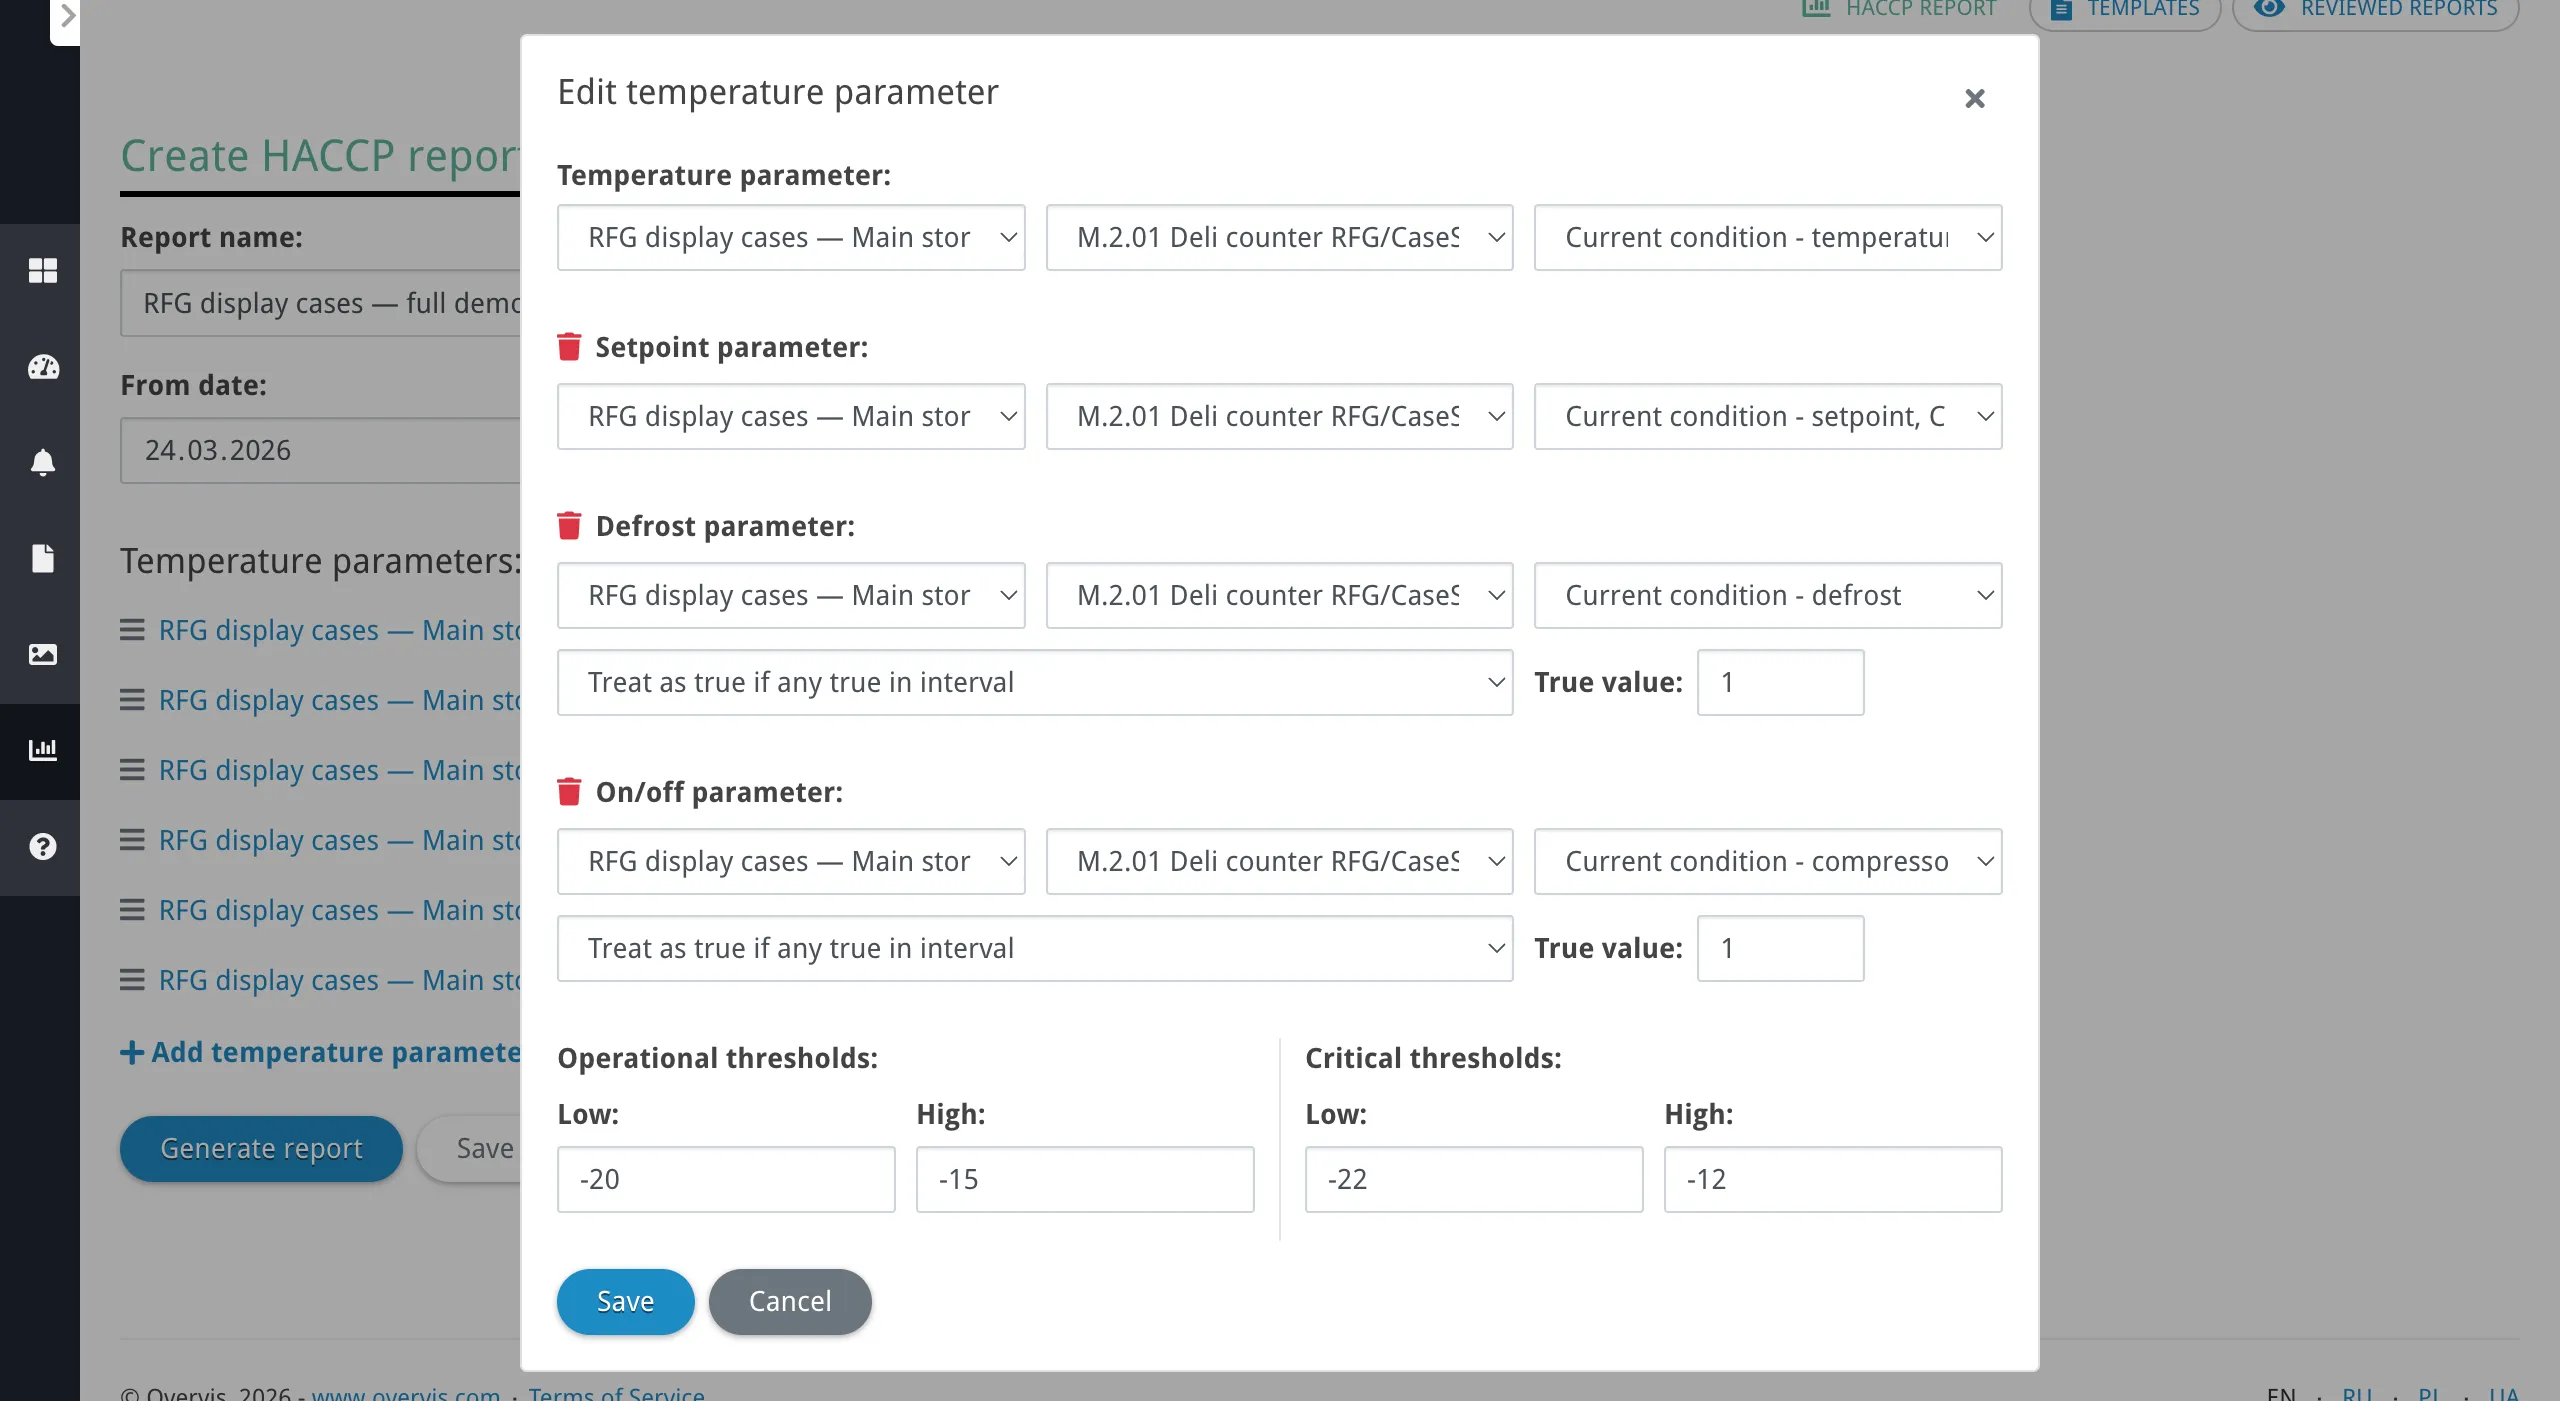
Temperature parameter (required) — the primary temperature reading for this control point. Select the network, then the device, then the specific parameter. Only tracked parameters are available for selection — these are device parameters that Overvis reads periodically in the background and stores in the database. If a parameter you need is not listed, make sure it is set up as tracked in the device configuration.
Setpoint parameter (optional) — a reference setpoint value used for deviation coloring in the report table. When configured, each cell is colored on a blue-to-white-to-orange gradient based on how far the temperature deviates from the setpoint. The deviation scale uses steps of 1°C per color level. The setpoint does not affect exception detection — it is used for visual indication only.
To add a setpoint, click Setpoint parameter to expand the section, then select the network, device, and parameter. To remove it, click the trash icon next to the section name.
Defrost parameter (optional) — indicates whether the equipment is in a defrost cycle. When defrost is active, the corresponding cells are highlighted with a yellow background in the report table. Defrost status is shown for informational context only — it does not create exceptions and does not suppress threshold violations.
On/off parameter (optional) — indicates whether the equipment is running. When the equipment is off, the corresponding cells are shown with a grey background. Equipment being off is informational and does not create exceptions on its own. However, threshold violations are still detected even when equipment is off. If the equipment is on (or its state is unknown) and the temperature reading is missing, this is flagged as an unknown status exception.
For both defrost and on/off parameters, two additional controls are available:
-
Evaluation mode — determines how the boolean state is derived from readings within a segment:
- Any true — the state is considered active if any reading in the segment matches the true value
- Any false — the state is considered active if any reading in the segment does not match the true value
- Use start-of-interval value — only the reading closest to the segment start is used (this is the same “closest to start” logic used by the Temperature value > Start of interval mode, applied here to the boolean parameter instead of the temperature parameter)
-
True value — the numeric value that represents the active state. Defaults to
1. All parameters are compared numerically regardless of how they may be displayed elsewhere in Overvis. For equipment where the active state is represented by0(inverse wiring), set the true value to0.
Thresholds
Section titled “Thresholds”Each temperature parameter can have up to four threshold values configured. Thresholds define the acceptable temperature ranges for a control point and drive exception detection in the generated report.
Operational thresholds define the normal operating range:
- Operational low — the lowest acceptable temperature during normal operation. Temperatures below this value trigger an operational deviation exception.
- Operational high — the highest acceptable temperature during normal operation. Temperatures above this value trigger an operational deviation exception.
Operational deviations indicate that the temperature has drifted outside the desired range but has not yet reached a safety-critical level. These typically require investigation and corrective action to prevent further drift.
Critical thresholds define the absolute safety limits:
- Critical low — the minimum safe temperature. Temperatures below this value trigger a critical limit breach exception.
- Critical high — the maximum safe temperature. Temperatures above this value trigger a critical limit breach exception.
Critical limit breaches indicate a direct food safety risk and require immediate corrective action and documentation.
Set critical thresholds based on the critical limits established in your HACCP plan. Operational thresholds should be set tighter than critical limits to provide early warning before a critical breach occurs — this gives your team time to take corrective action before food safety is compromised.
All threshold values are optional. When a threshold is not configured, the corresponding exception type is not checked for that parameter. Within each pair (operational or critical), the low value must not exceed the high value.
Threshold violations are detected based on the computed segment value (as determined by the Temperature value setting), not from raw individual readings within the segment. If a critical threshold is violated, it takes precedence over an operational threshold violation for the same segment.
Generated Report
Section titled “Generated Report”After clicking Generate report, the report appears below the builder. It consists of three areas: a header block (with legend, exception totals, and review form), an exception summary table, and a detailed table that loads on demand.
Header and Legend
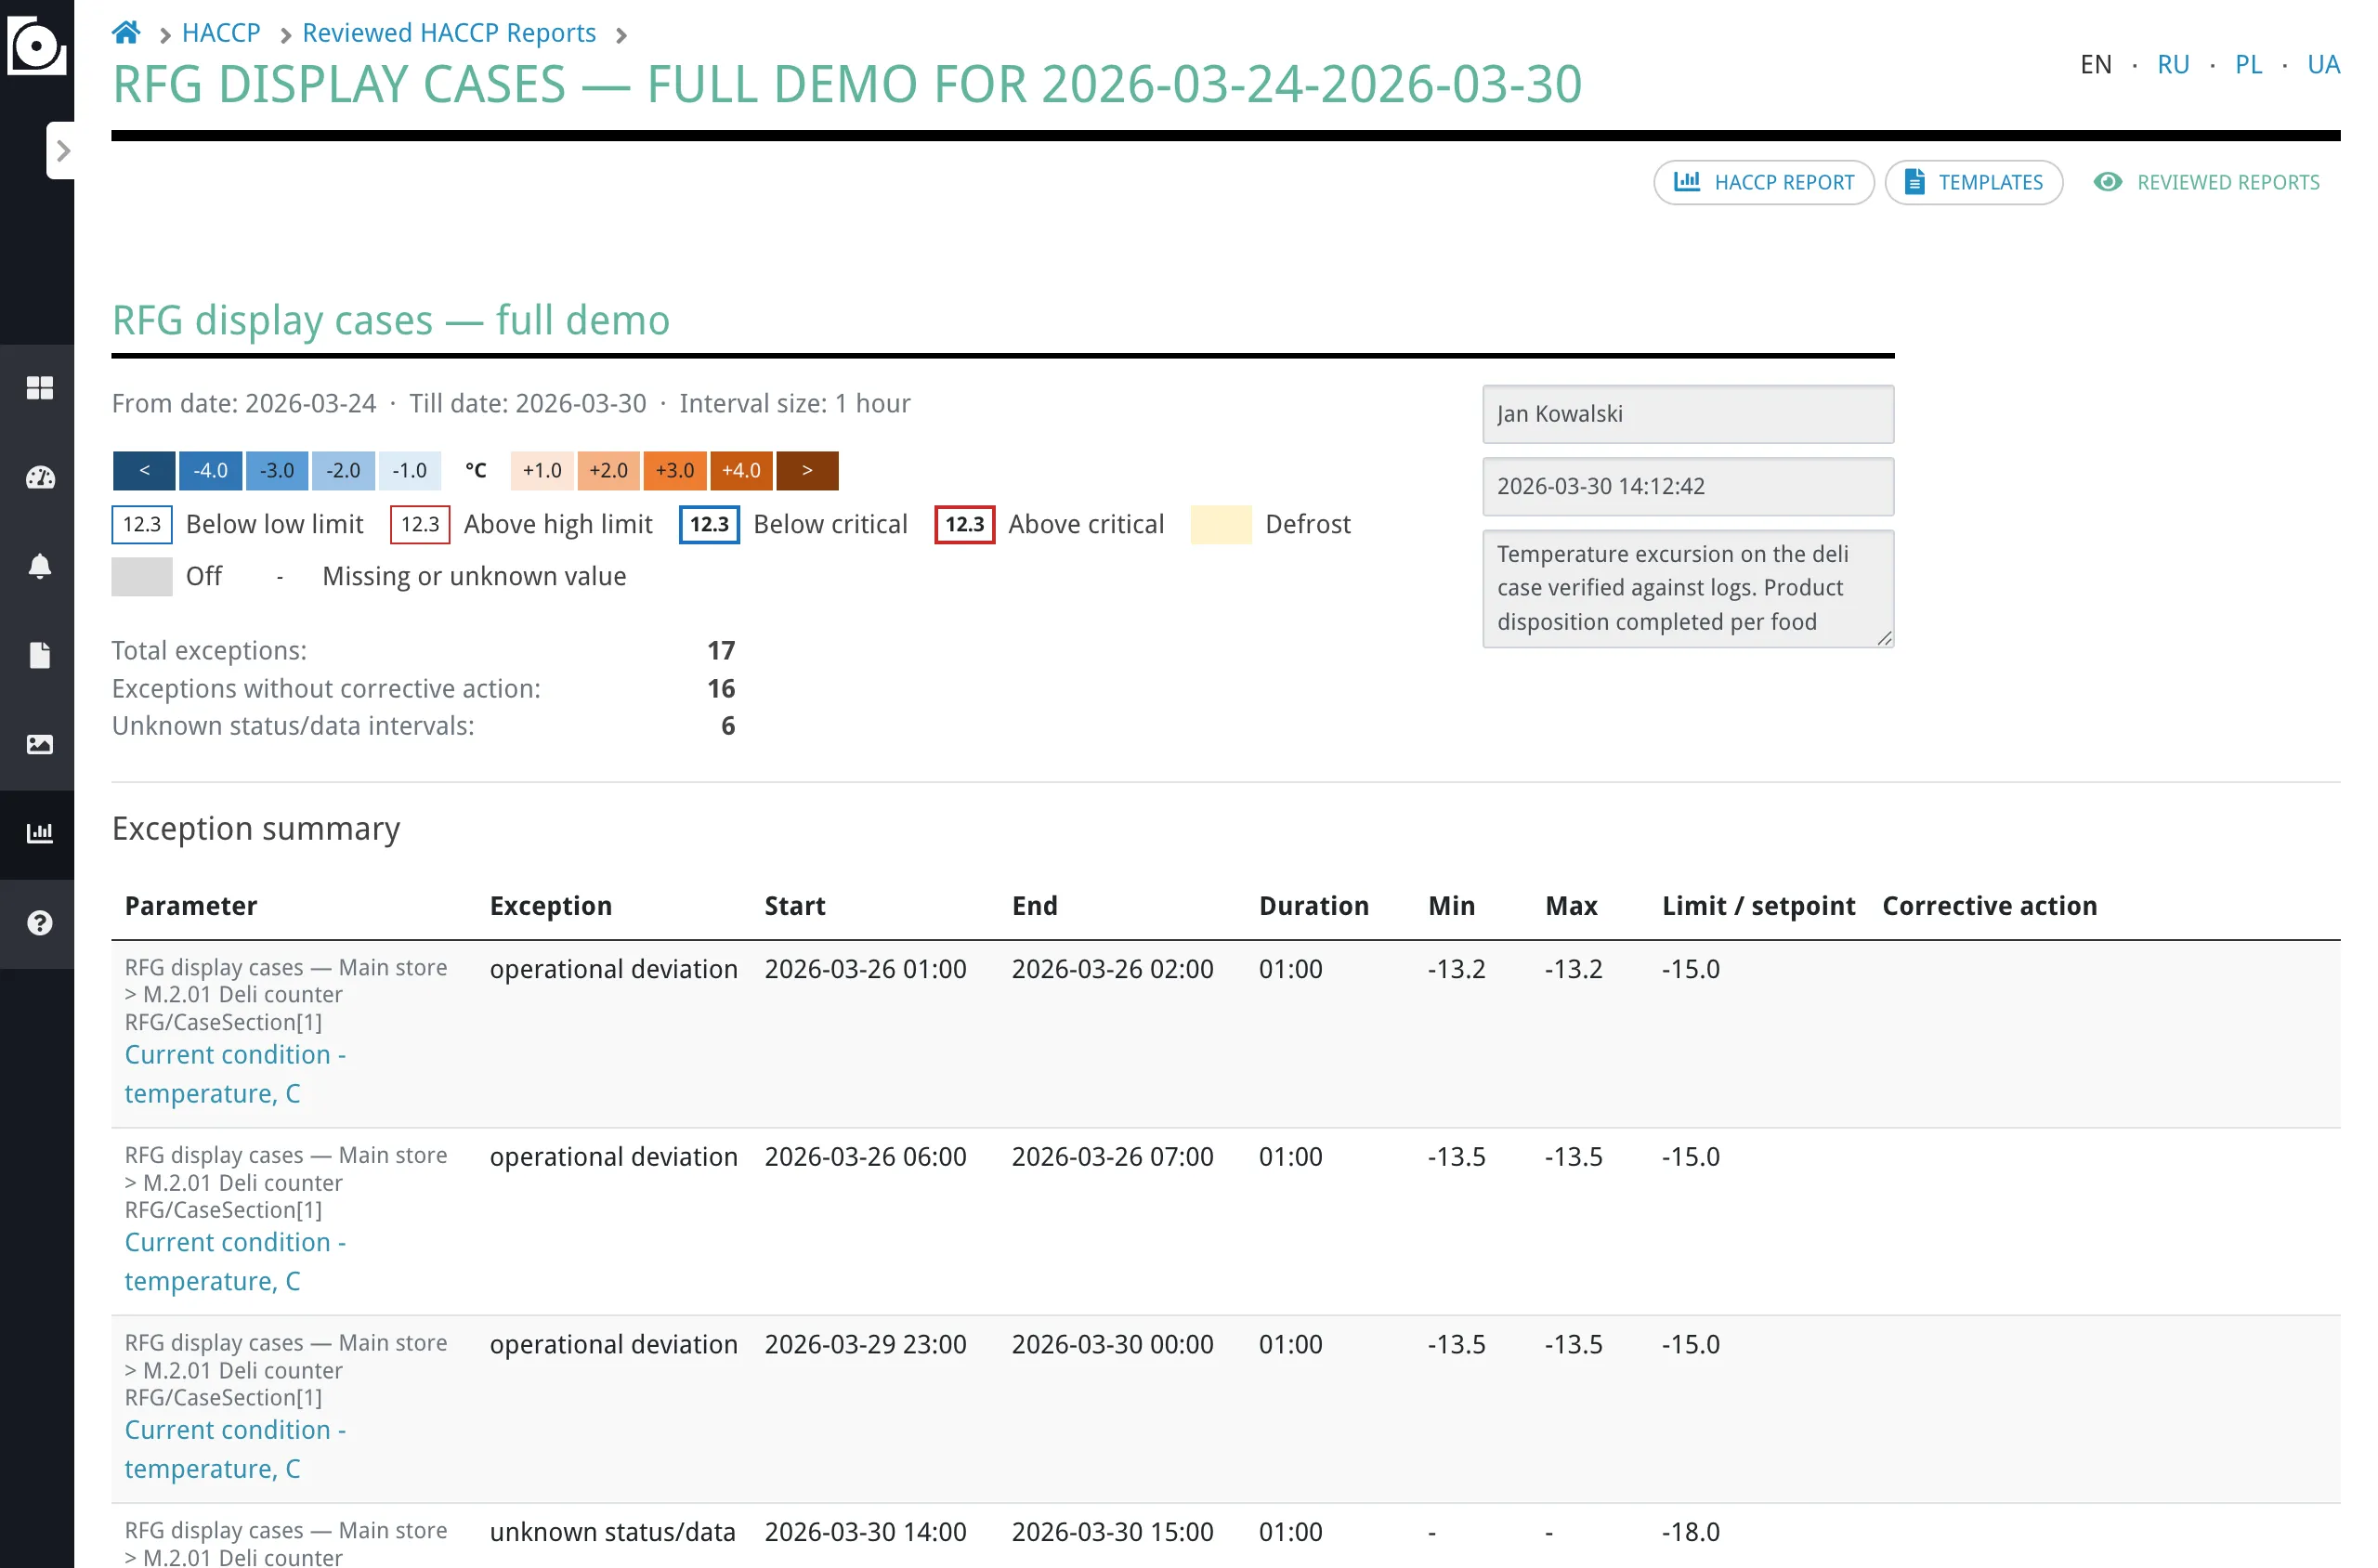
Section titled “Header and Legend”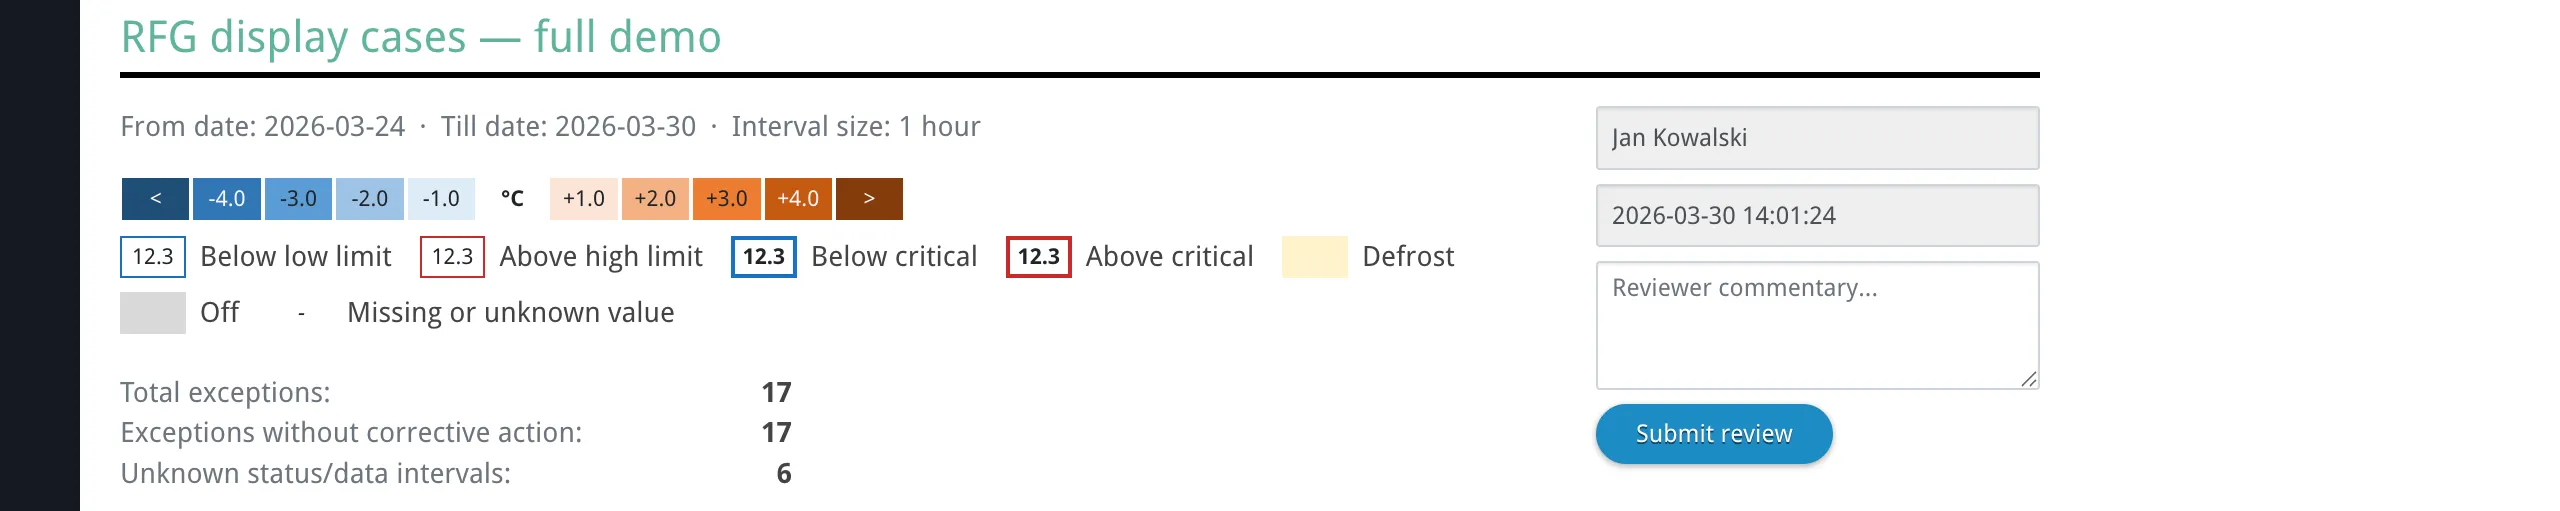
The header displays the report name, selected date range, and interval size. Next to the metadata, a color legend shows the meaning of all visual styles used in the report:
- Deviation gradient — an 11-step blue-to-white-to-orange scale showing how far the temperature deviates from the setpoint. Each step represents 1°C. Blue indicates below setpoint, orange indicates above setpoint, white indicates close to setpoint.
- Operational threshold breach — a thin inset border in blue (below the operational low limit) or red (above the operational high limit), without bold text. Thickness distinguishes this from a critical breach at the same side (same colors).
- Critical threshold breach — a thicker inset border in the same blue or red, plus bold text. Critical uses a heavier outline than operational so the two are easy to tell apart without changing hue.
- Defrost — yellow background indicates the equipment is in a defrost cycle.
- Off — grey background indicates the equipment is turned off.
- Missing or unknown value — italic text (often with a
-in the cell) indicates a missing temperature or unknown/inferred context; see tooltips for detail.
Below the legend, exception totals are shown:
- Total exceptions — the total number of detected exception intervals across all parameters.
- Exceptions without corrective action — how many exception intervals do not yet have a corrective action note attached.
- Unknown status/data intervals — the number of intervals where data was missing or equipment status was unknown.
Exception Summary
Section titled “Exception Summary”The exception summary table is the primary HACCP review surface. It lists every detected exception interval across all configured parameters, sorted by parameter and time.
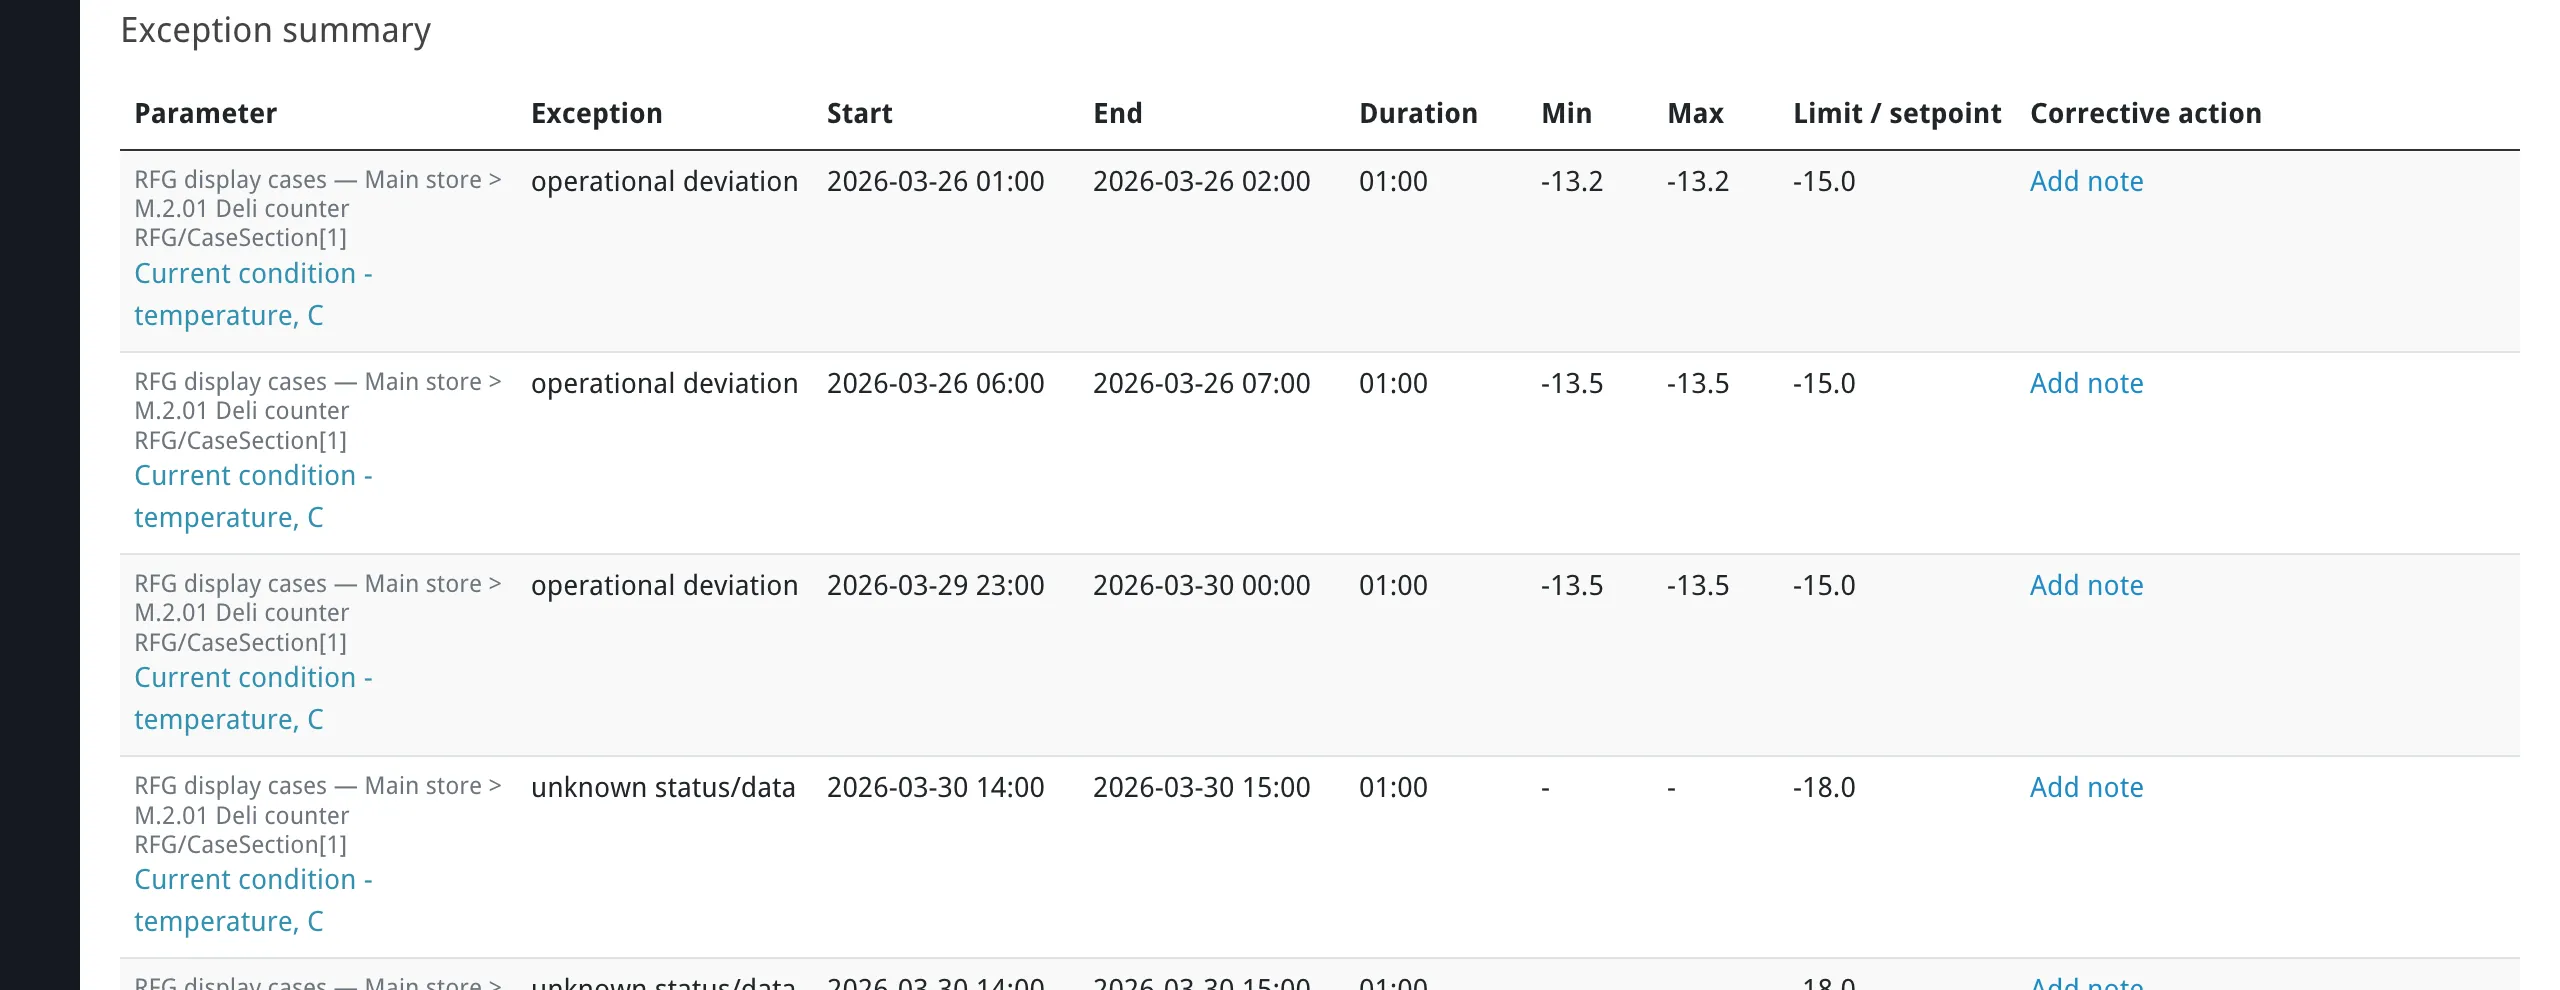
Each row shows:
- Parameter — the temperature parameter name, with network and device shown above it for context.
- Exception — one of the three exception types (see below); the live table uses the short header Exception.
- Start / End — the local date and time when the exception interval began and ended.
- Duration — how long the exception lasted.
- Min / Max — the minimum and maximum computed segment values across all segments in the exception interval. These reflect the selected Temperature value mode (Start of interval, average, minimum, or maximum), not raw individual readings.
- Limit / Setpoint — the threshold value or setpoint that was violated.
- Corrective action — whether a corrective action note has been added for this exception.
Exception Types
Section titled “Exception Types”The report detects three types of exceptions. When multiple exception conditions apply to the same time segment, the highest-priority type takes precedence.
Critical limit breach (highest priority) — the computed temperature value for a segment is below the configured critical low threshold or above the configured critical high threshold. This represents a direct food safety hazard that requires immediate corrective action and documentation. In the detailed table, critical breaches are shown with bold text and a thicker colored inset border (blue for low, red for high).
Operational deviation (medium priority) — the computed temperature value is outside the operational threshold range but has not reached a critical limit. This indicates the system is drifting from its target operating conditions and may require adjustment to prevent a critical breach. Operational deviations use the same blue/red inset colors as critical on that side, but a thinner border and no bold text.
Unknown status/data (lowest priority) — temperature data is missing or an equipment status parameter has an unknown state. This can occur when:
- The temperature reading is missing and equipment is confirmed to be on
- The temperature reading is missing and no on/off parameter is configured
- The temperature reading is missing and the on/off state itself is unknown
- A configured defrost or on/off parameter has no readings in the segment
This exception type covers two distinct situations under one label: missing temperature readings (a monitoring failure) and unresolved equipment states (an equipment status question). Both appear as “unknown status/data” in the exception summary, but the detailed reason is shown in the tooltip or cell annotation. If the equipment is confirmed to be off and the temperature reading is missing, this is not flagged as an unknown status exception.
How exception intervals are formed: the report examines each time segment independently, classifies it according to the rules above, and then merges consecutive segments of the same exception type into continuous intervals. When the exception type changes between adjacent segments, a new interval begins. For example, two hours of operational deviation containing a 20-minute critical breach in the middle produces three separate intervals: operational deviation, critical limit breach, and operational deviation.
Important: defrost and off states are informational only — they do not create exceptions on their own and do not suppress threshold violations. If a critical or operational threshold is violated during a defrost cycle or while equipment is off, the exception is still detected and reported. In the detailed table, threshold violation indicators (borders and bold text) are overlaid on top of the defrost or off background color, so both states remain visible simultaneously (see Cell visual styling).
Corrective Action Notes
Section titled “Corrective Action Notes”You can attach corrective action notes to any exception interval in the summary. Notes serve as documentation of what action was taken in response to a detected exception.
To add a note, click the corrective action cell for the relevant exception row. Each note records the text you enter, your display name, and the timestamp when it was created. You can edit or delete notes freely while working on the generated report.
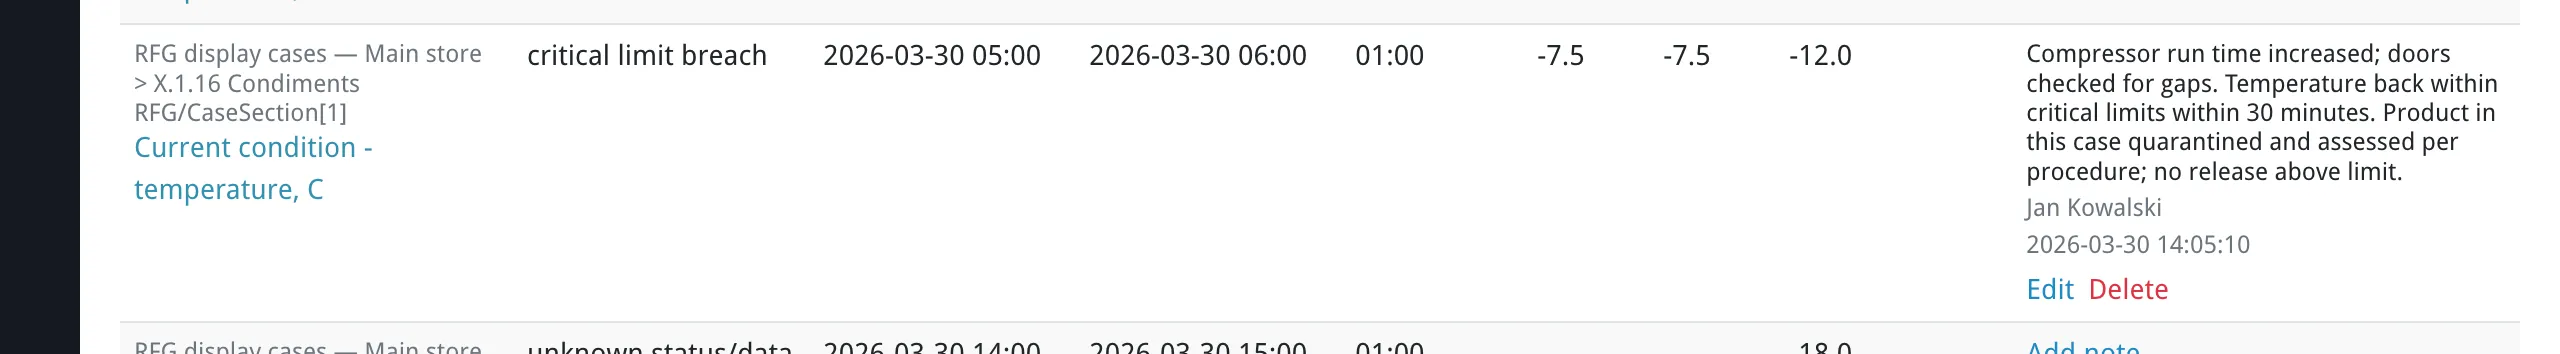
Once the report is submitted for review, all corrective action notes become part of the immutable reviewed snapshot and can no longer be modified.
Detailed Table
Section titled “Detailed Table”The detailed table shows the full time-segment matrix for all configured parameters. It is hidden by default and is not loaded until you explicitly expand it by clicking Show detailed table. This keeps the initial report generation fast, since the detailed table can be large.
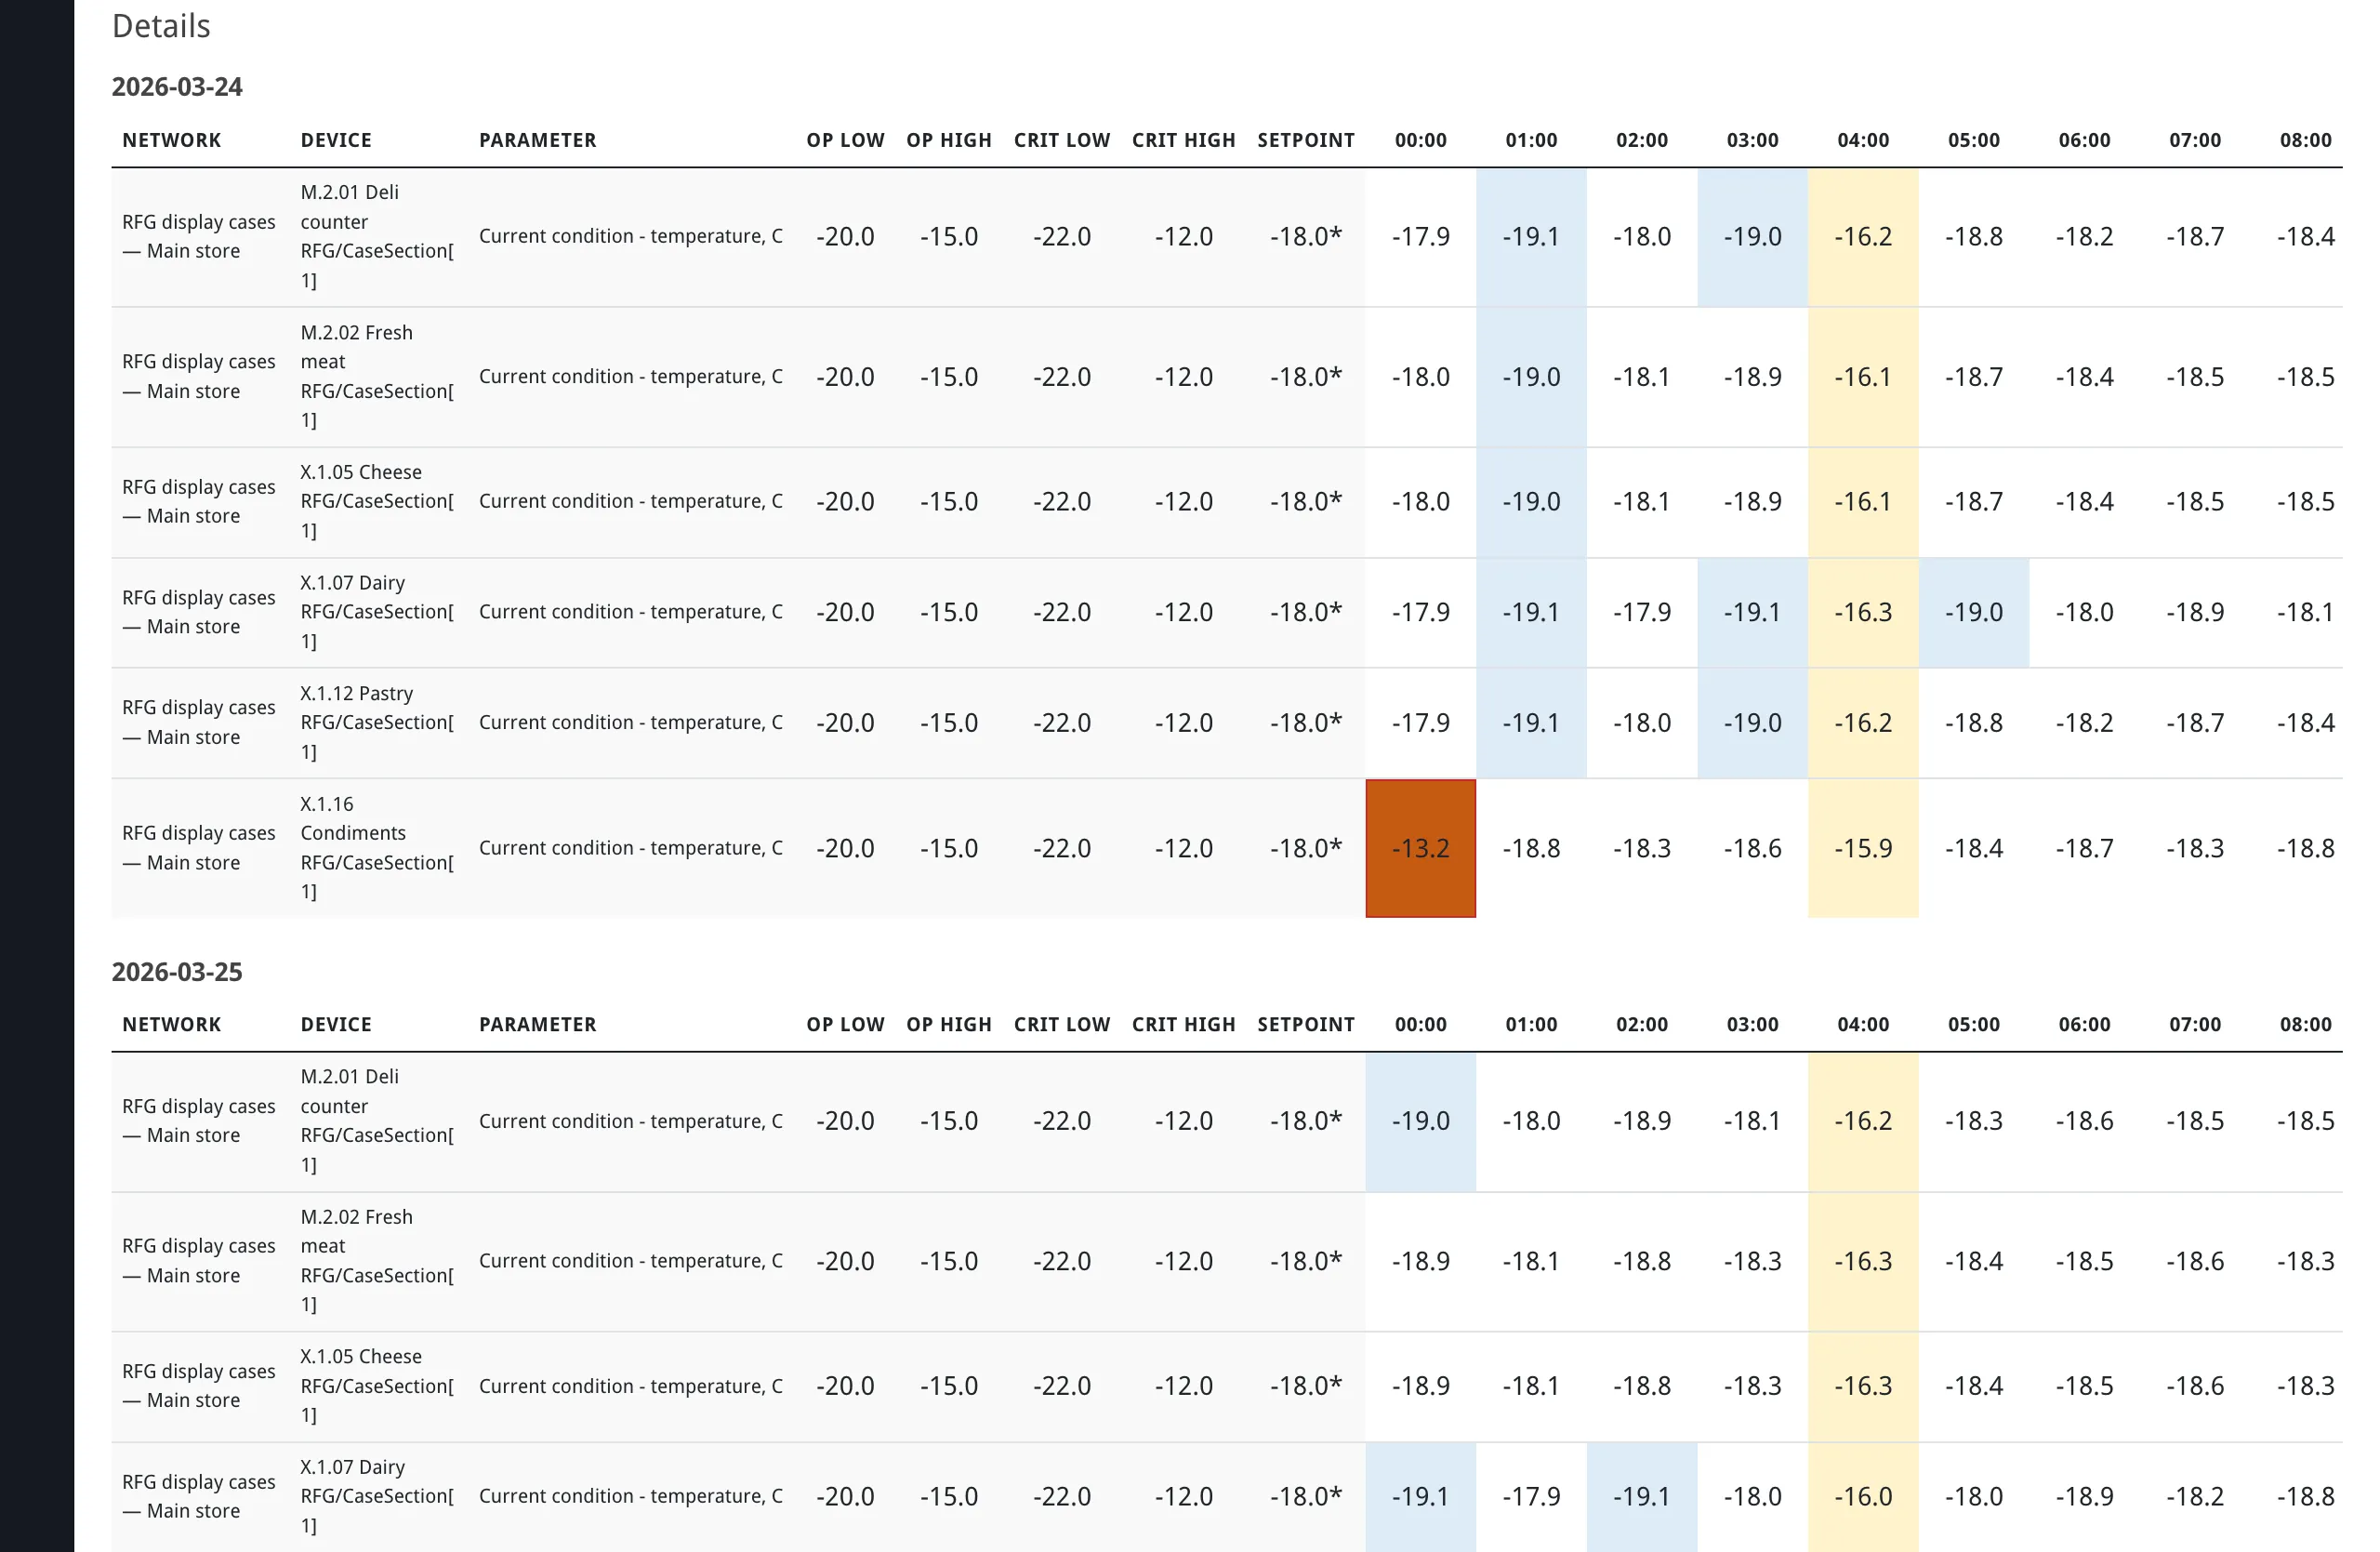
Each row in the table represents one configured temperature parameter (identified by network, device, and parameter name). Columns are organized by day, with each day containing:
- Setpoint — the setpoint value at the start of the day. If the setpoint changes during the day, a
*marker appears next to the day-start value. A-is shown when no setpoint reading exists for that day. - Segment columns — one column per time segment in the day. Each cell shows the computed temperature value (or
-for missing data) with visual styling that conveys the segment’s status at a glance. - Daily status — a rollup of the worst condition observed during the day, using the following precedence: critical breach > operational deviation > no data > unknown values > OK.
Cell visual styling uses the following precedence (highest priority first):
- Off (grey background) — equipment is off in this segment.
- Defrost (yellow background) — equipment is in defrost cycle.
- Deviation coloring (blue-to-orange gradient) — temperature deviation from the setpoint, when a setpoint is available. Each color step represents 1°C of deviation.
- White background — no setpoint configured, or temperature is at the setpoint.
Threshold violations are overlaid on top of the background color:
- Operational threshold breach: thin inset border — blue when below the operational low limit, red when above the operational high limit.
- Critical threshold breach: thicker inset border in the same blue or red, plus bold text.
Missing or unknown values are shown in italic text with a - value.
At the bottom of each day column group, a footer row shows summary counts: total segments, segments with operational deviations, segments with critical breaches, and segments with unknown values.
Excel Export
Section titled “Excel Export”You can export the report to an Excel file (.xlsx) at any point after generation. From a generated report, click Export to Excel. From a reviewed report detail page, use Export to Excel or Export reviewed report (labels may differ slightly by view; both produce a workbook from the current context). When exporting a generated report, the data reflects the readings captured at generation time. When exporting a reviewed report, the data comes from the stored immutable snapshot.
The exported workbook contains two sheets:
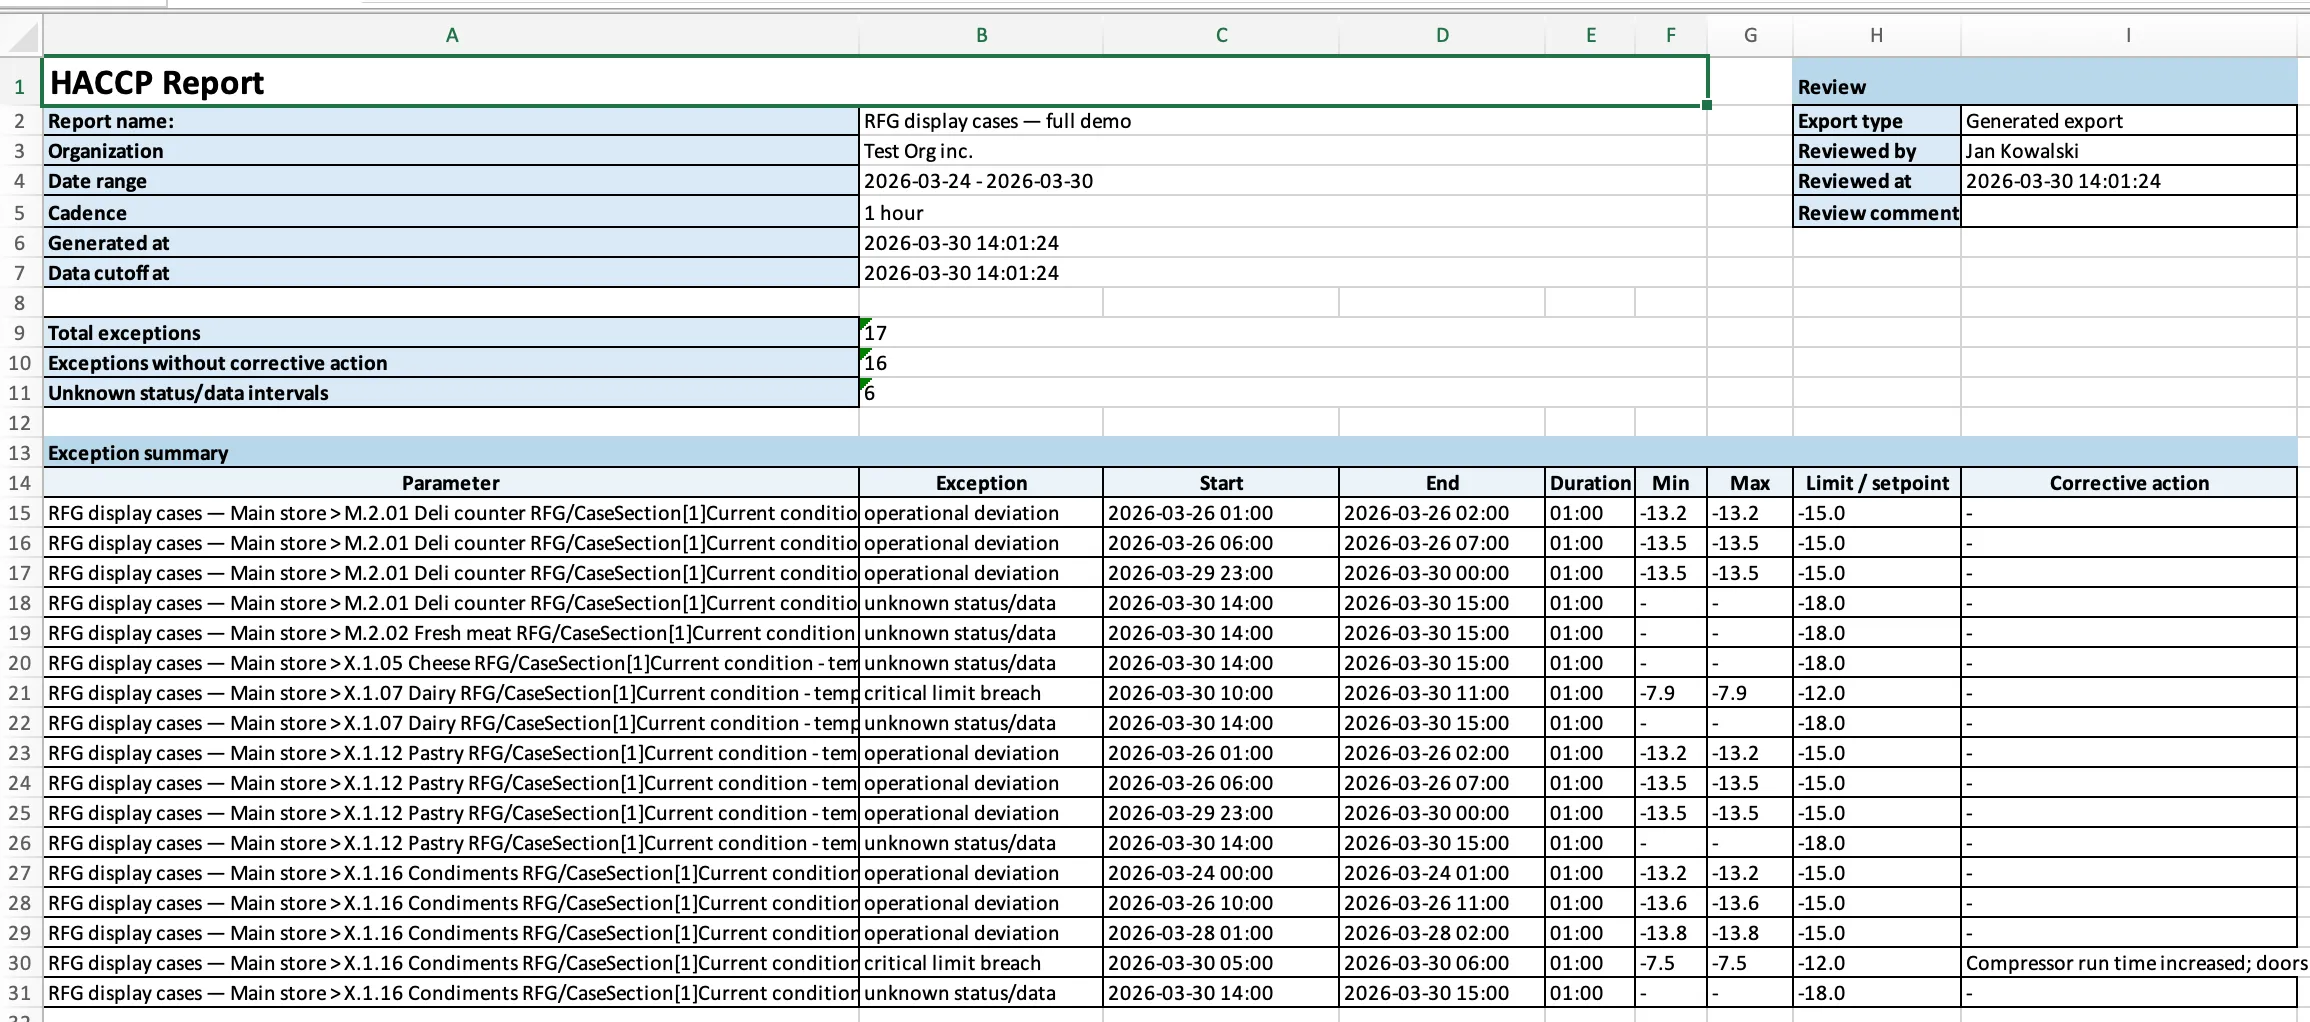
Sheet 1 — “HACCP Report” contains:
- Report header: report name, organization, date range, interval size, and generation timestamp.
- Review metadata: export type (generated or reviewed), reviewer name, review date, and review comments.
- Exception totals: total exceptions, exceptions without corrective action, and unknown status/data intervals.
- Exception summary table: the same information as the browser exception summary — parameter, Exception (exception type; the table header is the short label Exception), start/end times, duration, min/max temperatures, relevant limit or setpoint, and corrective action notes. Notes are included in the export regardless of whether the report has been submitted for review.
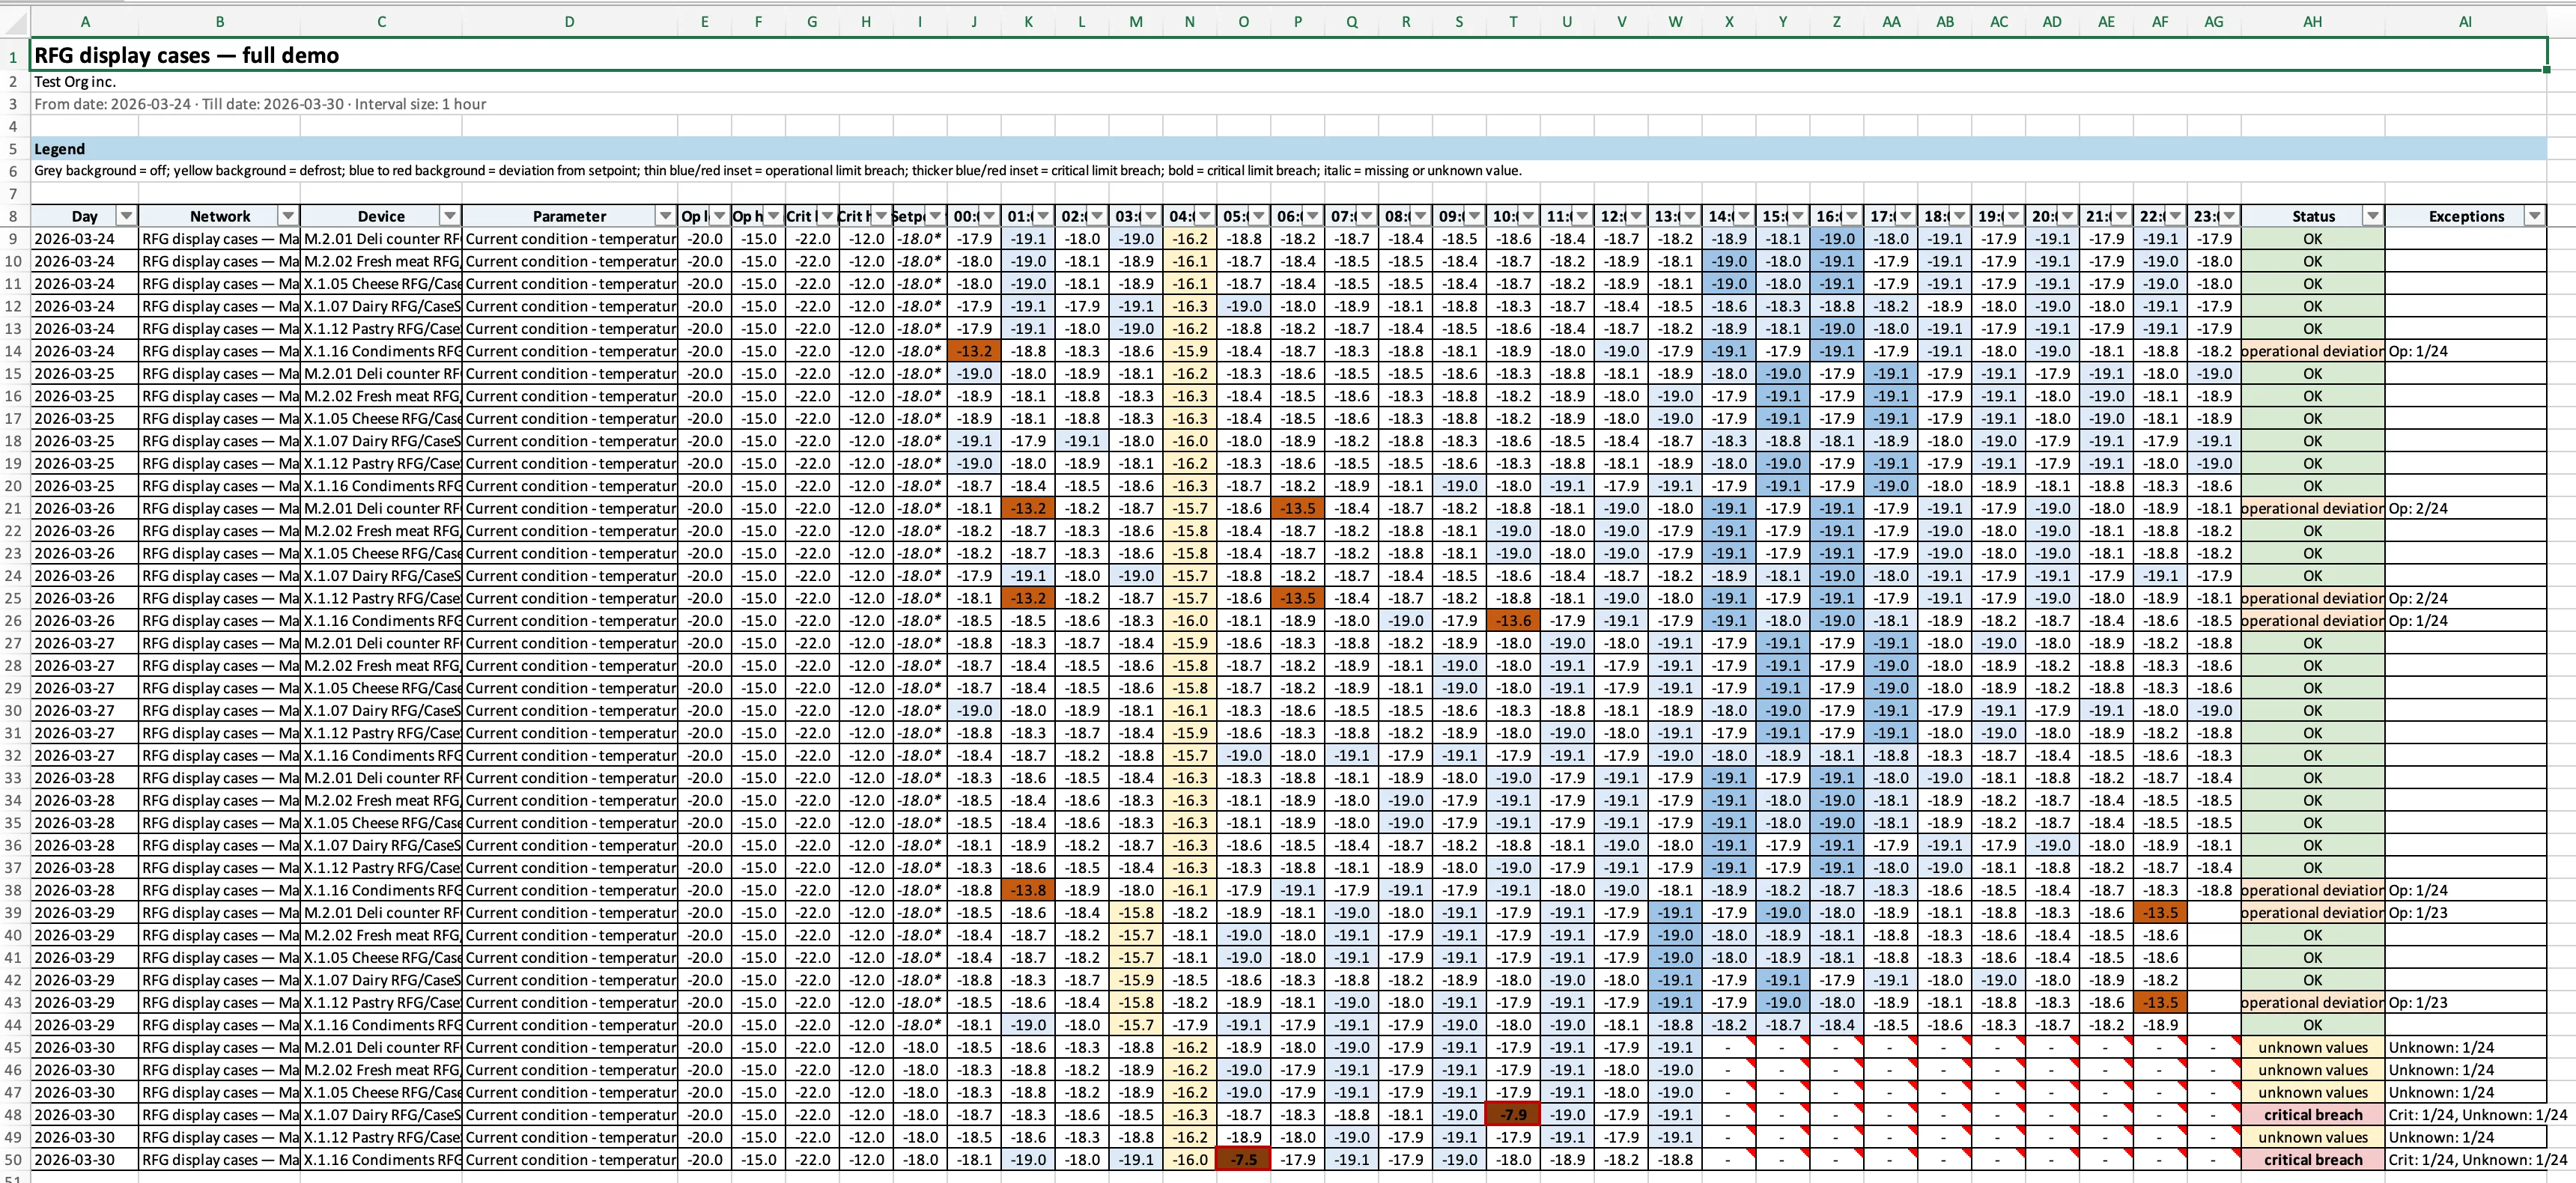
Sheet 2 — “Details” contains:
- Color legend: a reference key explaining cell colors, border weights (thinner for operational limit breaches, thicker for critical), and text styles, consistent with the browser table.
- Full segment matrix: the same detailed table shown in the browser — one row per parameter, one column per time segment, grouped by day. Includes setpoint columns, daily status rollups, and day footer counts.
- Cell notes: where the browser shows tooltips for unknown or inferred values, the Excel file places the same explanations as cell comments.
The workbook is formatted for printing with landscape A4 page layout, header rows repeated on every printed page, and a page footer showing page numbers and “Generated by Overvis (www.overvis.com)”.
Report Templates
Section titled “Report Templates”Templates save a report configuration for reuse, so you can quickly generate reports for new date ranges without reconfiguring parameters and thresholds each time. Templates are organization-level — all users in the organization can see and use them.
A template stores:
- Report name
- Configured temperature parameters (with all optional parameters and thresholds)
- Interval size (cadence)
- Temperature value display mode
A template does not store the date range, generated report data, corrective action notes, or review metadata. When you load a template, the date range defaults to the last 7 days.
Saving a template. After configuring the builder on the main HACCP report page, click Save template. The template is saved with the current report name and configuration. You are redirected to the template detail page. (When the builder is already opened in a template context, the control may read Save new template — see below.)
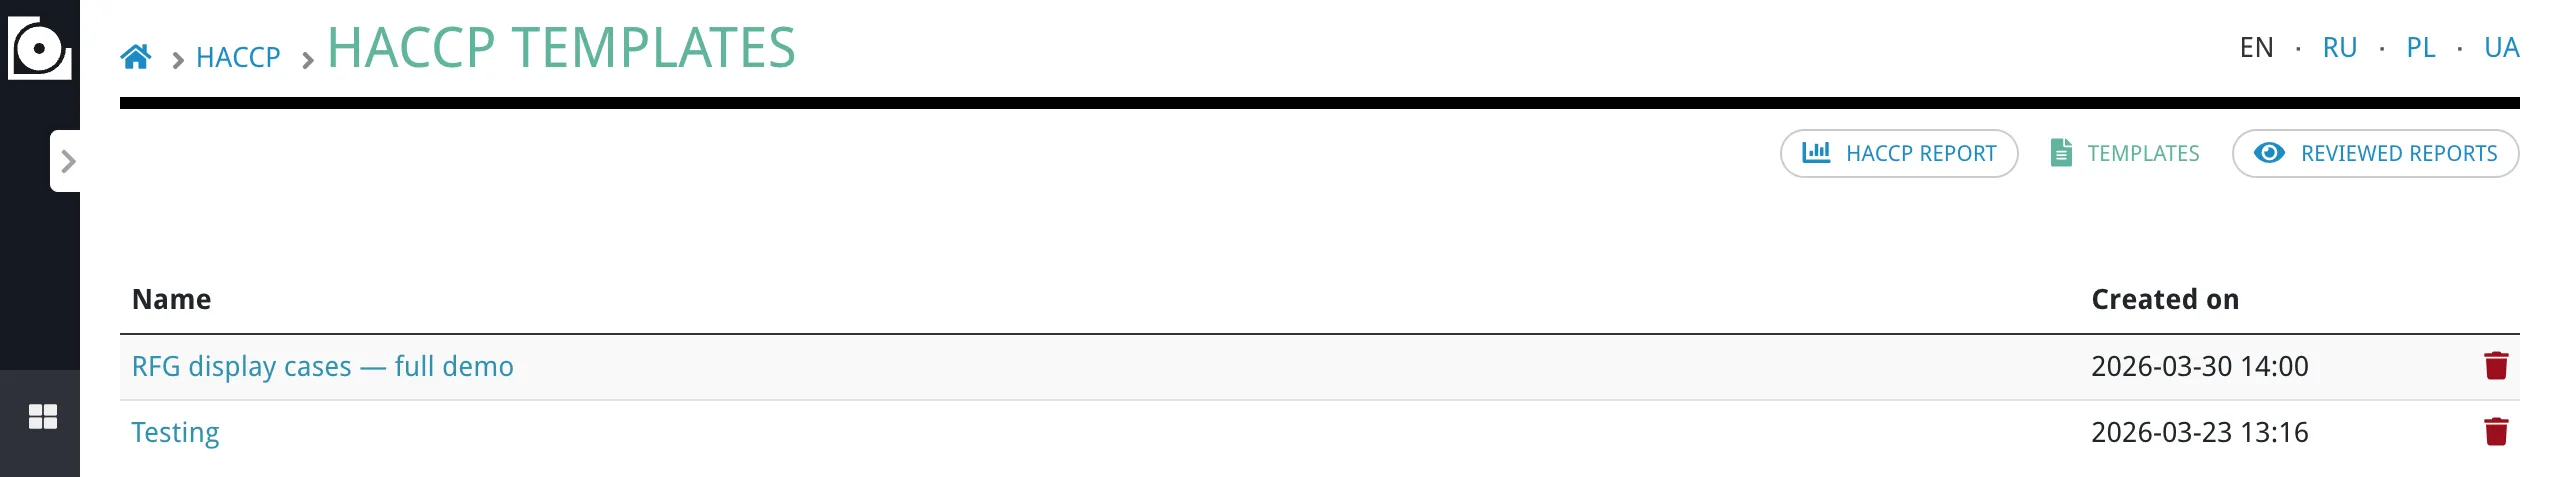
Loading a template. Open the Templates tab to see the list of saved templates. Click a template name to open the builder with the template’s configuration prefilled. From there, adjust the date range if needed and click Generate report.
Updating a template. When viewing a template’s builder page, modify the settings as needed and click Update template to save the changes. You can also click Save new template to create a separate template with the modified configuration.
Deleting a template. In the template list, click the trash icon next to a template. A confirmation page appears before the template is permanently deleted.
The template list shows each template’s name (as a clickable link) and creation date. Saving, updating, and deleting templates requires edit permissions on the organization.
Report Review
Section titled “Report Review”After generating a report and documenting any corrective actions, an authorized user can submit the report for review. This creates a permanent, immutable record of the report.
The review form appears in the header area of the generated report and contains:
- Reviewed by — automatically set to the submitting user’s name. Not editable.
- Reviewed at — automatically set to the current date and time. Not editable.
- Review comments — free-text field for the reviewer’s commentary. Editable before submission.
Click Submit review to finalize the report. The system captures a complete snapshot of all readings, exception intervals, and corrective action notes as they existed at generation time. After submission, you are redirected to the reviewed report detail page.
Submitting a review requires edit permissions on the organization. The review cannot be undone — once submitted, the snapshot and all its contents are permanent.
Reviewed Reports
Section titled “Reviewed Reports”The Reviewed Reports tab shows all submitted report snapshots for the organization. The list displays:
- Report name (clickable link to the detail page)
- Date range
- Reviewed by
- Reviewed at
- Review comments
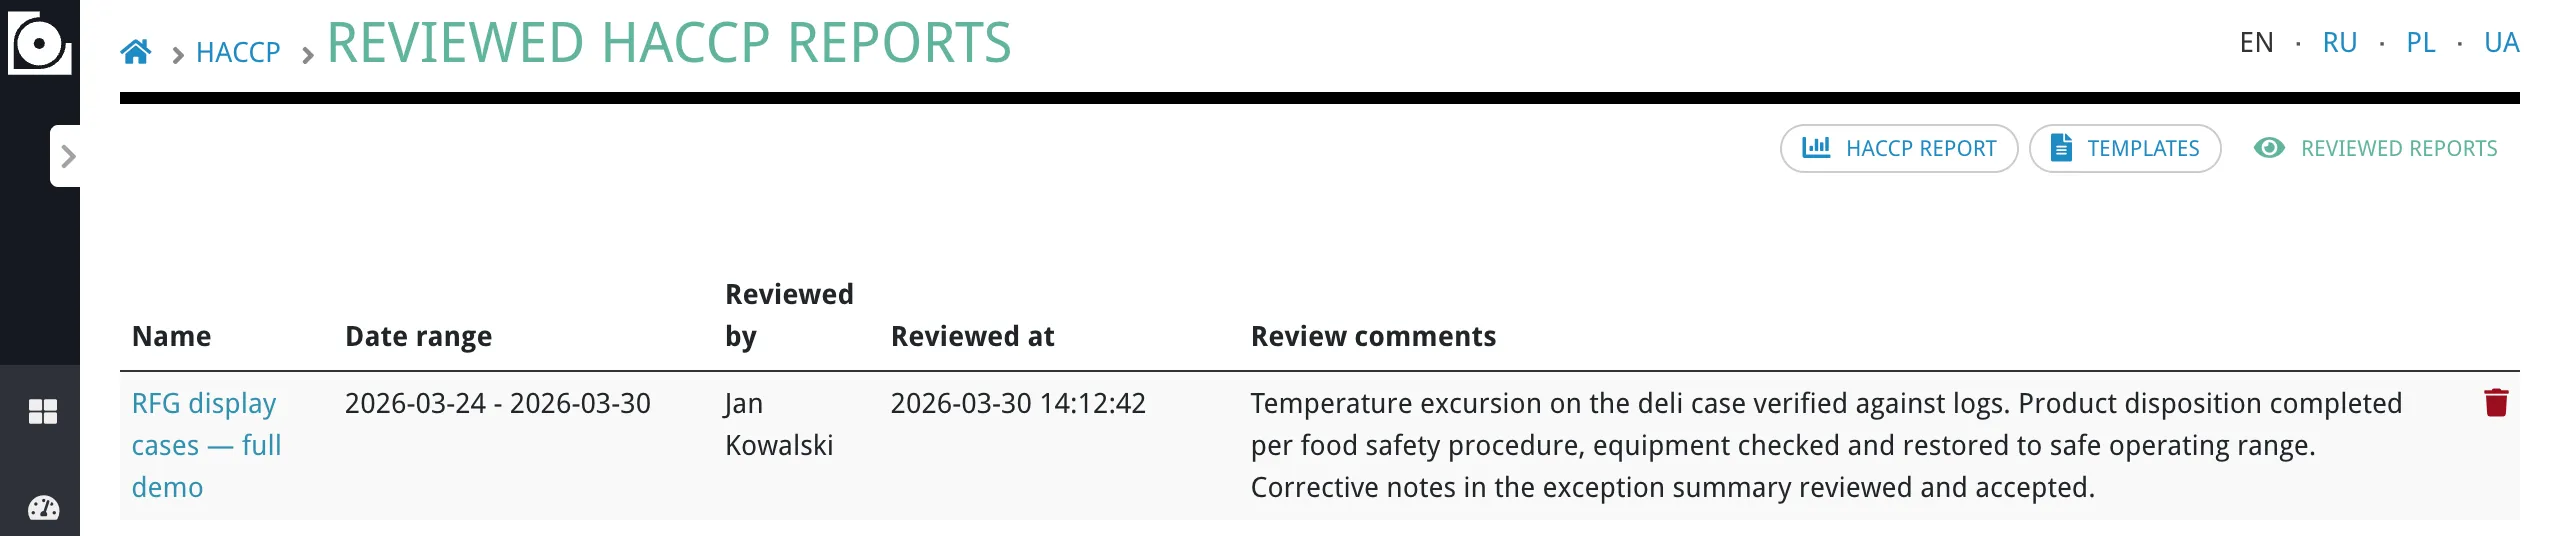
Click a report name to open the detail page. The detail page shows the same report view as a generated report — header, legend, exception summary with corrective action notes, and an expandable detailed table — but in read-only mode. The builder form is not shown on this page. All data comes from the stored snapshot, not from live readings.
Reviewed reports are stored indefinitely. You can export a reviewed report to Excel from its detail page. The exported file uses the stored snapshot data, ensuring the export always matches exactly what was reviewed.
Organization owners can delete a reviewed report by clicking the delete action in the list. Deleting removes the report from the list and makes its detail page inaccessible. If a deleted report needs to be restored (for example, during an audit), contact Overvis support at support@overvis.com.
Frequently Asked Questions
Section titled “Frequently Asked Questions”My temperature parameter is not listed in the dialog. What should I do?
Only tracked parameters appear in the selection lists. Make sure the parameter is configured as tracked in the device settings. Once it is tracked, Overvis will begin reading and storing its values, and it will appear in the HACCP parameter selection dialog.
Equipment exceeds thresholds during defrost cycles. How do I handle this?
Defrost cycles do not suppress threshold exception detection. If your equipment routinely exceeds thresholds during defrost, the report will show these as exceptions each time. You can document them with a standard corrective action note explaining that the deviation occurred during a planned defrost cycle. If defrost-related exceptions are expected and do not represent a food safety risk, consider adjusting the threshold values to account for normal defrost behavior, or leave the thresholds unconfigured for parameters where defrost spikes are routine.
I submitted a reviewed report with incorrect information. Can I fix it?
Reviewed reports are immutable and cannot be edited after submission. To correct the record, generate a new report for the same date range with the correct settings, add appropriate corrective action notes, and submit it for review. Organization owners can delete the incorrect reviewed report from the list.
What happens if there is only one reading in a segment?
All temperature value modes (Start of interval, average, minimum, maximum) return the same value when only one reading exists in the segment. The mode only affects the result when multiple readings fall within the same segment.
How does daylight saving time affect the report?
The report uses the organization’s configured timezone and handles DST transitions correctly. On days when clocks change, the number of segments may differ from other days — a 23-hour day will have fewer segments and a 25-hour day will have more. Segment boundaries always align to local clock time.
Can I schedule automatic report generation?
No. HACCP reports are generated on demand. You can save a template to speed up repeated configuration, but you must manually set the date range and click Generate report each time.
How often should I generate reports?
This depends on your HACCP plan requirements. Some facilities generate daily reports, others weekly. Use the date range and template features to match your review schedule.
What if my device goes offline for an extended period?
Missing readings are flagged as “unknown status/data” exceptions in the report. The exception summary will show the exact time intervals with missing data so you can investigate the cause and document corrective actions. If the equipment was intentionally turned off, configure the on/off parameter to avoid false alerts.
Can multiple users work on corrective actions for the same report simultaneously?
No. The generated report exists only in the browser of the user who generated it. Each user must generate their own instance of the report. Only one user can submit the report for review.
What is the maximum date range I can report on?
There is no fixed limit on the date range. The system enforces a total dataset size limit based on the combination of date range, interval size, and number of configured parameters. If the report would be too large, you will see an error message when attempting to generate. In that case, reduce the date range, use a longer interval, or split the report into multiple smaller reports.
Can I attach supporting documents (photos, calibration certificates) to the report?
Attachments are not supported directly in the HACCP report. If you need to include supporting documents, export the report to Excel and combine it with your attachments in your document management system. Similarly, if a reviewed report requires an electronic signature, export it to Excel and sign it through your organization’s electronic document system.
How long are reviewed reports stored?
Reviewed reports are stored indefinitely. They can be viewed, exported, and used for audits at any time. Organization owners can delete reviewed reports that are no longer needed; deleted reports can be restored by contacting Overvis support at support@overvis.com.
Glossary
Section titled “Glossary”- Cadence — see Interval size.
- Control point — a point in the cold chain where temperature is monitored, typically a refrigerator, freezer, or cold storage unit.
- Corrective action — an action taken in response to a detected exception, documented as a note attached to the exception interval in the report.
- Exception interval — a continuous period during which an exception condition persists. Adjacent time segments with the same exception type are merged into one interval.
- Interval size — the time period used to divide the report into segments for analysis. Also referred to as cadence. Options: 1 day, 1 hour, 30 minutes, 15 minutes.
- Template — a saved report configuration (parameters, thresholds, interval size, display mode) that can be reloaded for quick report generation with a new date range.
- Reviewed report — an immutable snapshot of a generated report that has been submitted for review, including all readings, exceptions, corrective action notes, and review metadata.
- Segment — a single time slot within a day, determined by the interval size. For example, with a 1-hour interval, each day has 24 segments (23 or 25 on DST transition days).
- Setpoint — the target temperature for a control point, used for deviation coloring in the report table.
- Tracked parameter — a device parameter that Overvis reads periodically and stores in the database. Only tracked parameters can be used in HACCP reports.