Visualizations
Visualizations in Overvis Cloud are custom, interactive pages (HTML/SVG/JavaScript) that display the current state of your equipment and provide remote control capabilities. They are the same feature labeled Visualizations in the app navigation. While Overvis handles device connectivity, data collection, and alarm processing automatically, visualizations give you the flexibility to present this information exactly how you need it.
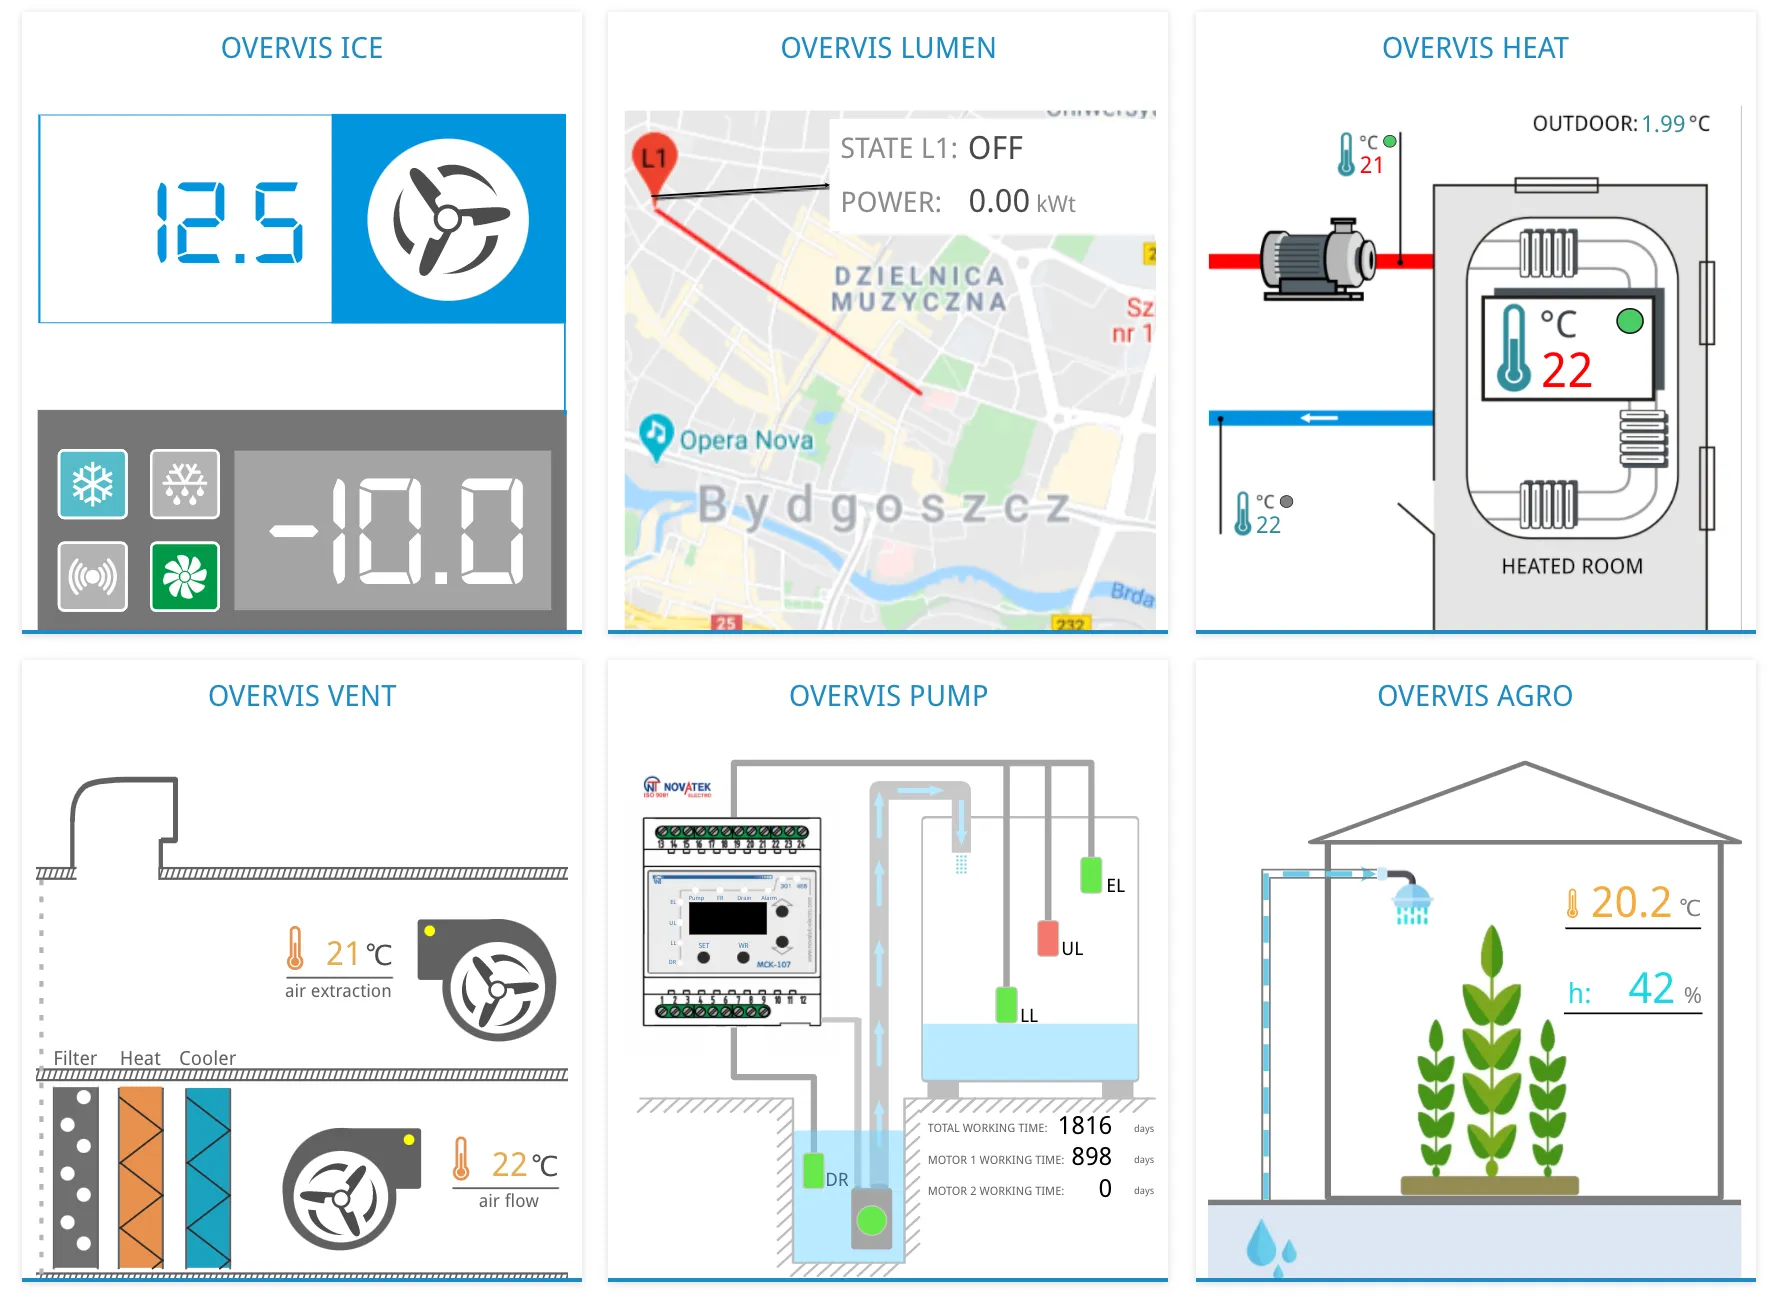
What Are Visualizations?
Section titled “What Are Visualizations?”Visualizations are HTML/SVG/JavaScript code embedded into Overvis pages. You create the visual design using any vector graphics editor, export it as SVG, and then add special attributes to bind live data from your devices to the graphics.
How They Work
Section titled “How They Work”The visualization engine:
- Loads your HTML/SVG code and inserts it into the chosen page
- Gathers all data bindings from the source code
- Reads data from connected devices according to your data bindings
- Updates the visual elements with live values
- Refreshes automatically every 10 seconds (configurable with
update-period-secattribute) - Handles user interactions like editing parameters or toggling controls
Prerequisites
Section titled “Prerequisites”Before you start building visualizations, make sure you have the necessary tools and environment set up.
- Your equipment should already be connected to Overvis
- Install a vector graphics editor that exports SVG (Affinity Designer, Inkscape, Adobe Illustrator, Sketch, or SVG-Edit)
- Use a text editor capable of editing SVG/XML (VS Code, Notepad++, Atom, or Sublime Text)
- Basic familiarity with SVG structure is helpful (see SVG tutorial if needed)
Getting Started
Section titled “Getting Started”This section walks you through creating your first visualization, from accessing the editor to displaying a simple example.
Creating Your First Visualization
Section titled “Creating Your First Visualization”Navigate to the visualizations page in the Overvis menu. If you haven’t created any visualizations yet, the list will be empty.
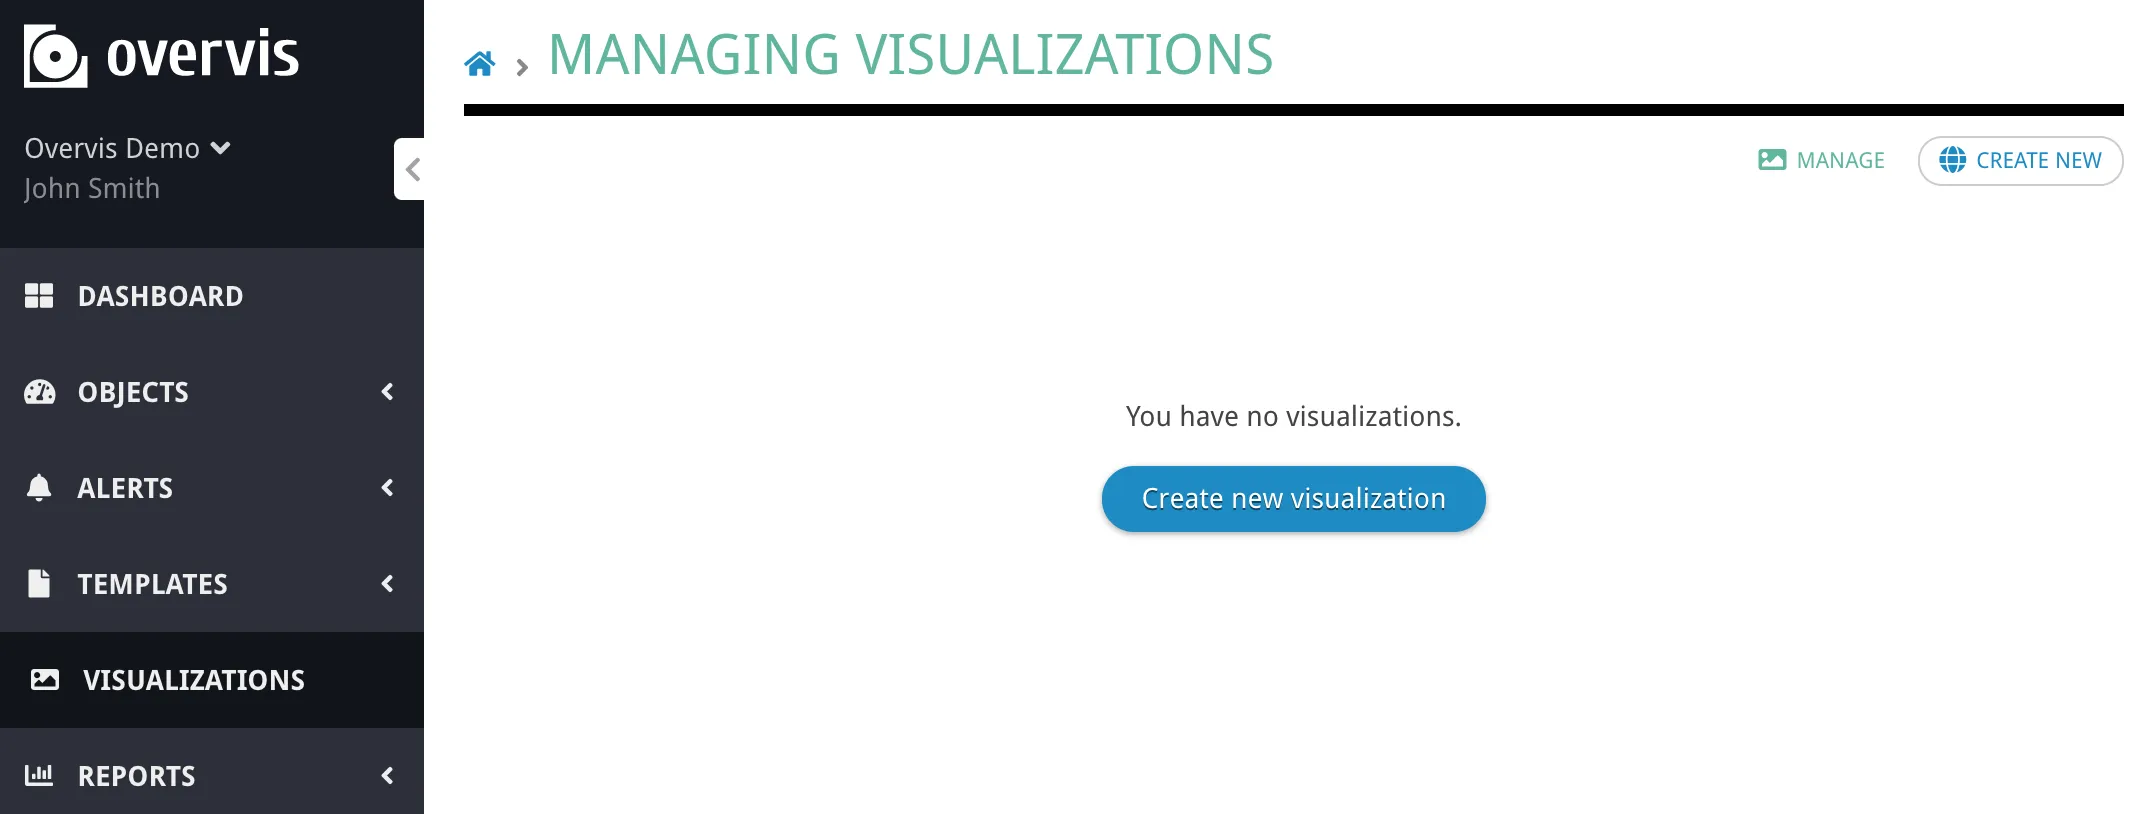
Click Create new visualization to open the visualization editor:
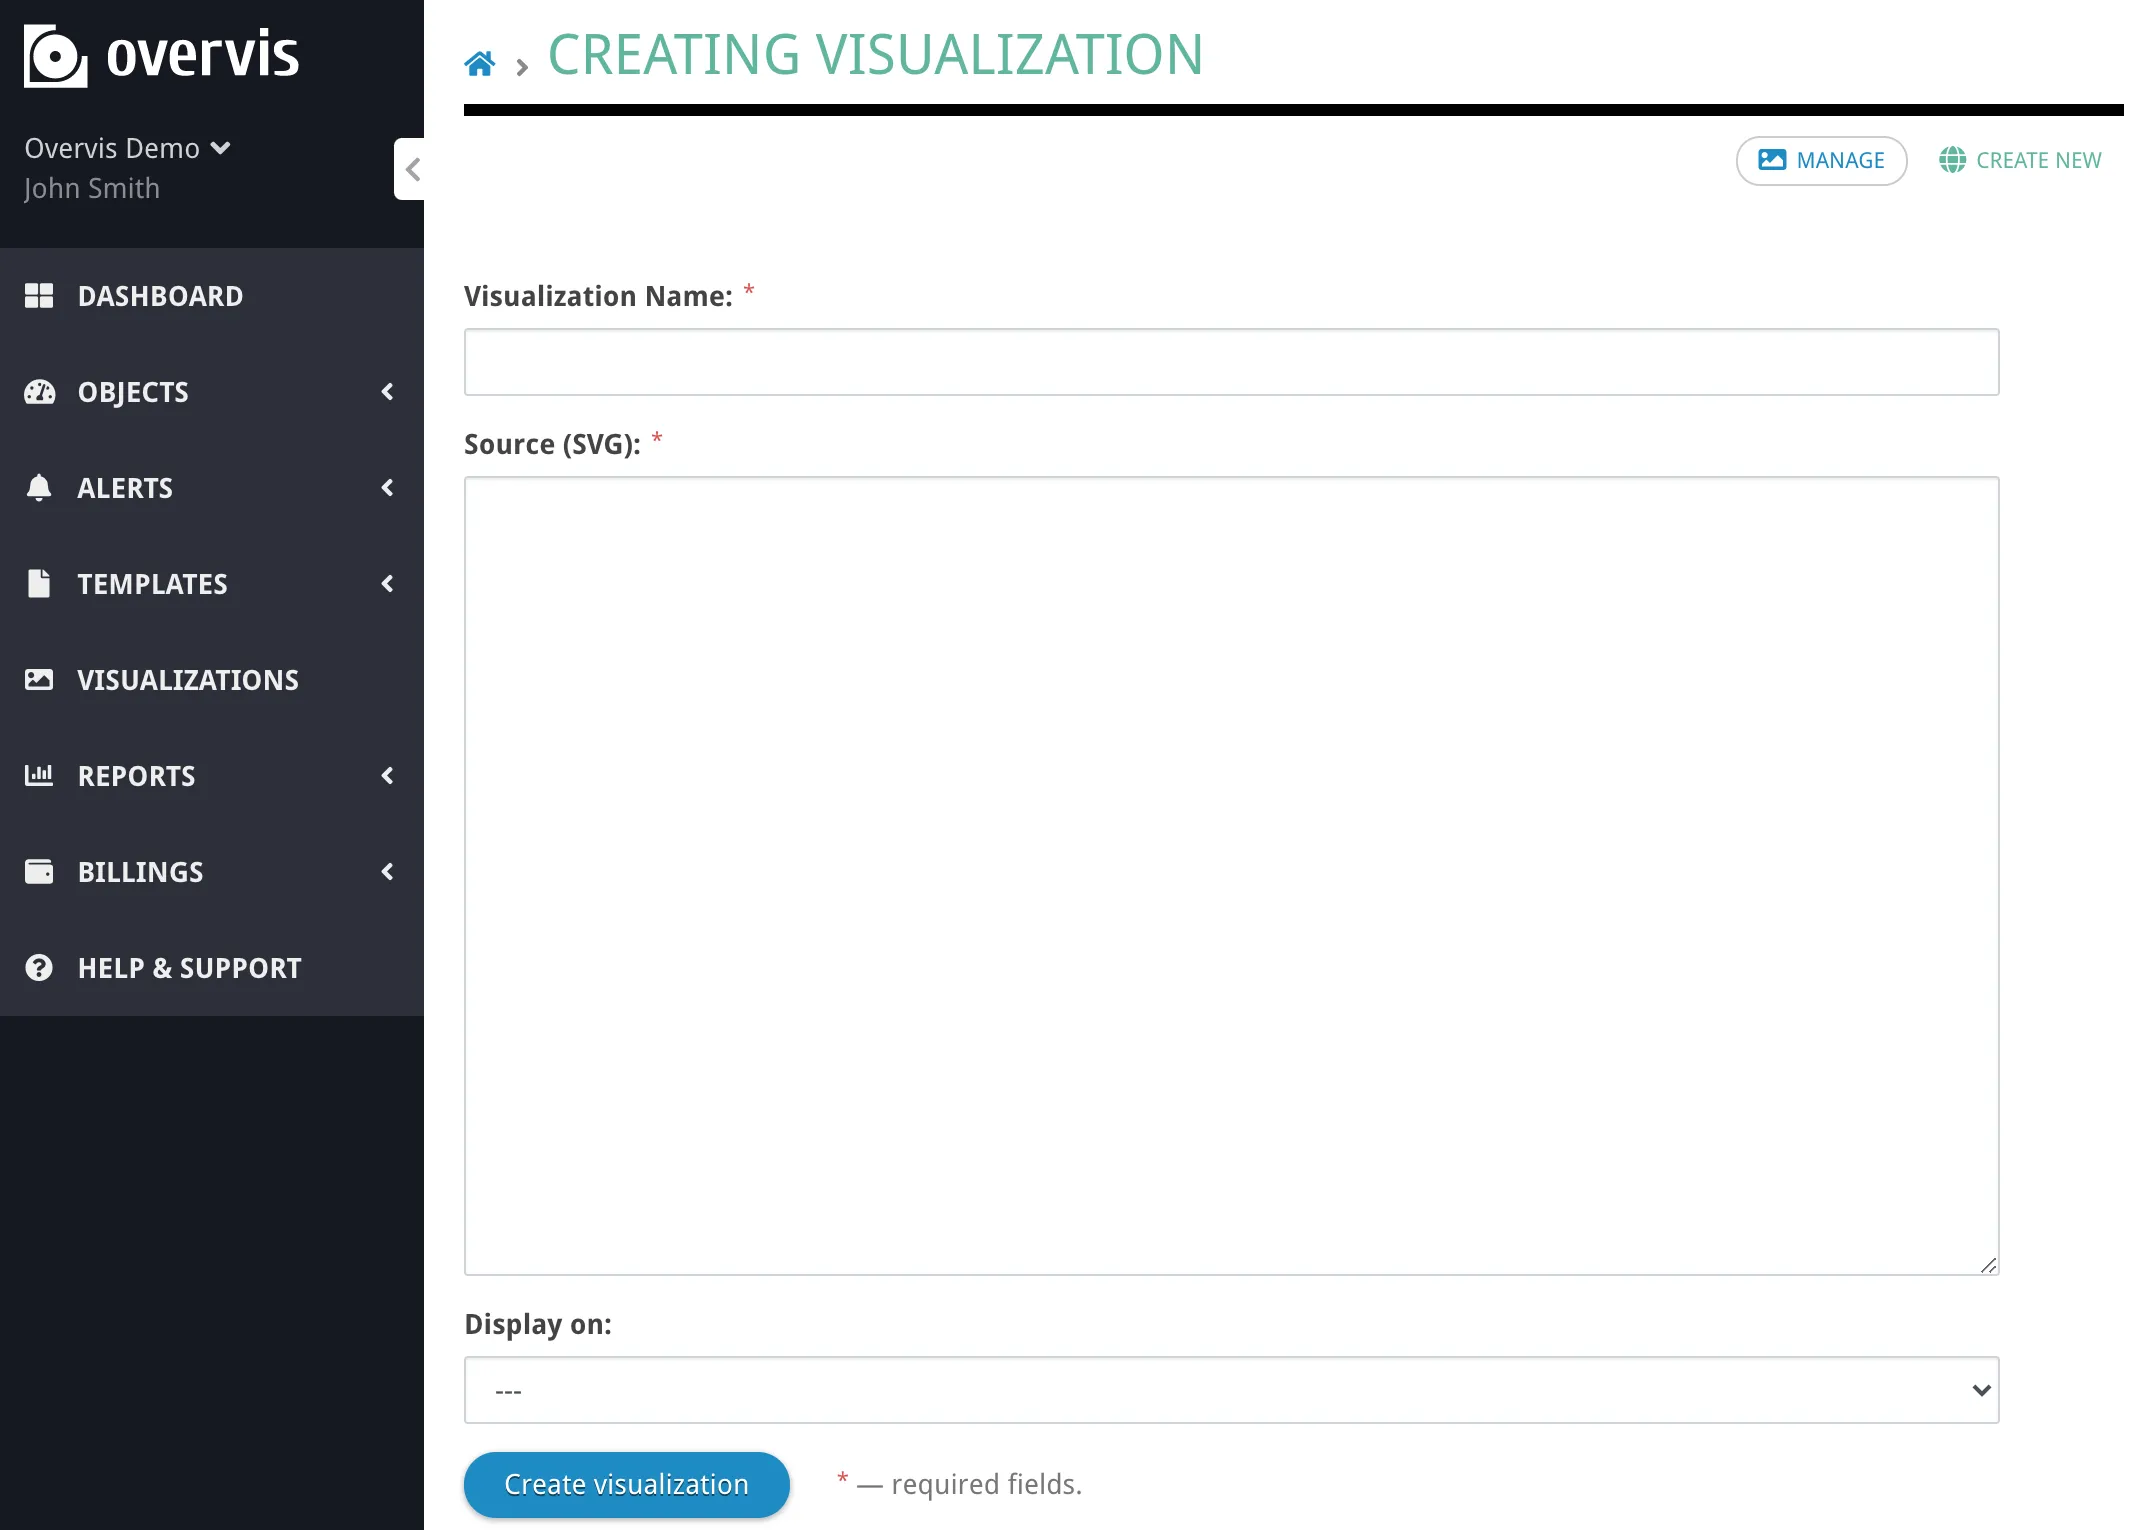
The editor has two main fields:
- Source (SVG/HTML) - Your HTML/SVG/JavaScript code
- Display on - Which page should show this visualization
A Simple Example
Section titled “A Simple Example”Let’s start with a basic example to understand how it works:
Any HTML or SVG code you add here is shown as-is.<br /><br />
For example, <b>this text appears bold.</b><br /><br />
Below is a simple SVG with a red square:<br />
<svg width="100px" height="100px" viewBox="0 0 100 100">    <rect fill="#FF0000" height="100" width="100" x="0" y="0" /></svg>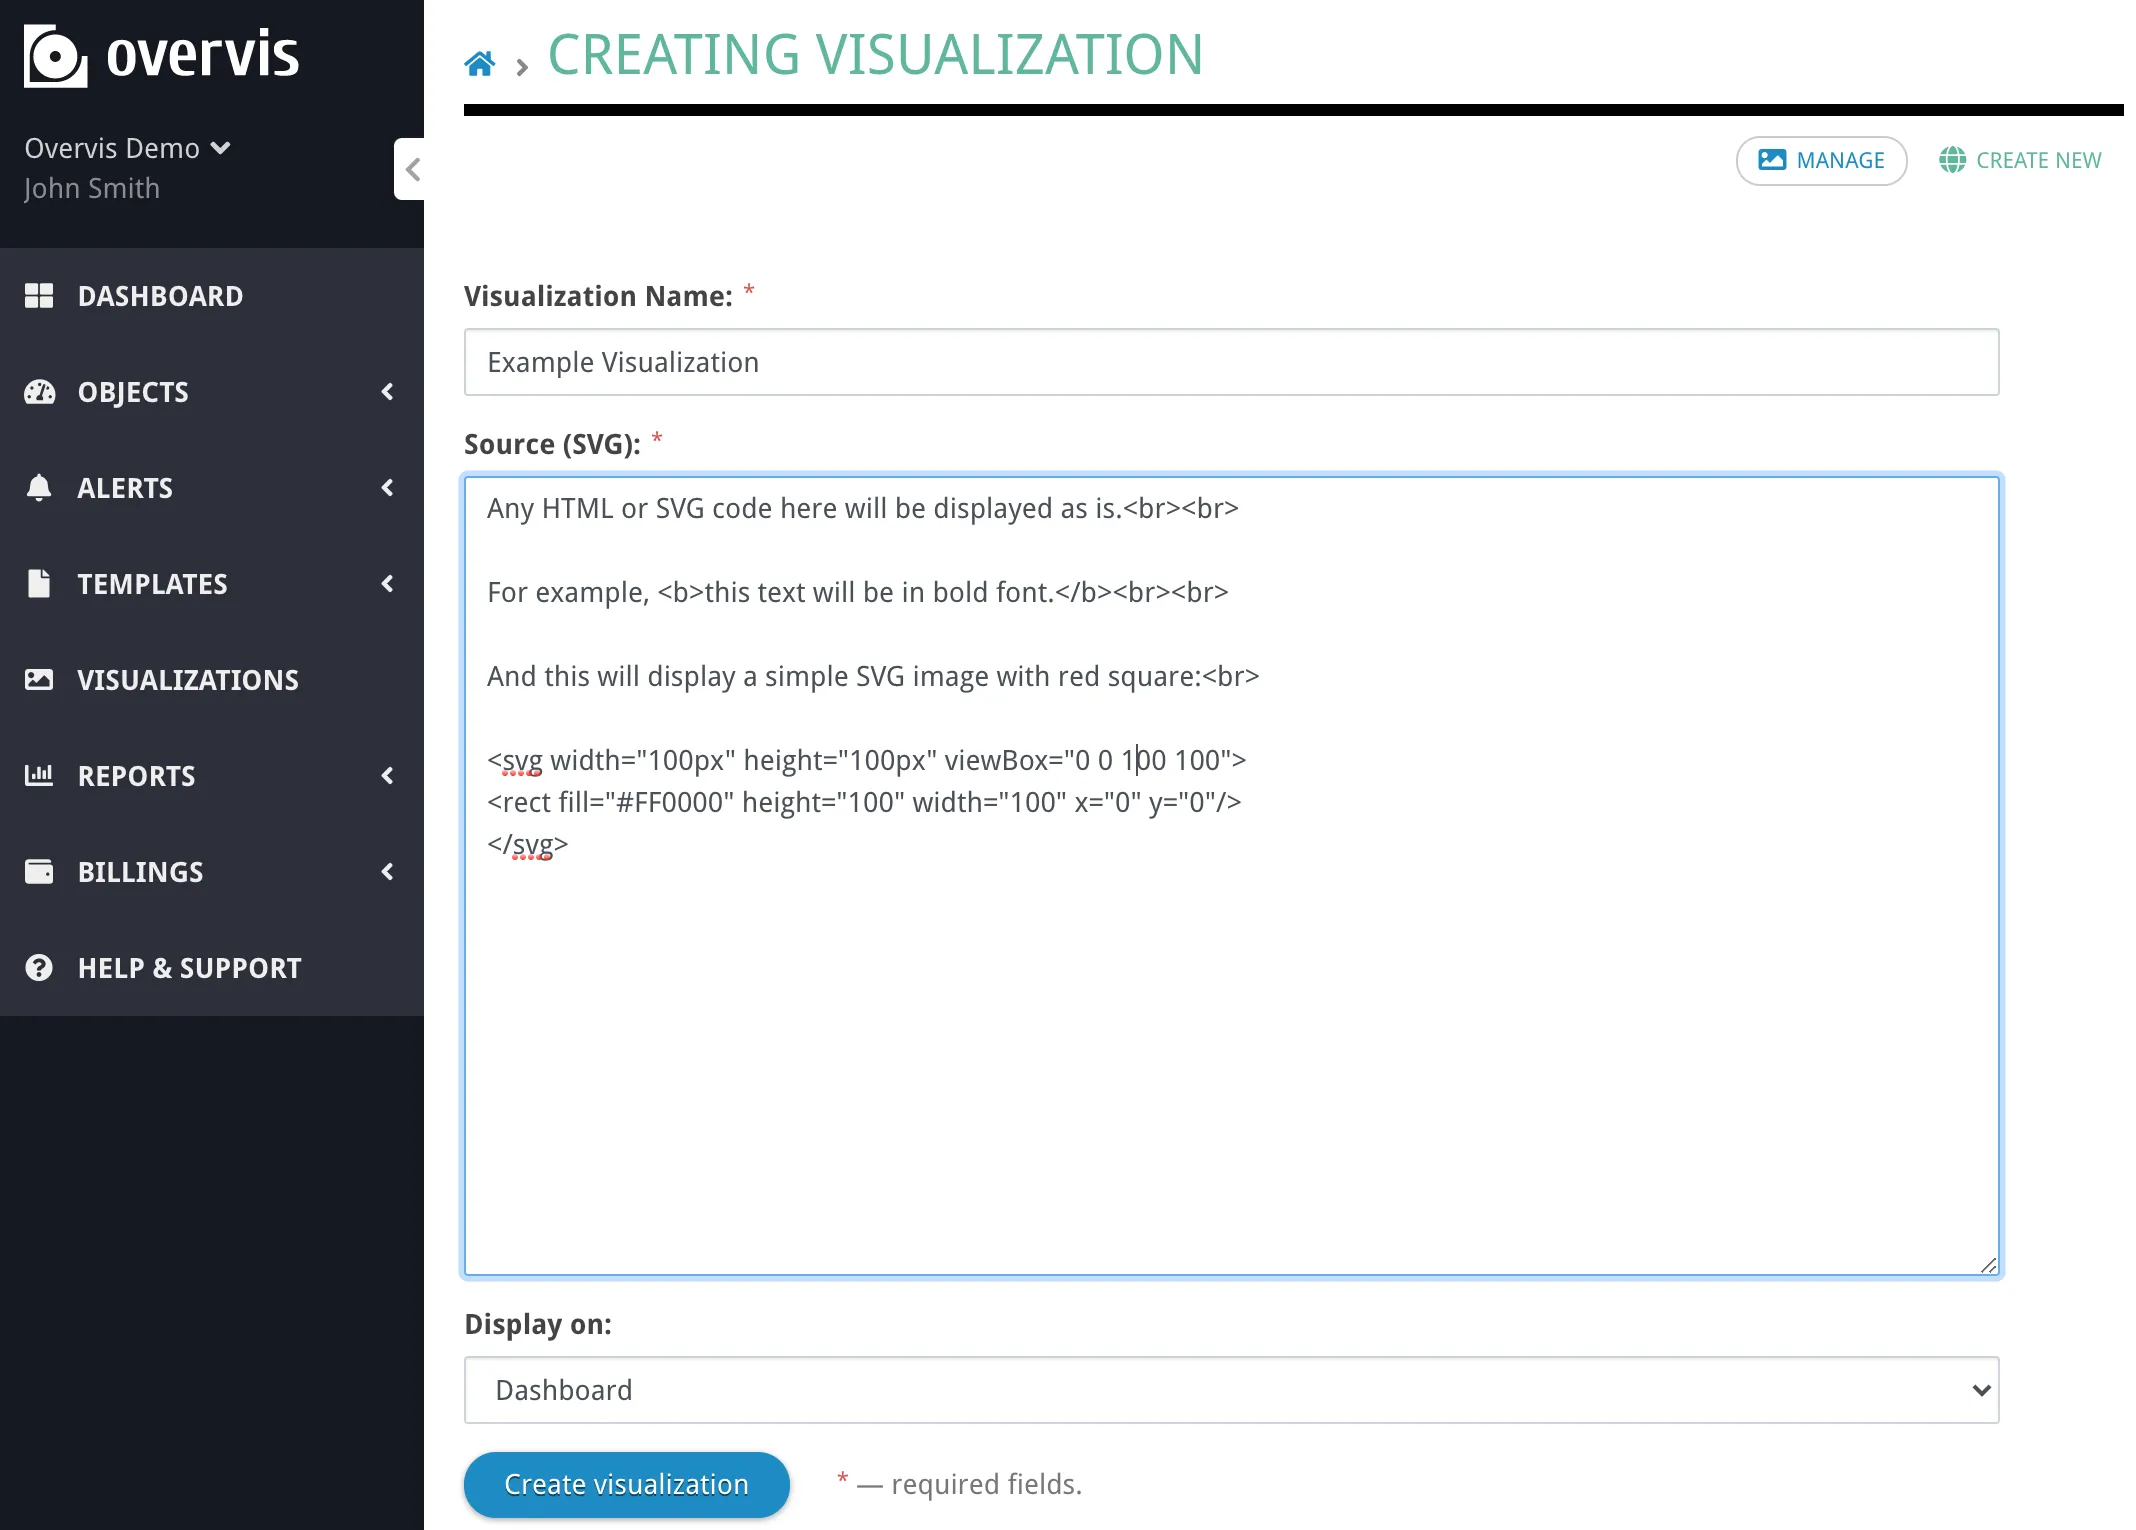
After clicking “Create visualization” the result is:
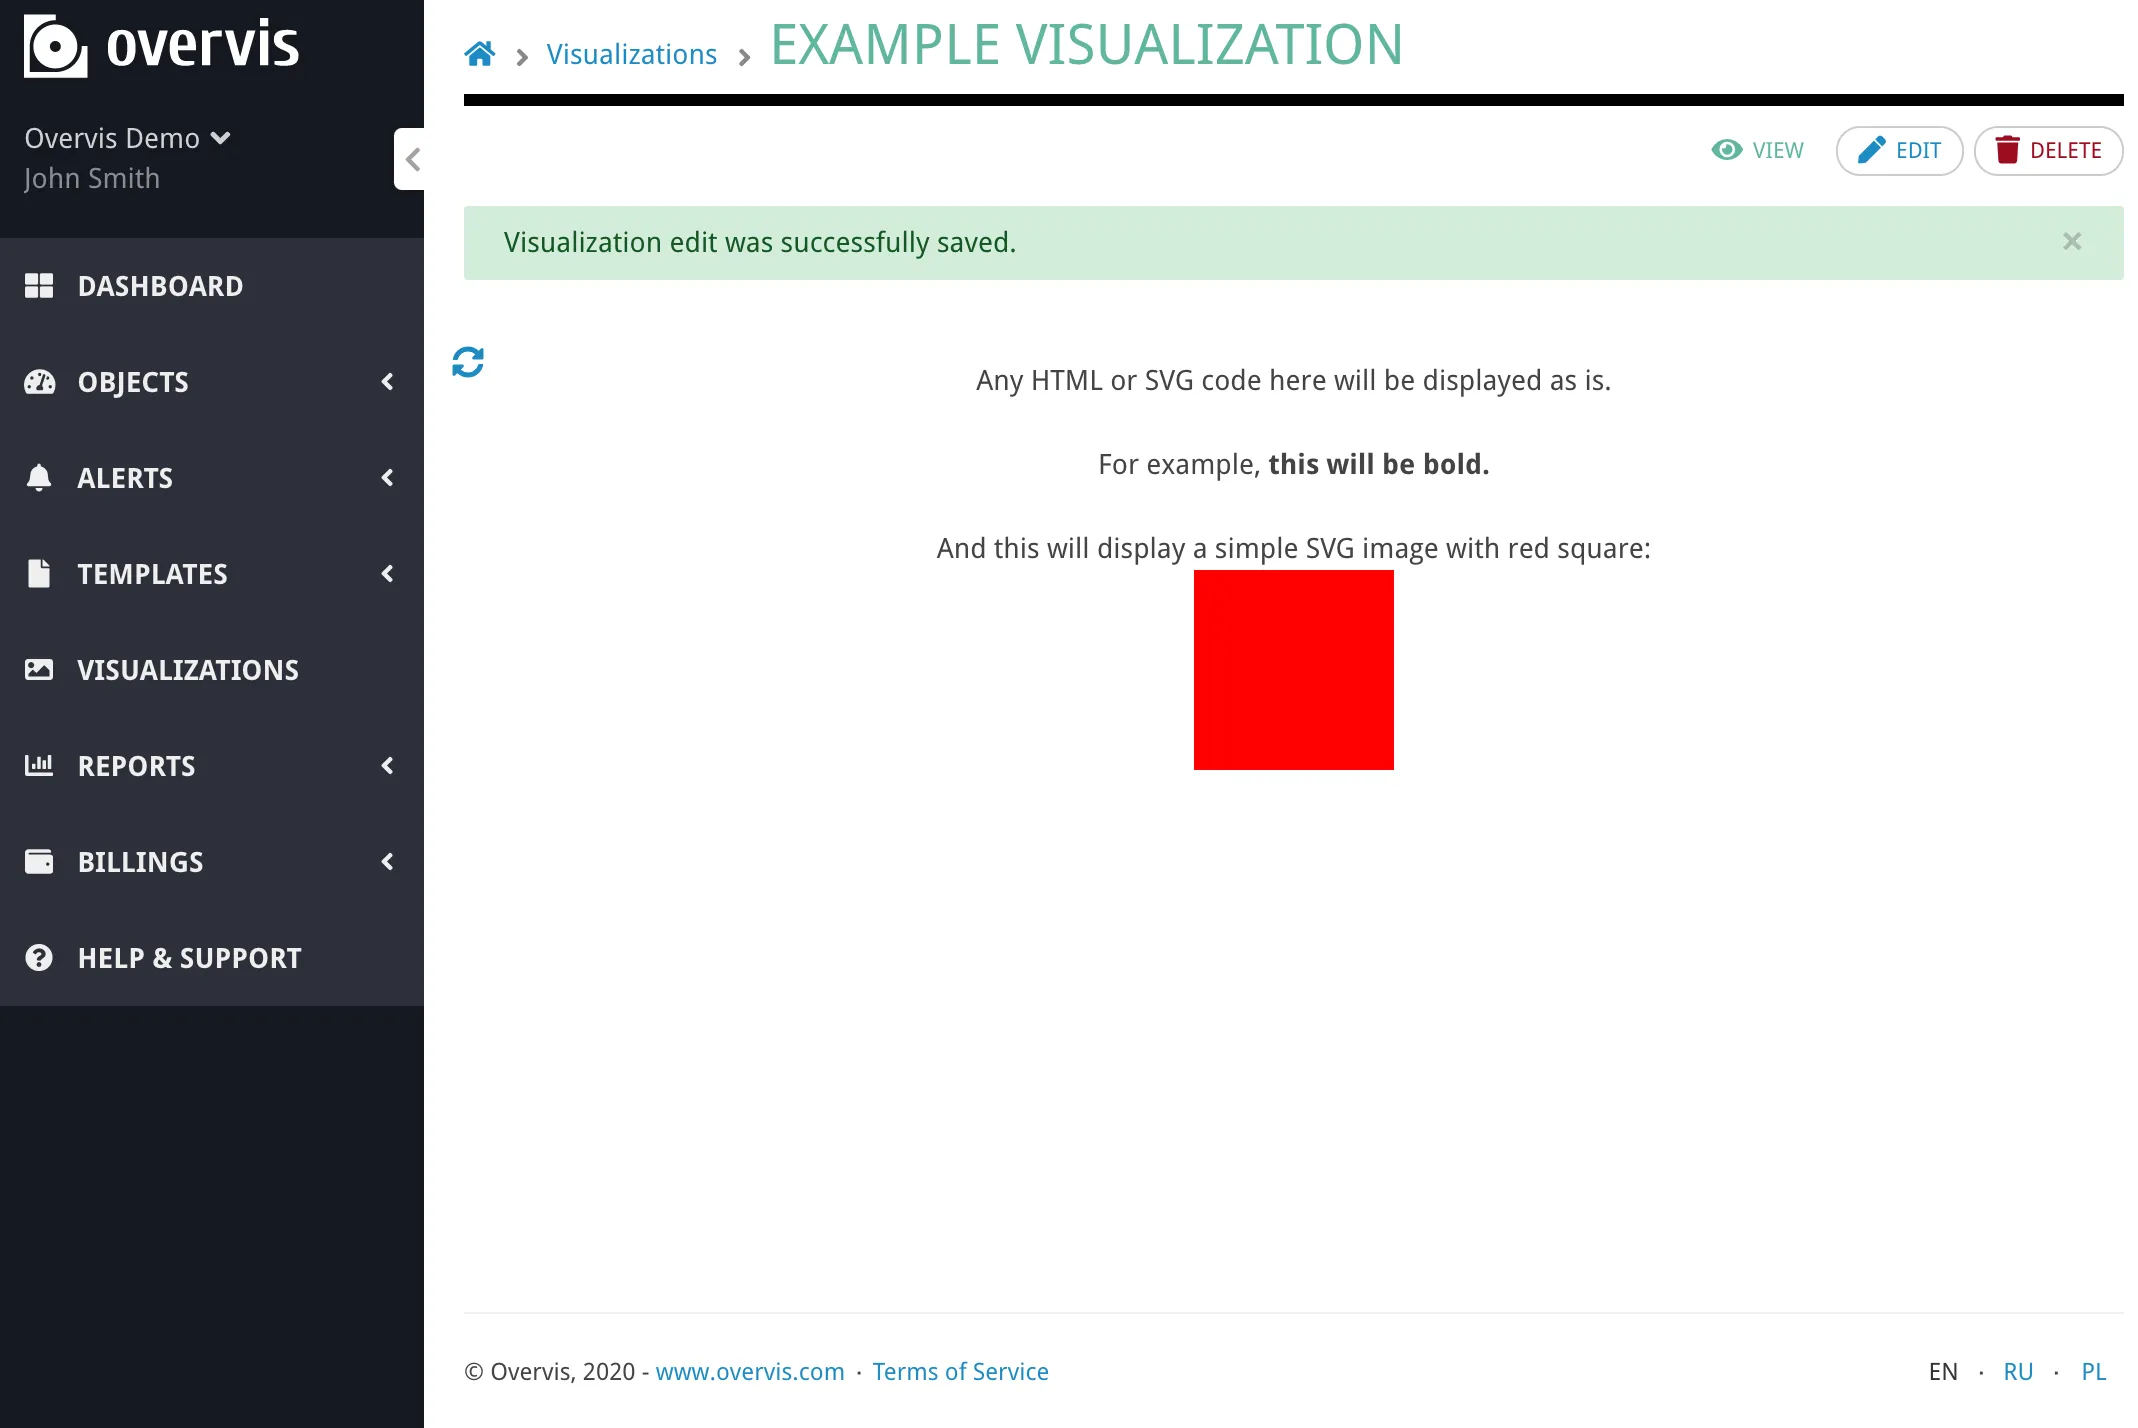
You can even add it to the Dashboard in Overvis:
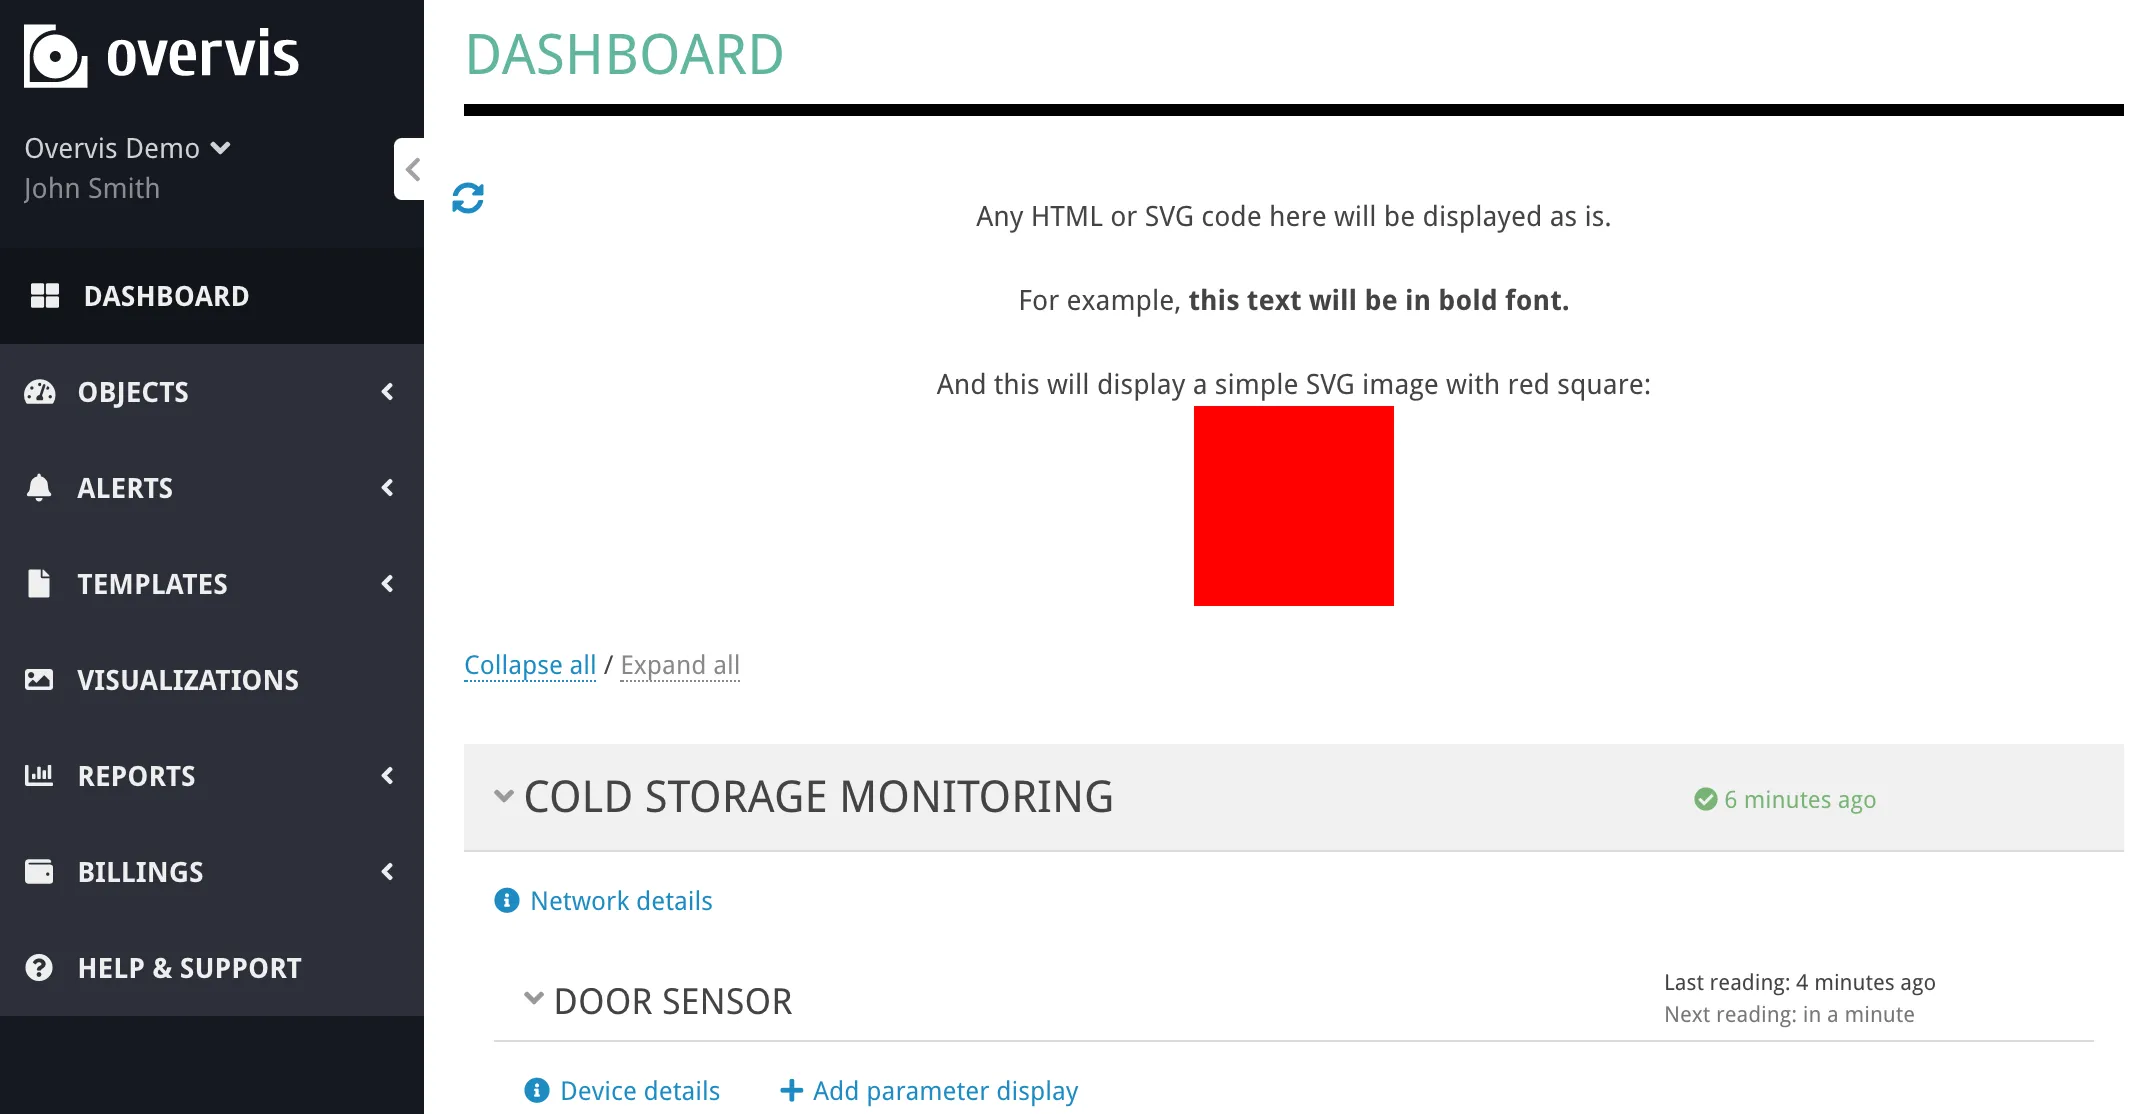
This visualization is static. To display actual device data, you need to use data bindings - special HTML/SVG attributes that connect visual elements to device parameters.
Step-by-Step Tutorial
Section titled “Step-by-Step Tutorial”This tutorial walks through creating a complete visualization for refrigeration equipment monitoring. You’ll learn how to display live temperatures, add interactive setpoint controls, show alarm indicators, and implement toggle switches.
Step 1: Design the Graphics
Section titled “Step 1: Design the Graphics”Create the visualization design in your vector graphics editor. For this example, we’ll create a storage room layout with freezer units showing:
- Room floor plan
- Temperature displays for each fridge
- Setpoint controls
- Alarm indicators
- An energy meter
- A defrost mode switch
- A door status indicator
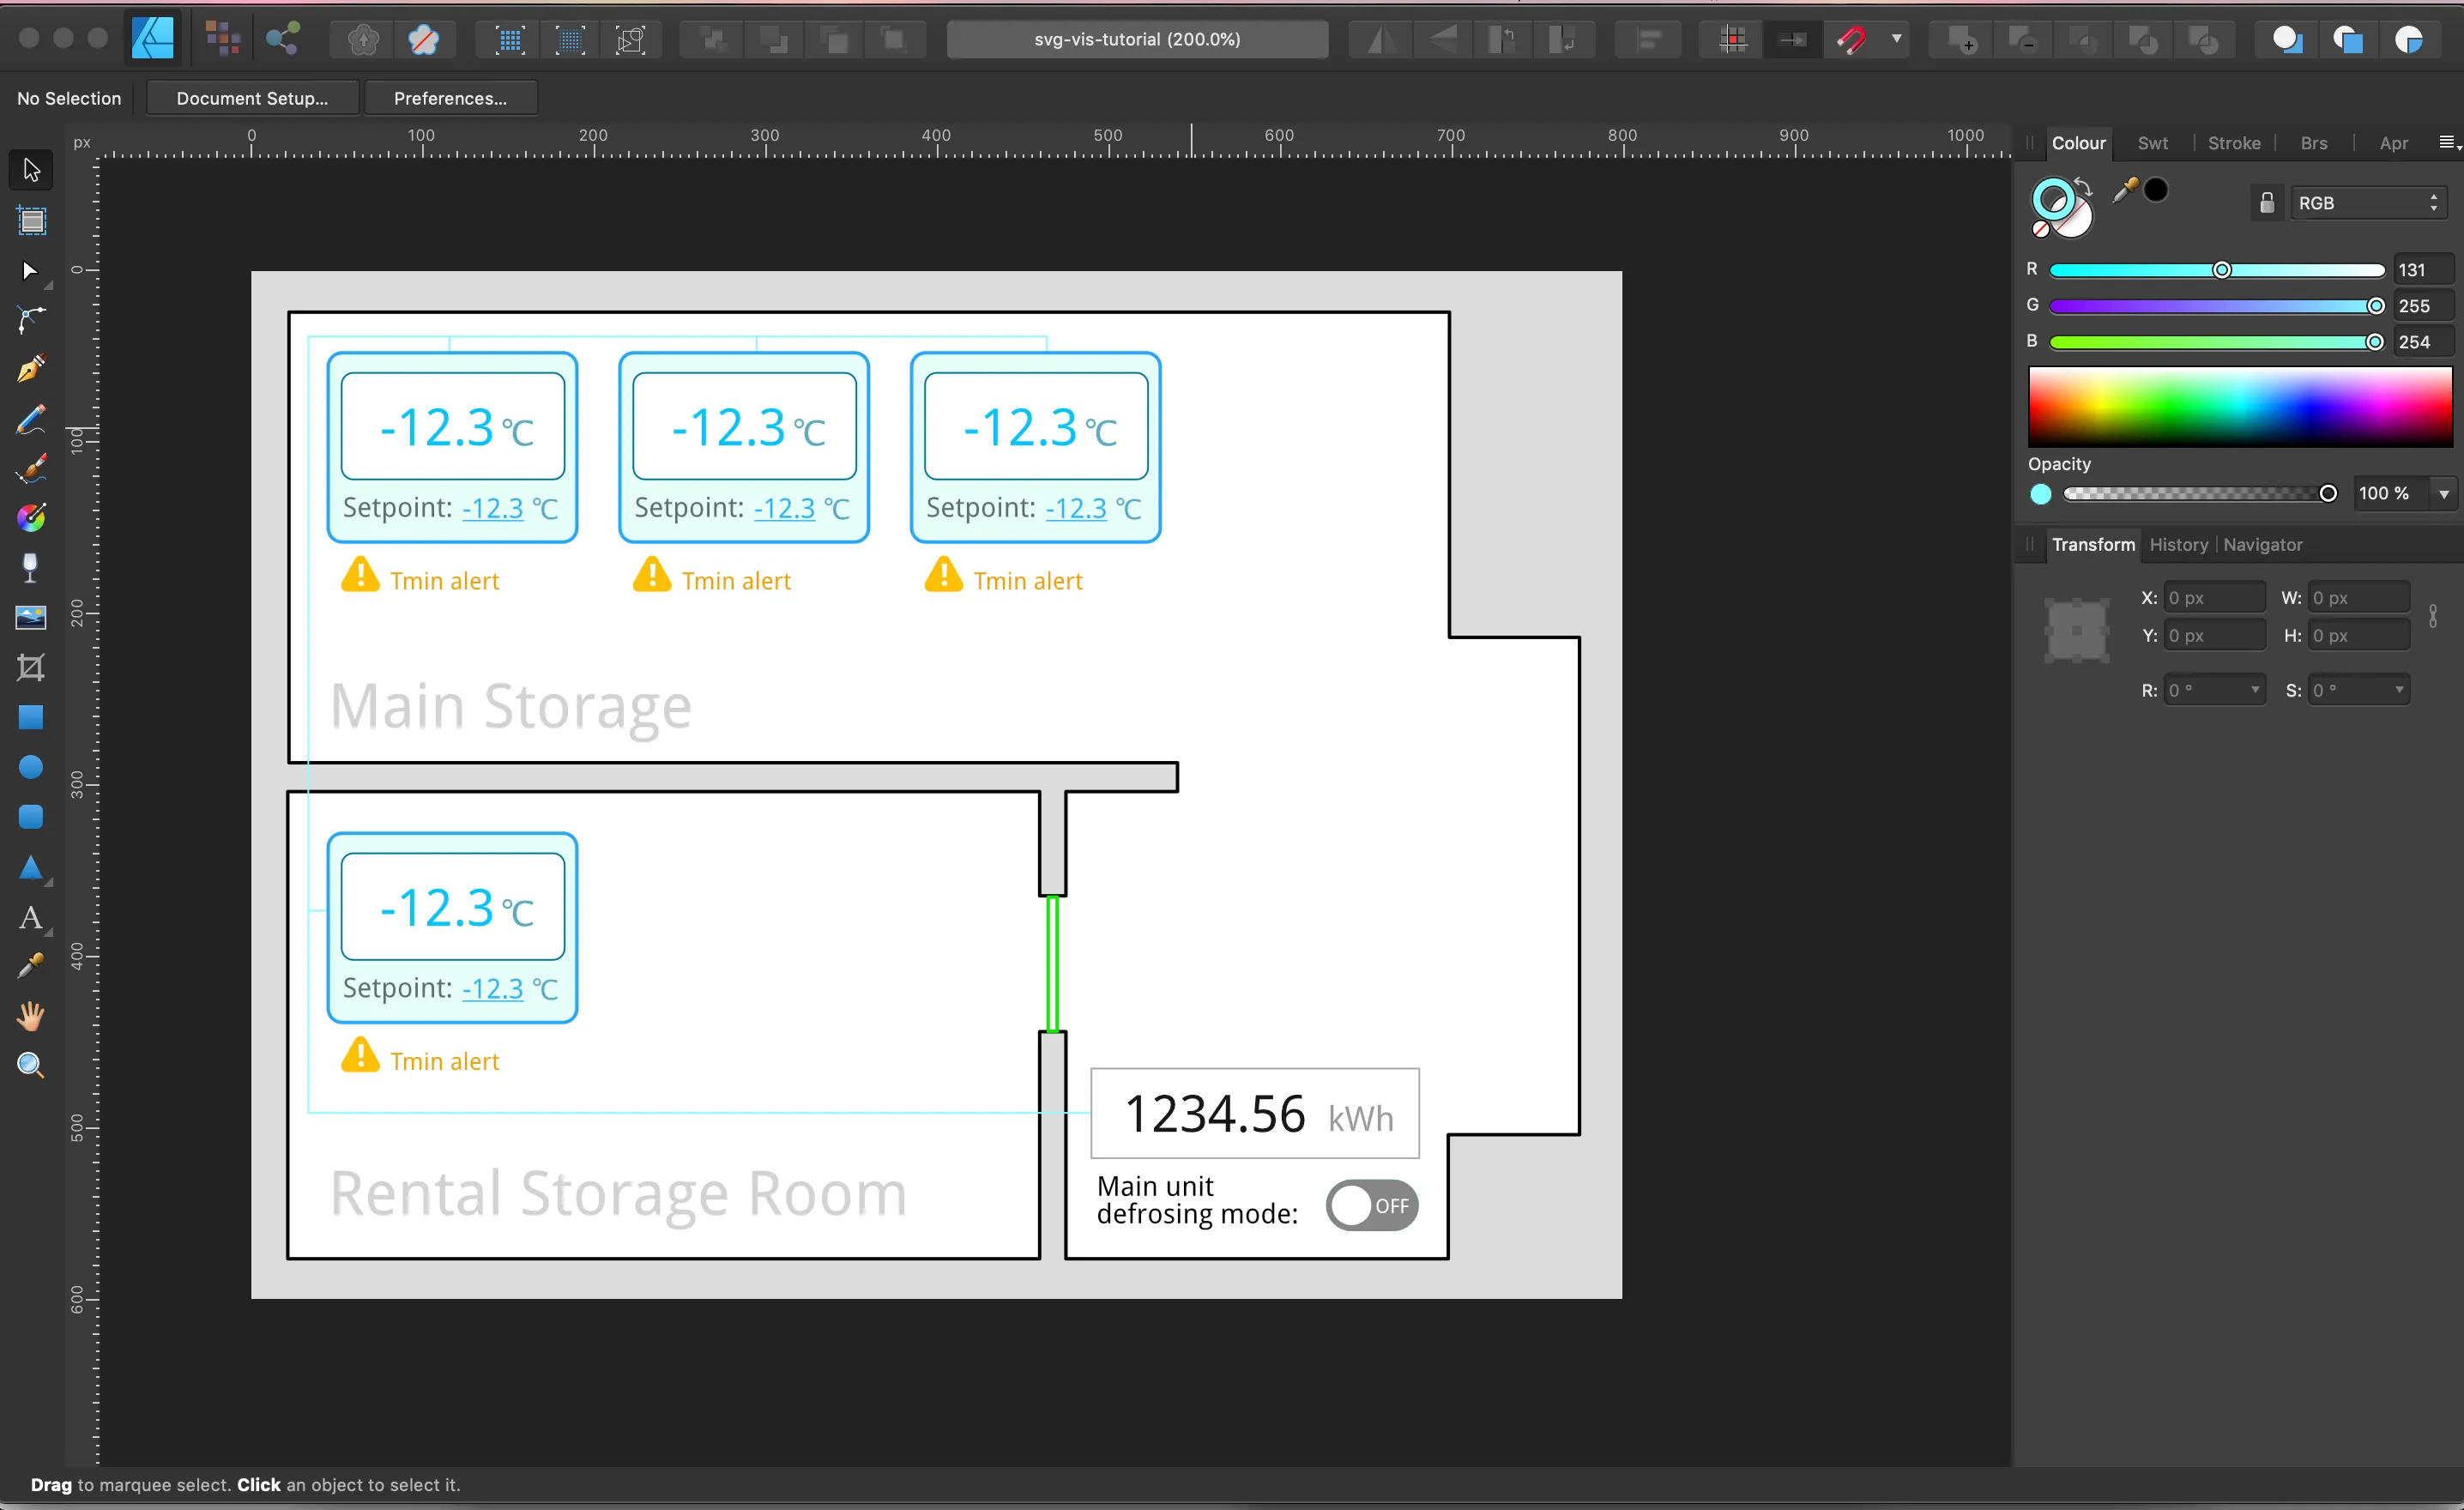
When designing your visualization, follow these guidelines:
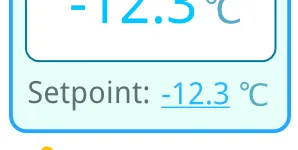
Use placeholder values. Insert representative placeholder values for all dynamic data. For temperatures expected to be negative with one decimal place, use “-12.3”. This helps with layout and positioning during design.
Separate dynamic from static elements. Keep dynamic values as separate objects from static labels. For example, “-12.3” and “°C” should be separate text objects, so only the number gets updated with live data.
Keep text as text. Don’t convert dynamic text elements to curves or paths. Static text can be converted to reduce file size, but dynamic elements must remain editable text.
Use compatible fonts. Stick to web-safe fonts (Arial, Times New Roman, Courier) or use Droid Sans, which Overvis provides to all visualizations. Custom fonts require additional CSS configuration.
Position everything upfront. Draw all elements in their final positions, including elements that will be hidden initially (like alarm indicators in both triggered and normal states, or switches in both on/off positions).
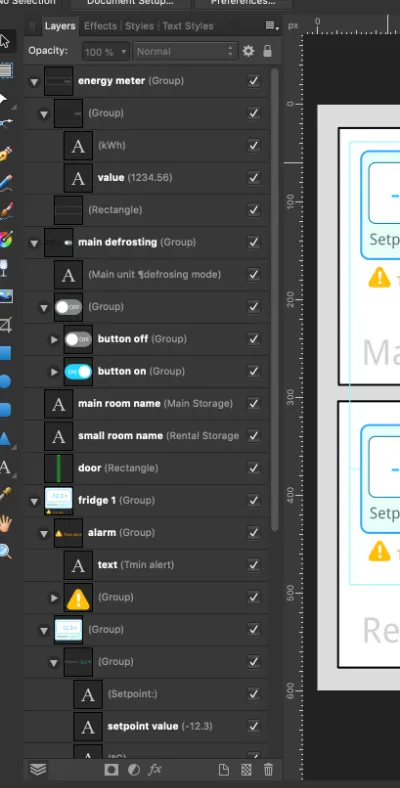
Name your layers descriptively. Use clear layer names in your graphics editor. These names often become element IDs in the SVG, making it much easier to locate specific elements when adding data bindings.
Step 2: Export as SVG
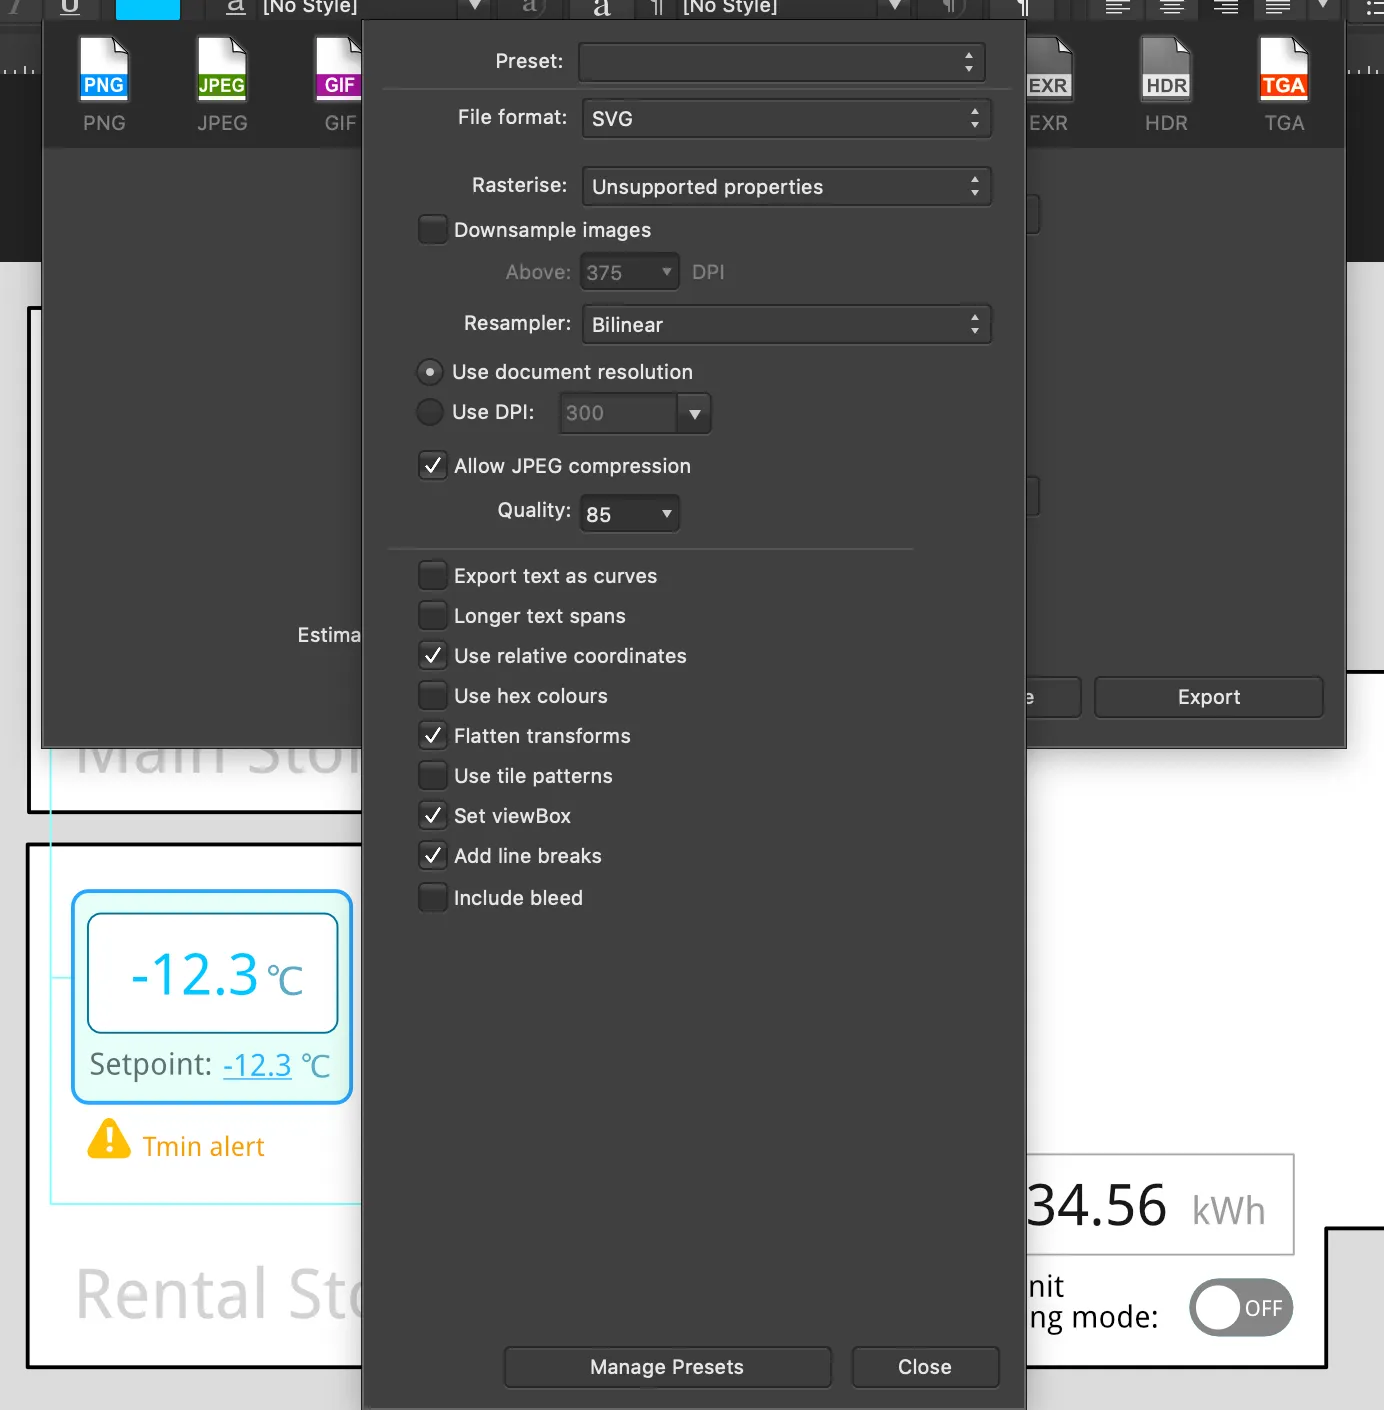
Section titled “Step 2: Export as SVG”Export your design as SVG with settings that preserve editability:
- Disable compression or minification
- Preserve layer names and IDs
- Don’t convert text to curves/paths
- Use the most accessible format preset
After exporting, open the SVG file in a text editor and remove the XML declaration and DOCTYPE tags at the beginning:
<?xml version="1.0" encoding="UTF-8" standalone="no"?><!DOCTYPE svg PUBLIC "-//W3C//DTD SVG 1.1//EN" "http://www.w3.org/Graphics/SVG/1.1/DTD/svg11.dtd">These tags must be removed because the SVG will be embedded directly into an HTML page.
Step 3: Upload the Static Visualization
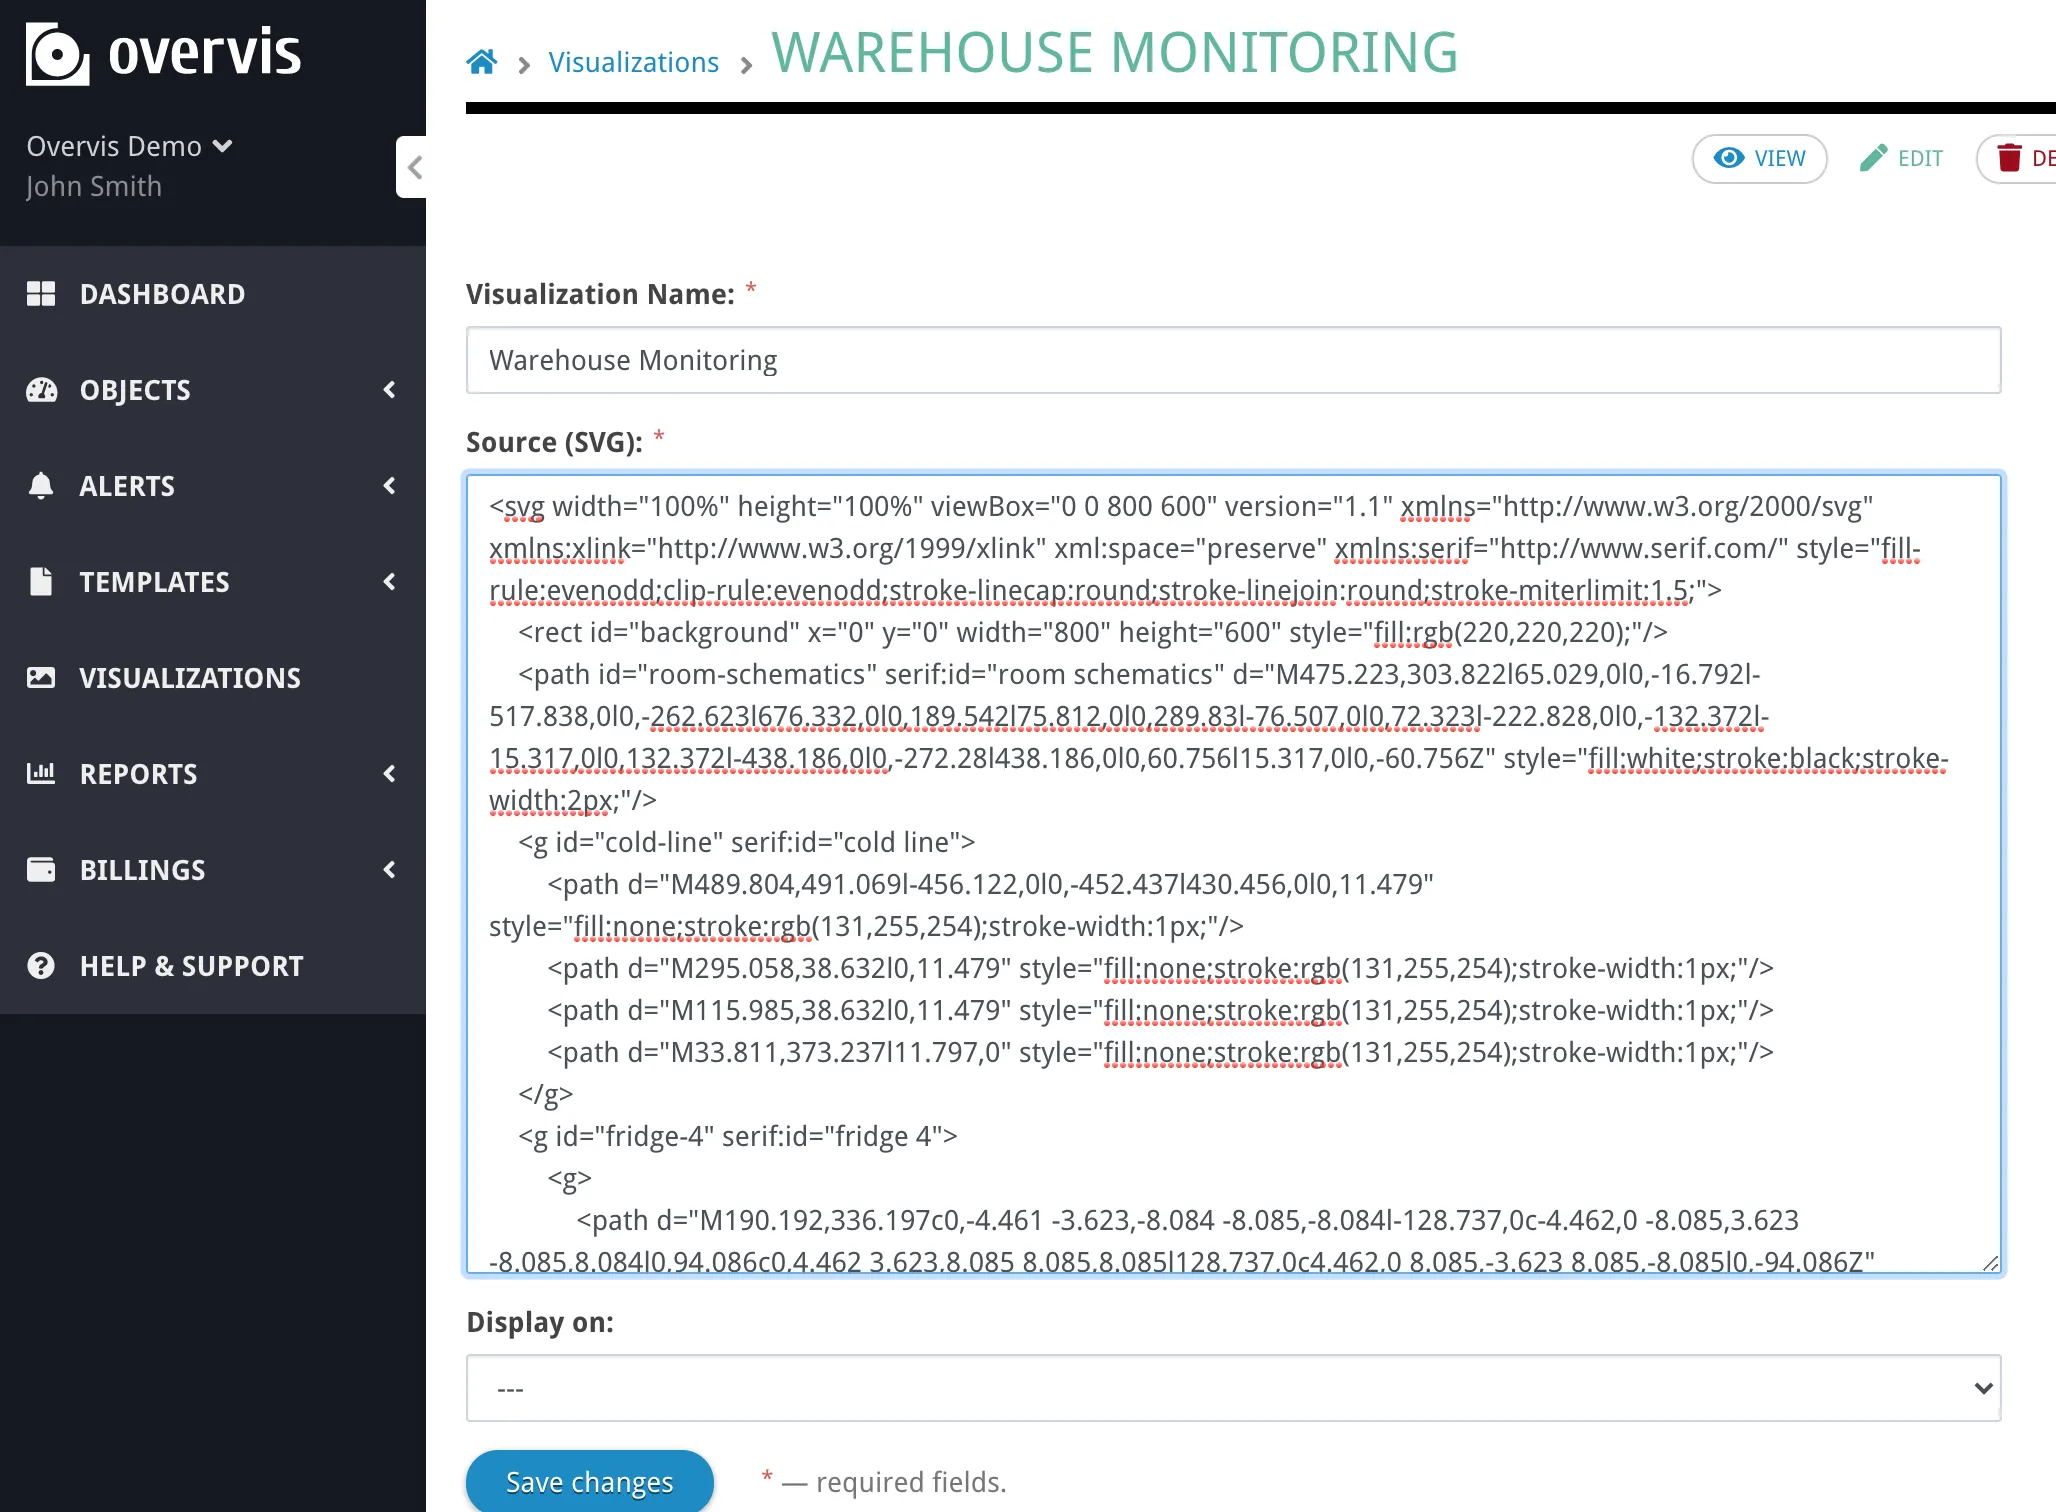
Section titled “Step 3: Upload the Static Visualization”Copy the cleaned SVG code into the Overvis visualization editor and save it:
View the result to confirm the graphic displays correctly:
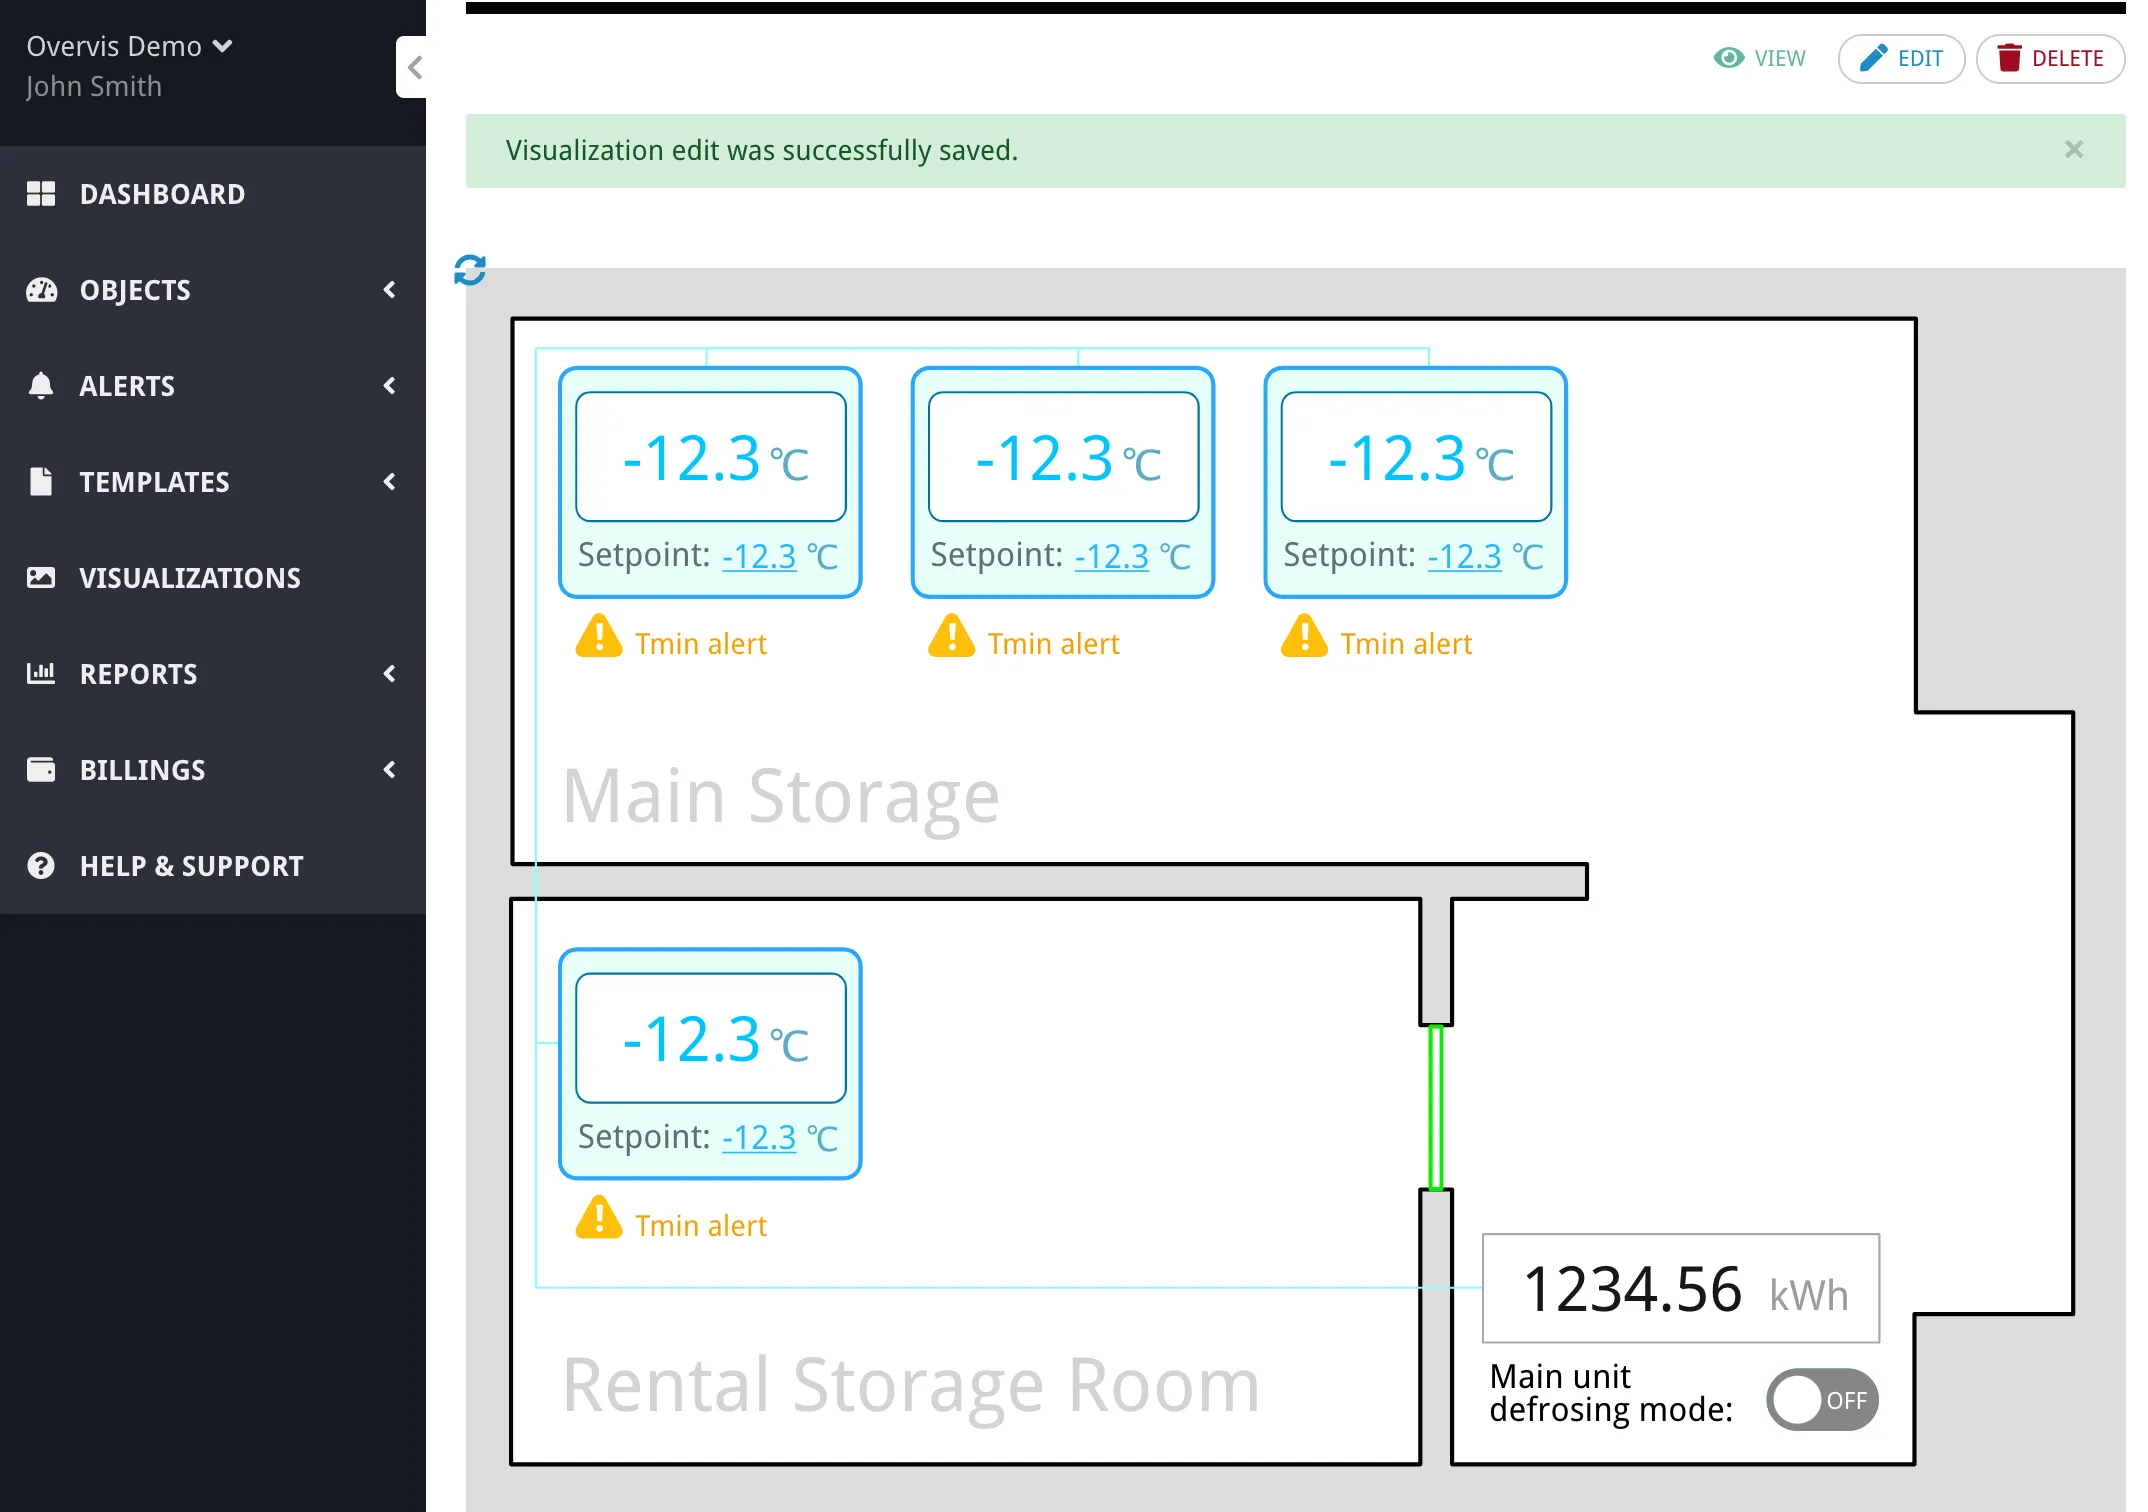
At this point, the visualization is purely visual with no live data. The next steps will add data bindings.
Step 4: Prepare Device Information
Section titled “Step 4: Prepare Device Information”You’ll need the network controller MAC address and device addresses to create data bindings. Find these in your network settings:
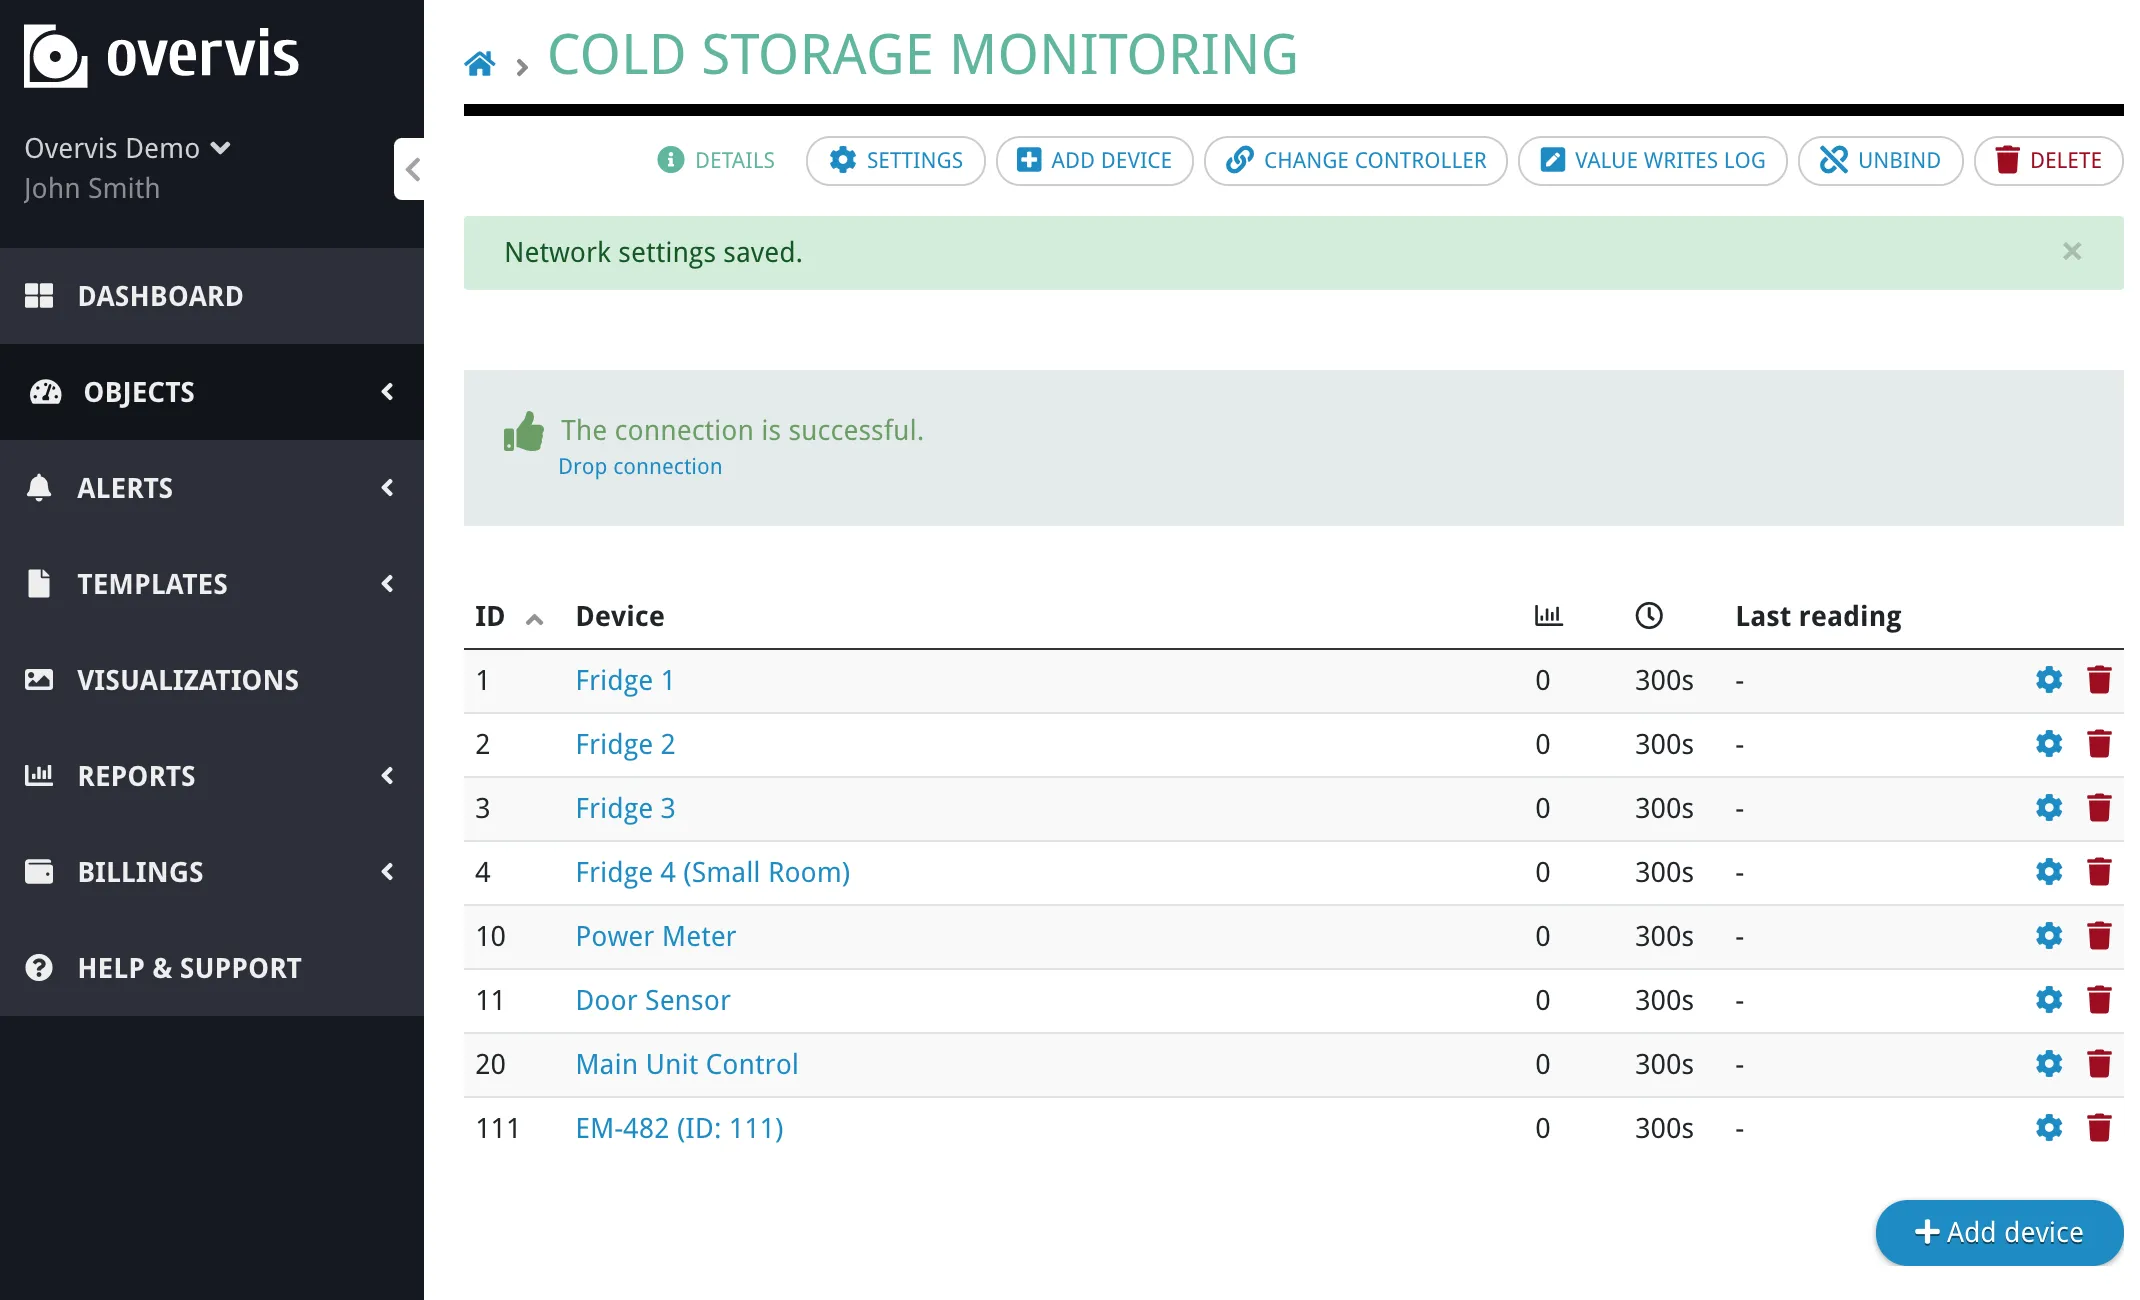
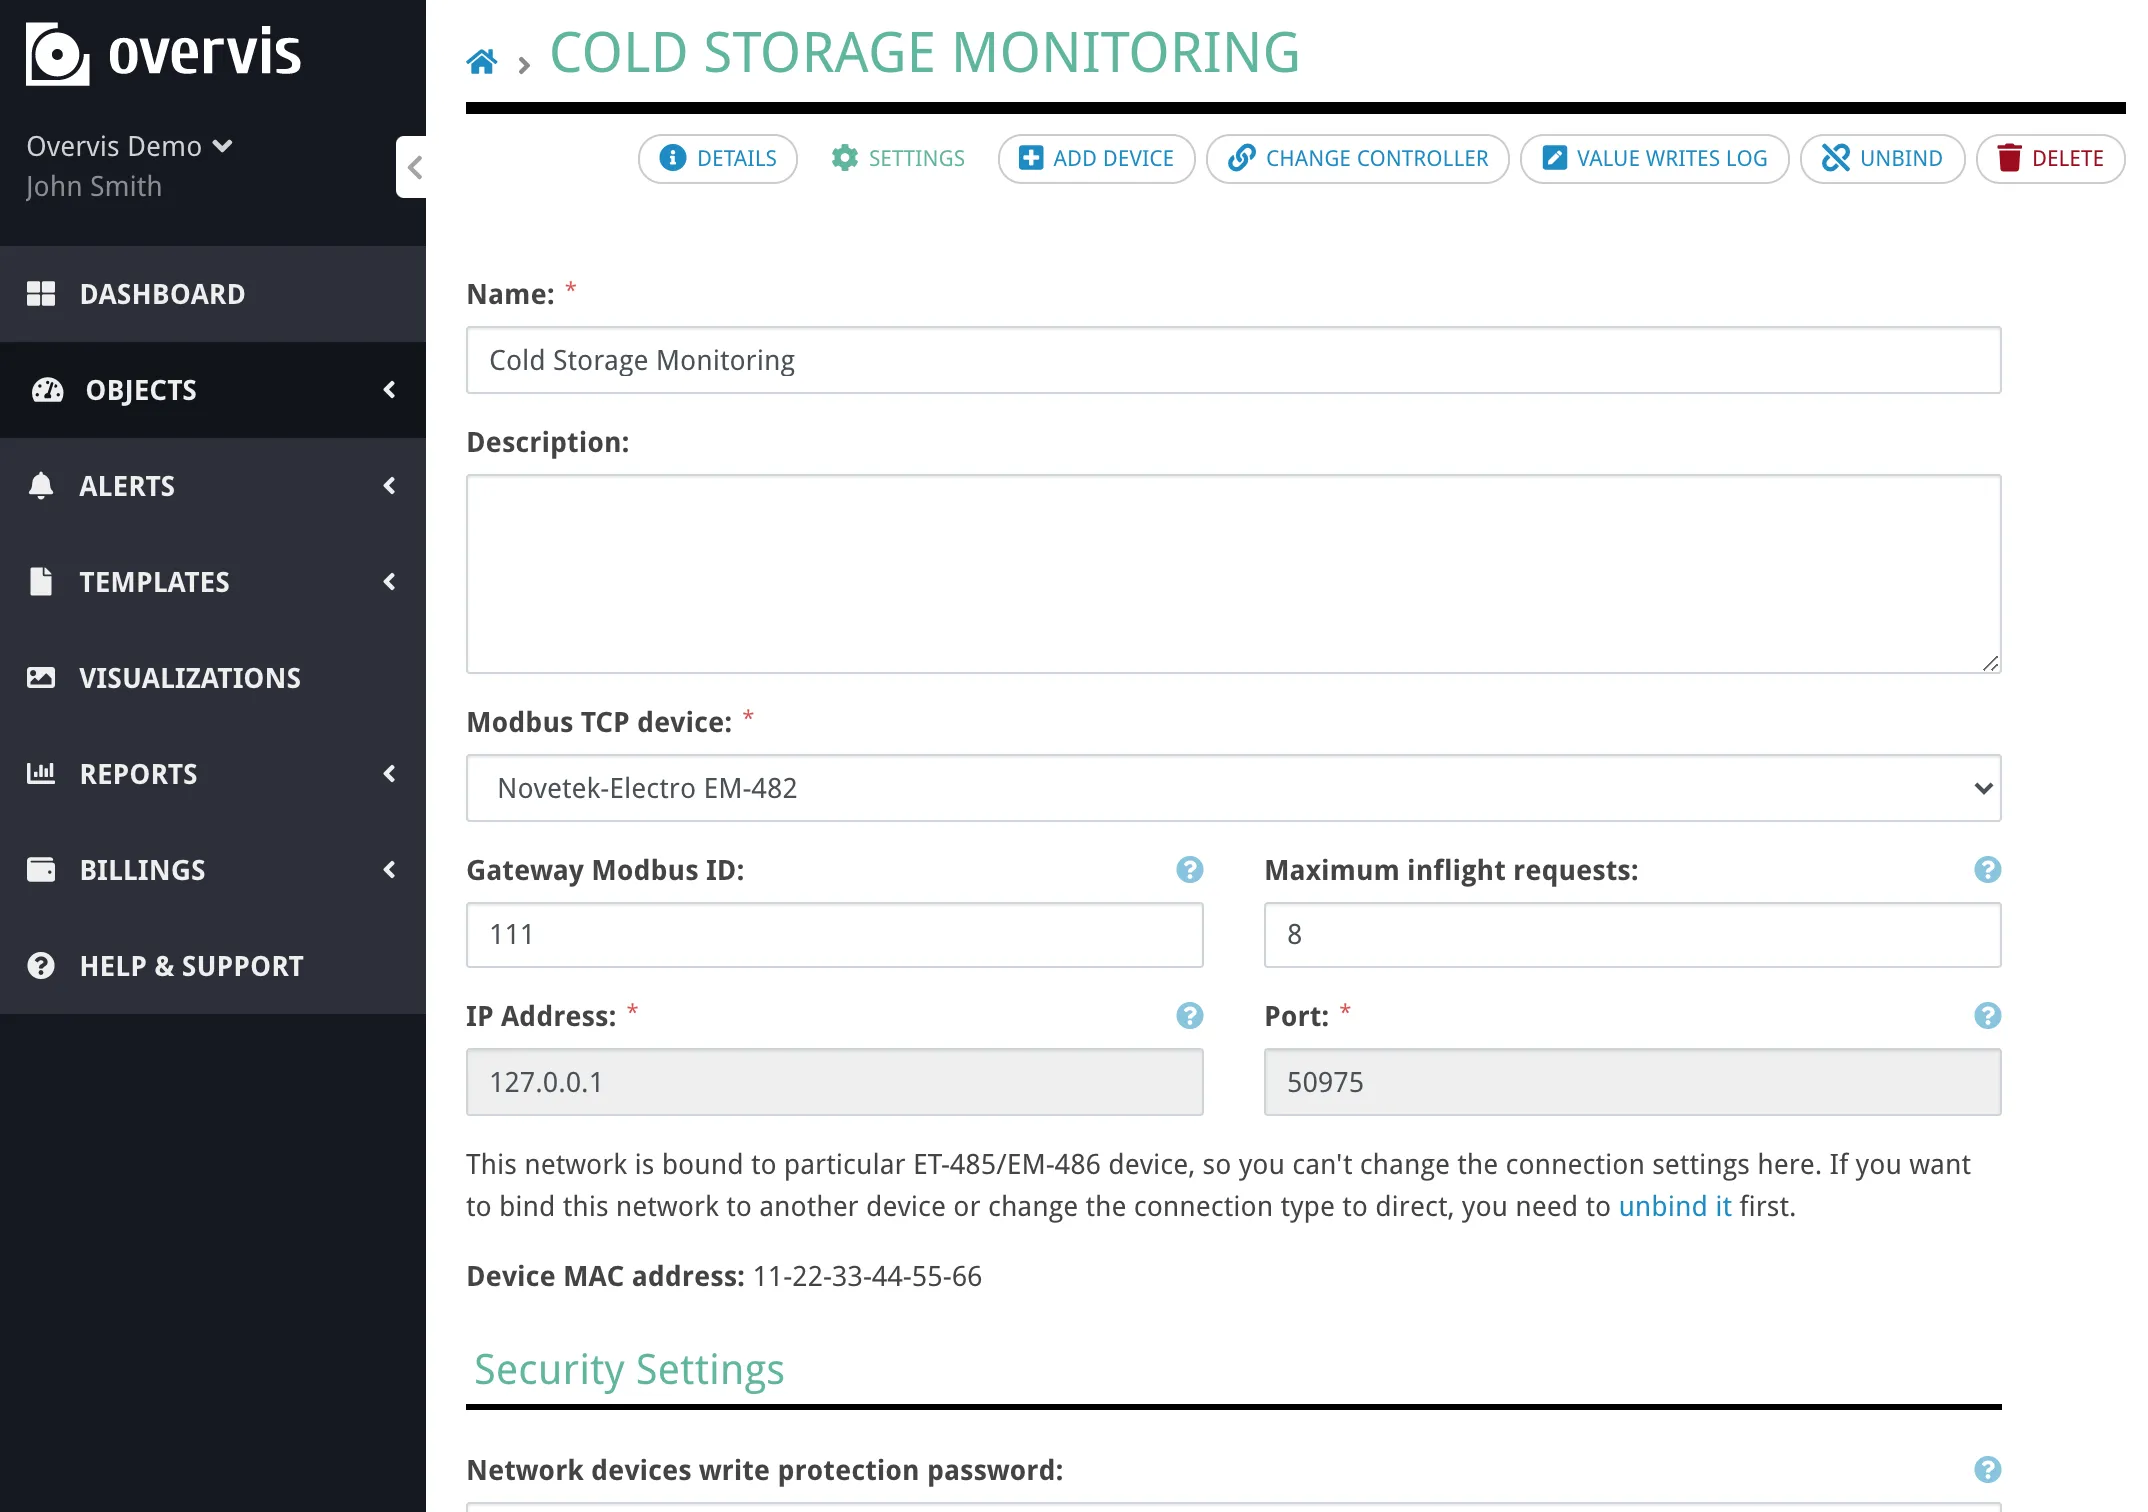
In this example, the network MAC address is 11-22-33-44-55-66. Note the addresses of all devices you’ll be displaying data from.
Step 5: Add Data Bindings
Section titled “Step 5: Add Data Bindings”With the static visualization in place, you can now connect it to live device data by editing the SVG code and adding special attributes.
Display Parameter Values
Section titled “Display Parameter Values”To display a device parameter value as text, add the param-value attribute to a text element. For example, to show the probe temperature from a fridge controller:
Find the text element in your SVG code (look for layer names you set earlier):
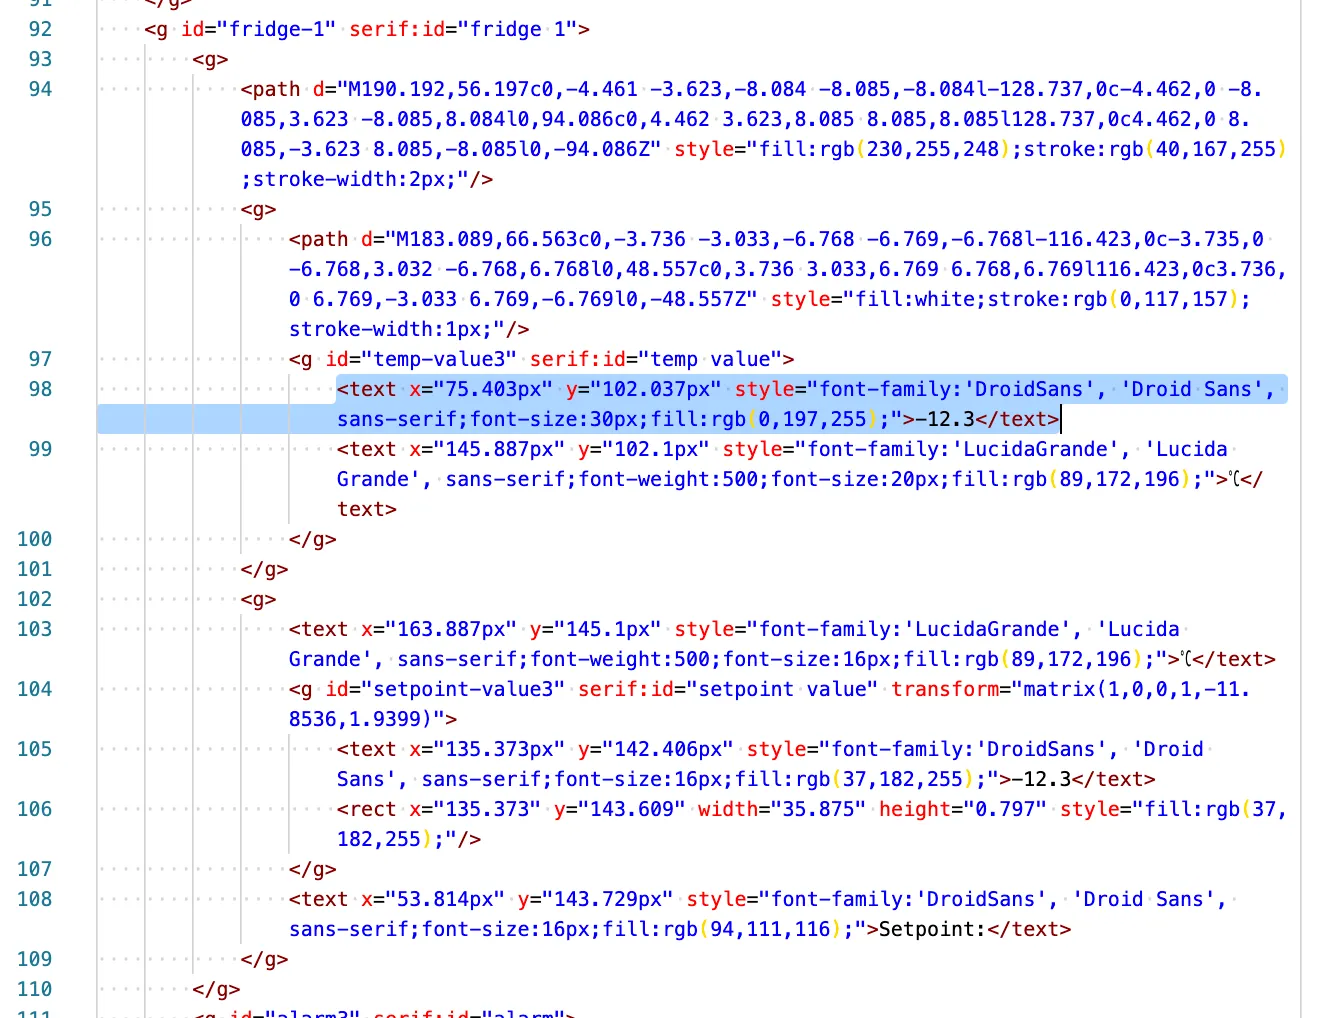
Modify the <text> tag:
<text x="75.403px" y="102.037px" style="font-family:'DroidSans', 'Droid Sans', sans-serif;font-size:30px;fill:rgb(0,197,255);" param-value="11-22-33-44-55-66>1>101:r">-</text>The param-value attribute format is: MAC>DEVICE_ADDRESS>PARAMETER_ADDRESS:OPTIONS
11-22-33-44-55-66- Network controller MAC address1- Device address on the network101- Parameter address (holding register):r- Read directly from device (real-time). Omit to use the last cached value from the database.:p{{number}}- Display with specified precision (e.g.,:p3for 3 decimal places)
Replace the placeholder text content with a dash or other temporary indicator that displays until data loads.
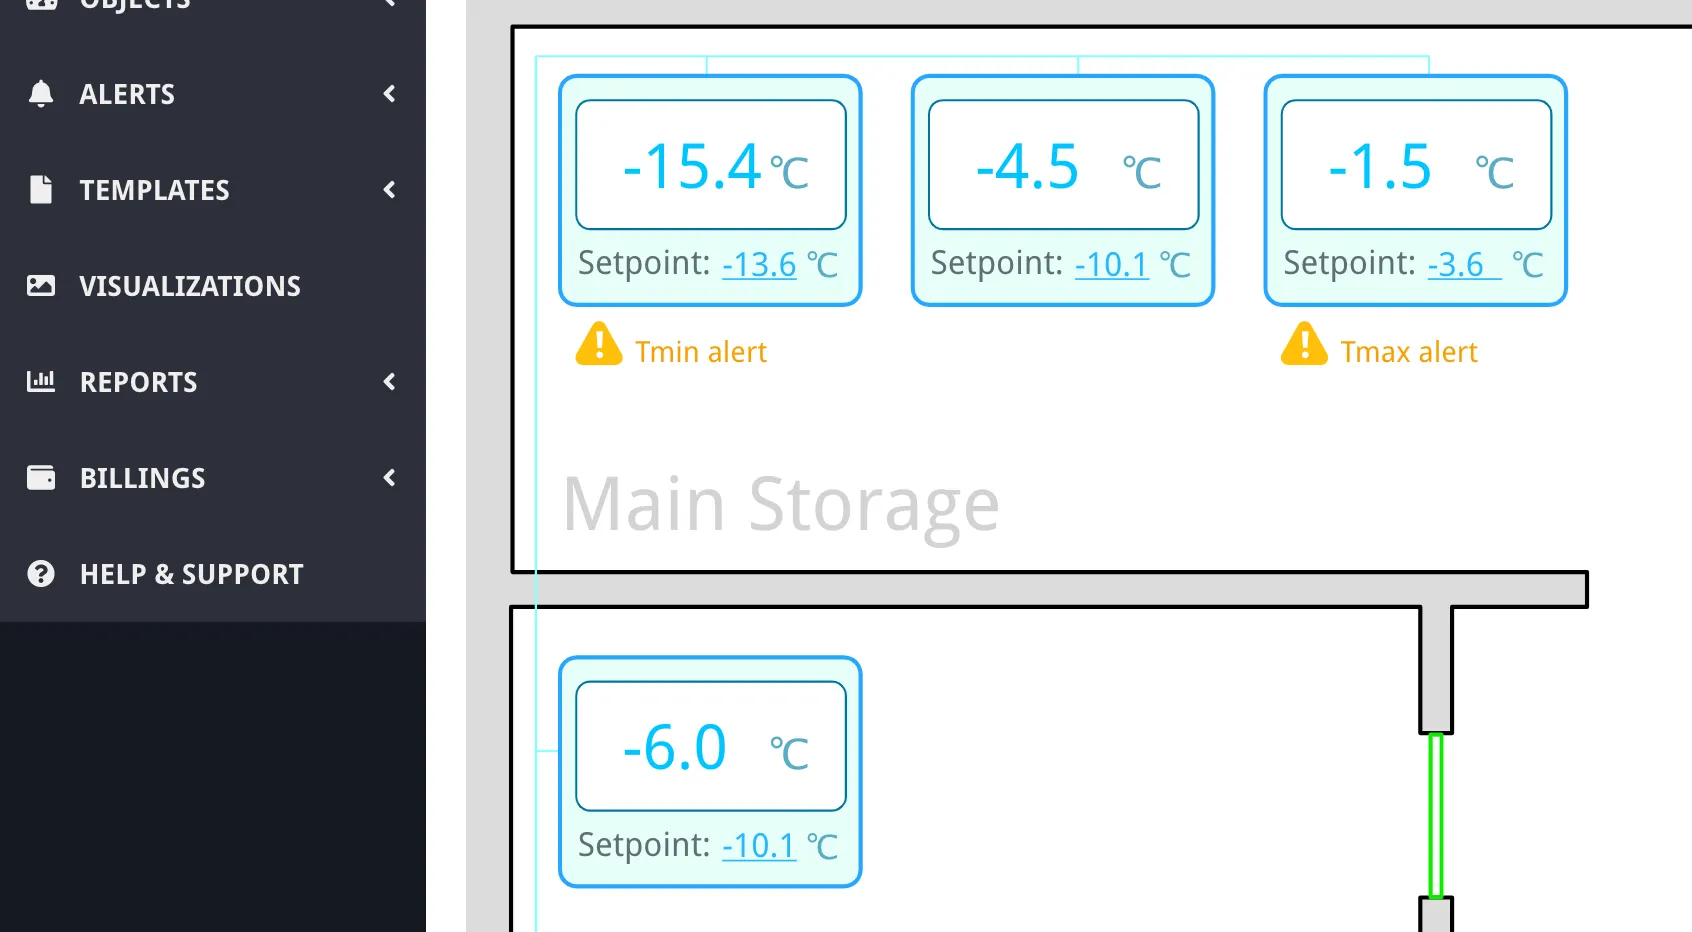
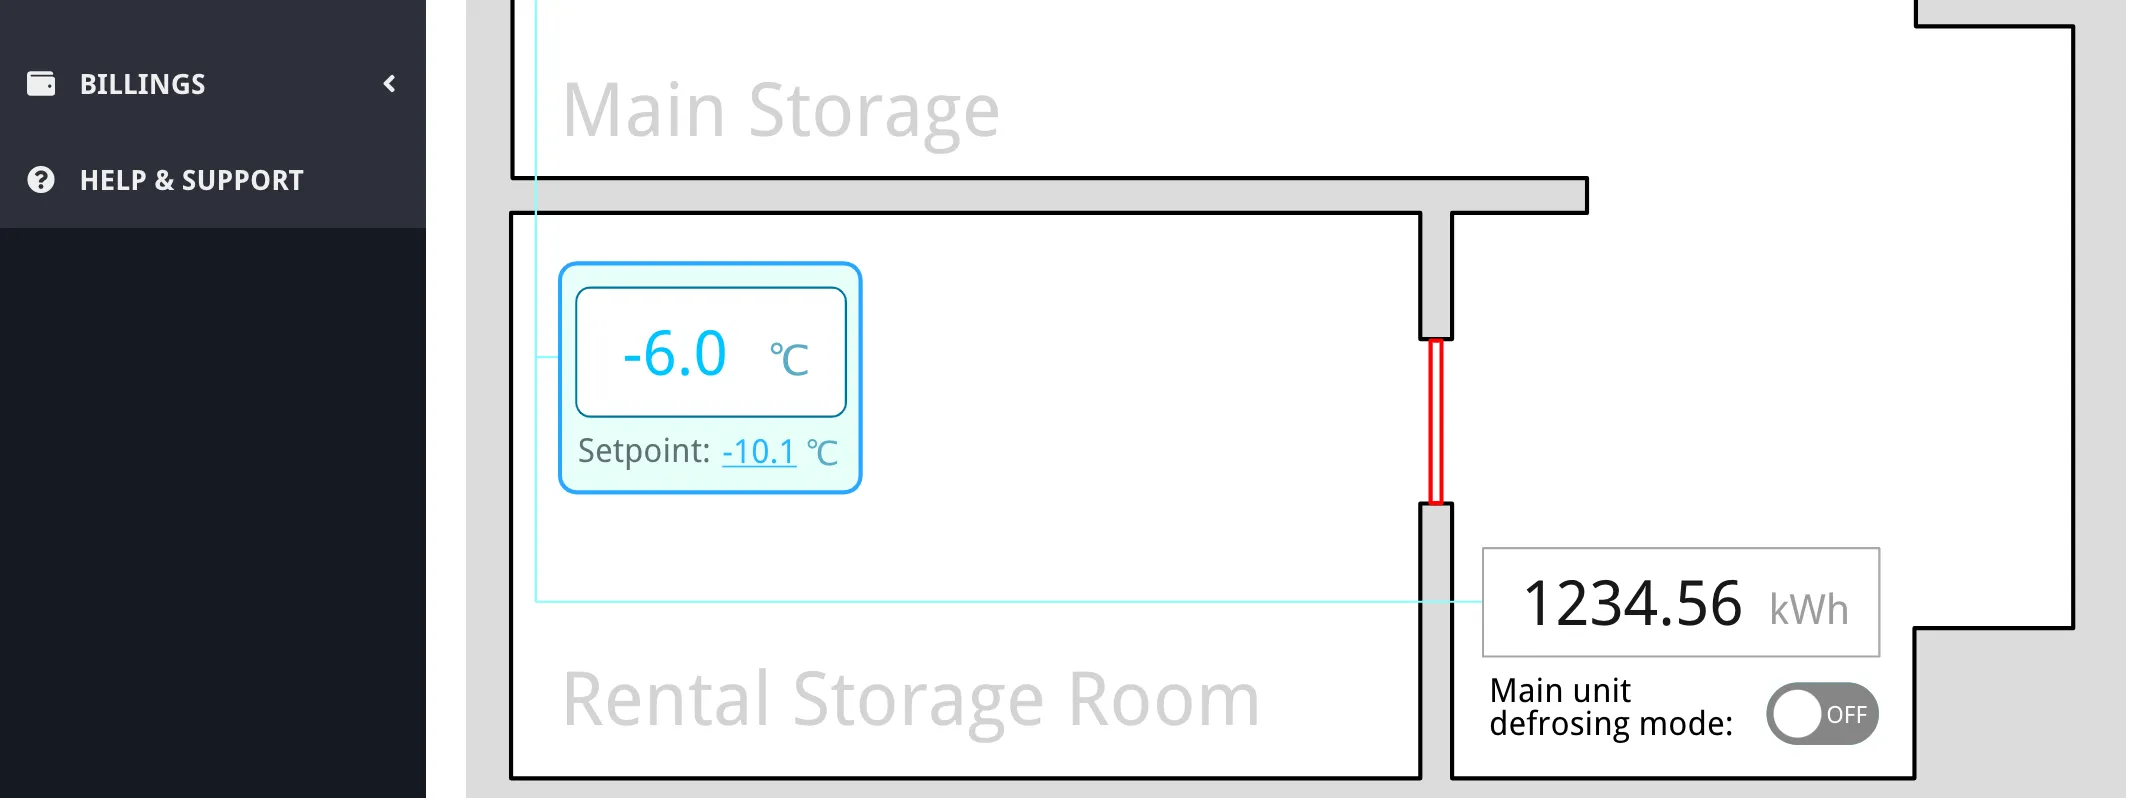
After updating all temperature displays, the visualization shows live data:
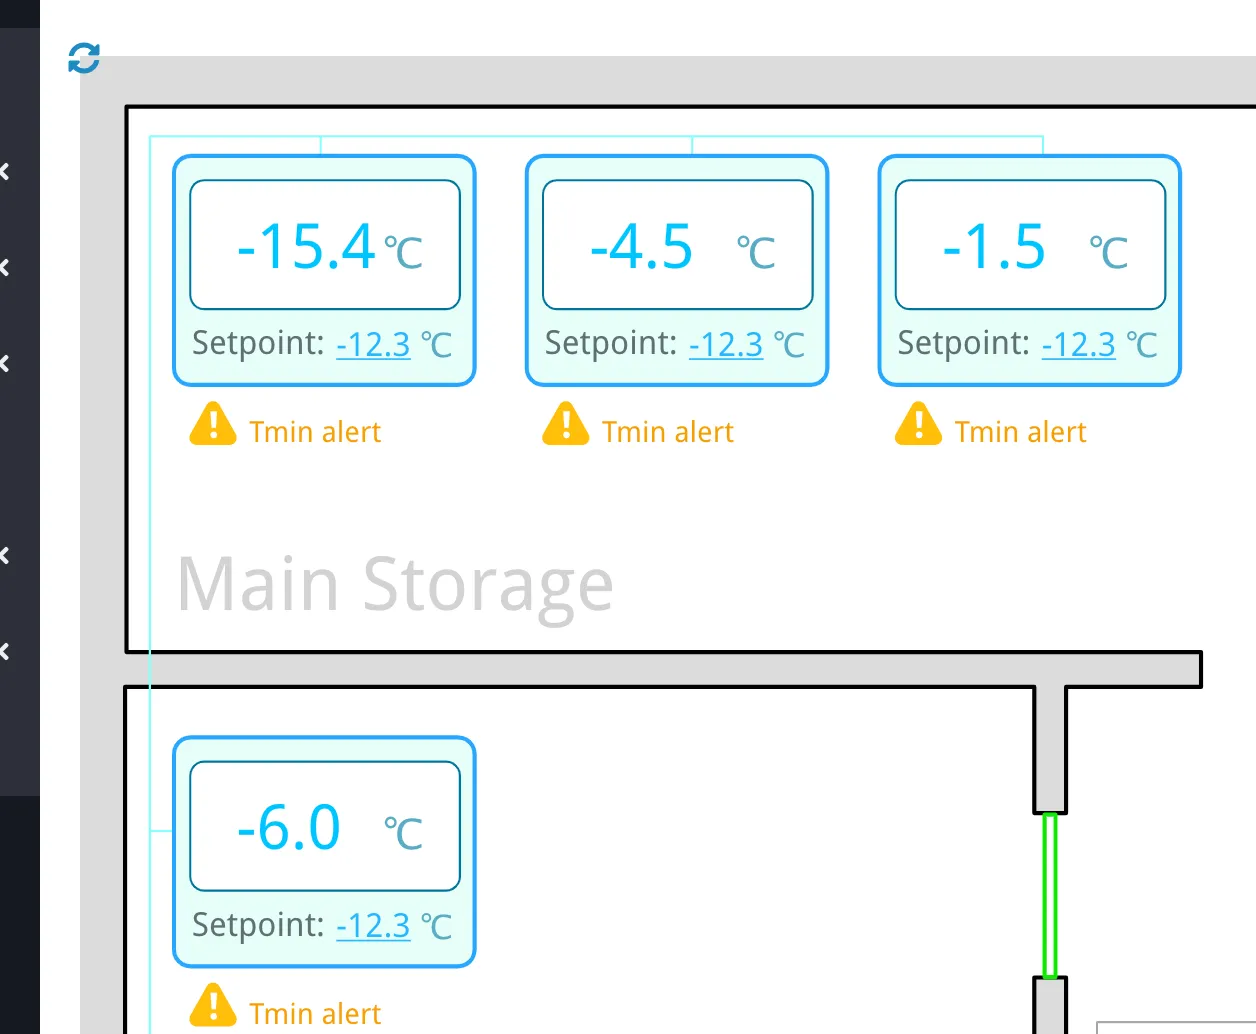
Data refreshes automatically every 10 seconds, or users can click the refresh icon for immediate updates.
Add Interactive Controls
Section titled “Add Interactive Controls”To let users modify device parameters by clicking on values, combine param-value with on-click:
Modify the setpoint text element:
<text x="135.373px" y="142.406px" style="font-family:'DroidSans', 'Droid Sans', sans-serif;font-size:16px;fill:rgb(37,182,255);cursor:pointer;" param-value="11-22-33-44-55-66>1>201:r" on-click="edit-param:11-22-33-44-55-66>1>201">-</text>The on-click="edit-param:..." attribute opens a dialog when clicked, allowing the user to enter a new value. After saving, Overvis writes the value to the device and updates the visualization.
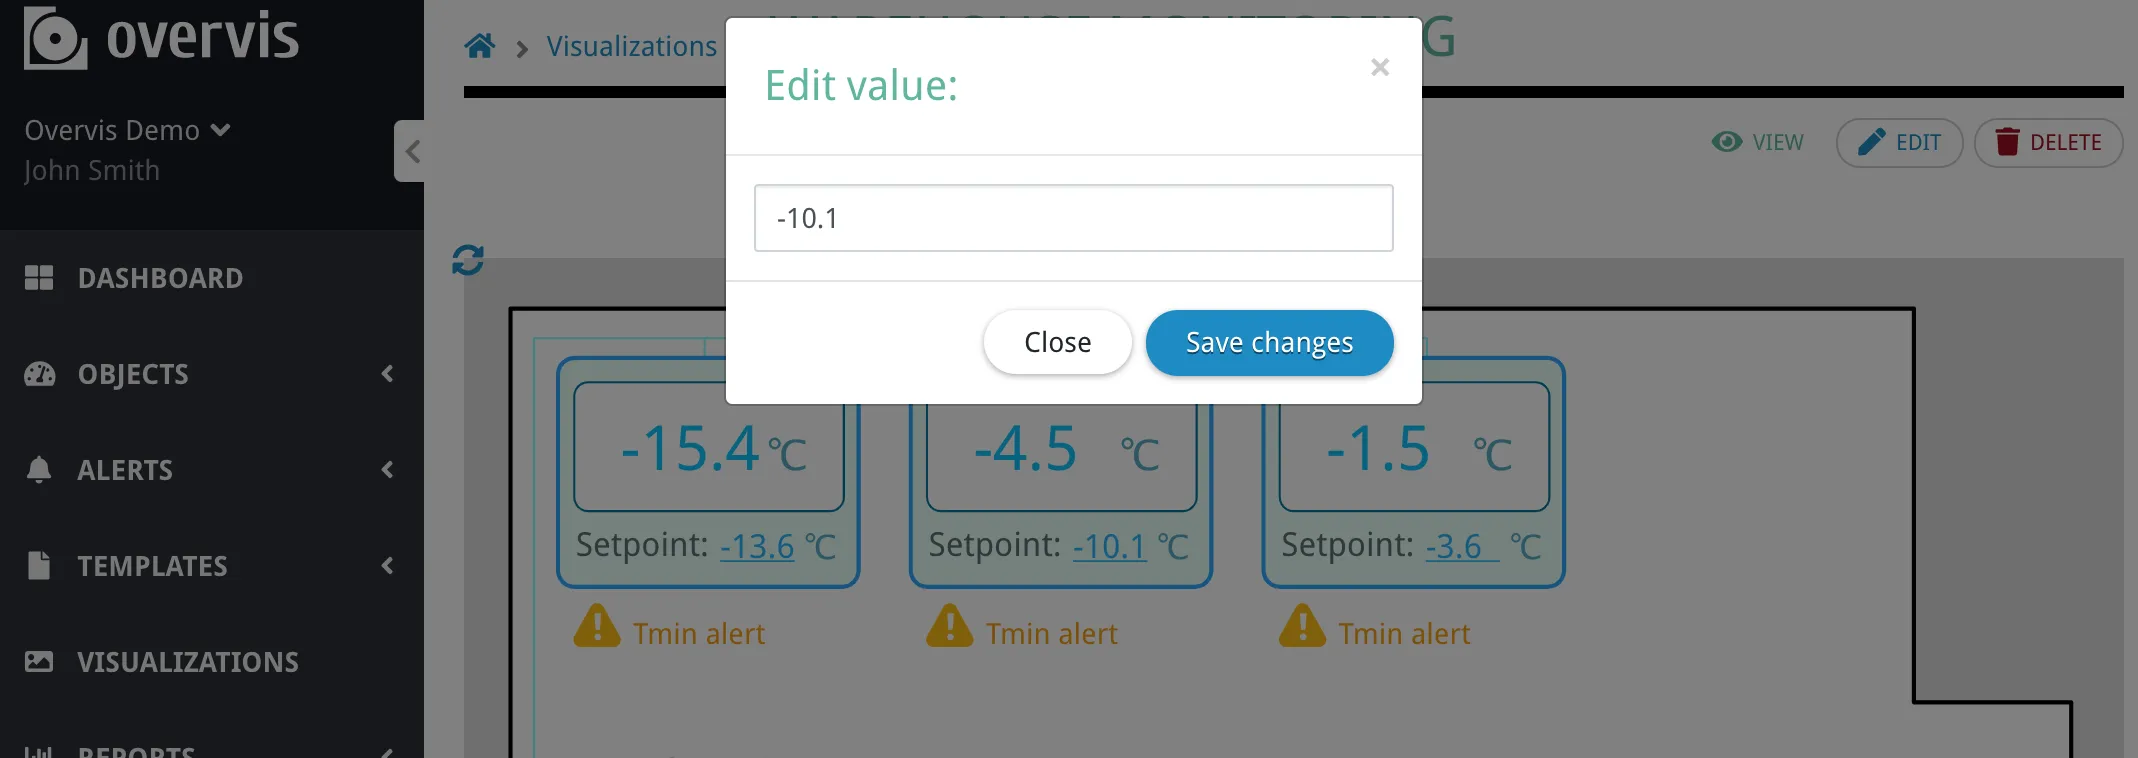
Adding cursor:pointer to the style makes the cursor change to indicate the element is clickable.
Show/Hide Elements Conditionally
Section titled “Show/Hide Elements Conditionally”Use on-param-value to show or hide elements based on parameter values. This is perfect for alarm indicators that should only appear when triggered:

Find the alarm indicator group in your SVG:
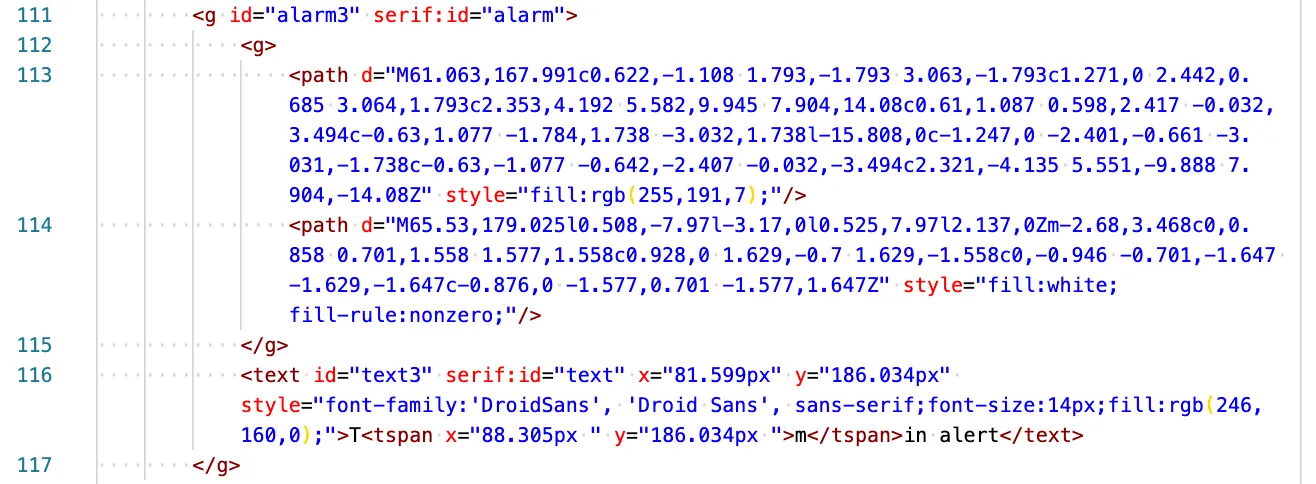
Modify the container <g> tag:
<g id="alarm3" serif:id="alarm" on-param-value="11-22-33-44-55-66>1>1d:=1:display:block:none:r" style="display:none;">The on-param-value attribute format is: PARAM_REF:CONDITION:PROPERTY:VALUE_ON:VALUE_OFF:OPTIONS
11-22-33-44-55-66>1>1d- Parameter reference (discrete input 1d):=1- Condition (equals 1):display- Style property to modify:block- Value when condition is true (show element):none- Value when condition is false (hide element):r- Read directly from device in real-time
Set the default style="display:none;" so the element is hidden initially. When the parameter equals 1, the display style changes to block, making the indicator visible.
Change Colors Based on Values
Section titled “Change Colors Based on Values”The same on-param-value technique works for changing element colors. For example, showing a door in red when open:
<rect id="door" x="464.852" y="365.301" width="5.254" height="78.242" style="fill:none;stroke:grey;stroke-width:2px;" on-param-value="11-22-33-44-55-66>11>500.2:=0:stroke:red:green:r" />This reads bit 2 of register 500 from device 11. When the value is 0 (door open), the stroke color is red. When 1 (door closed), it’s green.
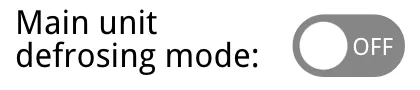
Create Toggle Switches
Section titled “Create Toggle Switches”Combine on-param-value with on-click for toggle switches. Design both states of the switch, then show one or the other based on the current value:
<g style="cursor:pointer;" on-click="toggle-param:11-22-33-44-55-66>20>105:0:1:g"> <g id="button-on" serif:id="button on" on-param-value="11-22-33-44-55-66>20>105:=1:display:block:none:r" style="display:none;"> <path d="M680.921,544.957c0,-8.316 -6.751,-15.067 -15.066,-15.067l-24.005,0c-8.315,0 -15.066,6.751 -15.066,15.067c0,8.315 6.751,15.066 15.066,15.066l24.005,0c8.315,0 15.066,-6.751 15.066,-15.066Z" style="fill:rgb(29,214,255);"/> <circle cx="666.032" cy="544.957" r="11.536" style="fill:white;"/> <text x="633.575px" y="549.415px" style="font-family:'DroidSans', 'Droid Sans', sans-serif;font-size:11.449px;fill:white;">ON</text> </g> <g id="button-off" serif:id="button off" on-param-value="11-22-33-44-55-66>20>105:=0:display:block:none:r" style="display:none;"> <path d="M680.921,544.957c0,-8.316 -6.751,-15.067 -15.066,-15.067l-24.005,0c-8.315,0 -15.066,6.751 -15.066,15.067c0,8.315 6.751,15.066 15.066,15.066l24.005,0c8.315,0 15.066,-6.751 15.066,-15.066Z" style="fill:rgb(134,134,134);"/> <circle cx="641.703" cy="544.957" r="11.536" style="fill:white;"/> <text x="655.519px" y="549.415px" style="font-family:'DroidSans', 'Droid Sans', sans-serif;font-size:11.449px;fill:white;">OFF</text> </g></g>Each state has on-param-value that shows it when the parameter matches (:=1 for ON, :=0 for OFF). The parent group has on-click="toggle-param:PARAM_REF:DEFAULT_VALUE:VALUE_ON:OPTIONS" that flips the parameter between 0 and 1 when clicked. The :g option at the end refreshes all visualization data after the change.

Store Custom Text
Section titled “Store Custom Text”To allow users to edit labels or names that aren’t stored in device registers, use the visualization’s own database storage. First, enable this feature by adding an attribute to the root <svg> tag:
<svg use-vis-data="yes" ...>Then mark text elements that should be editable and stored:
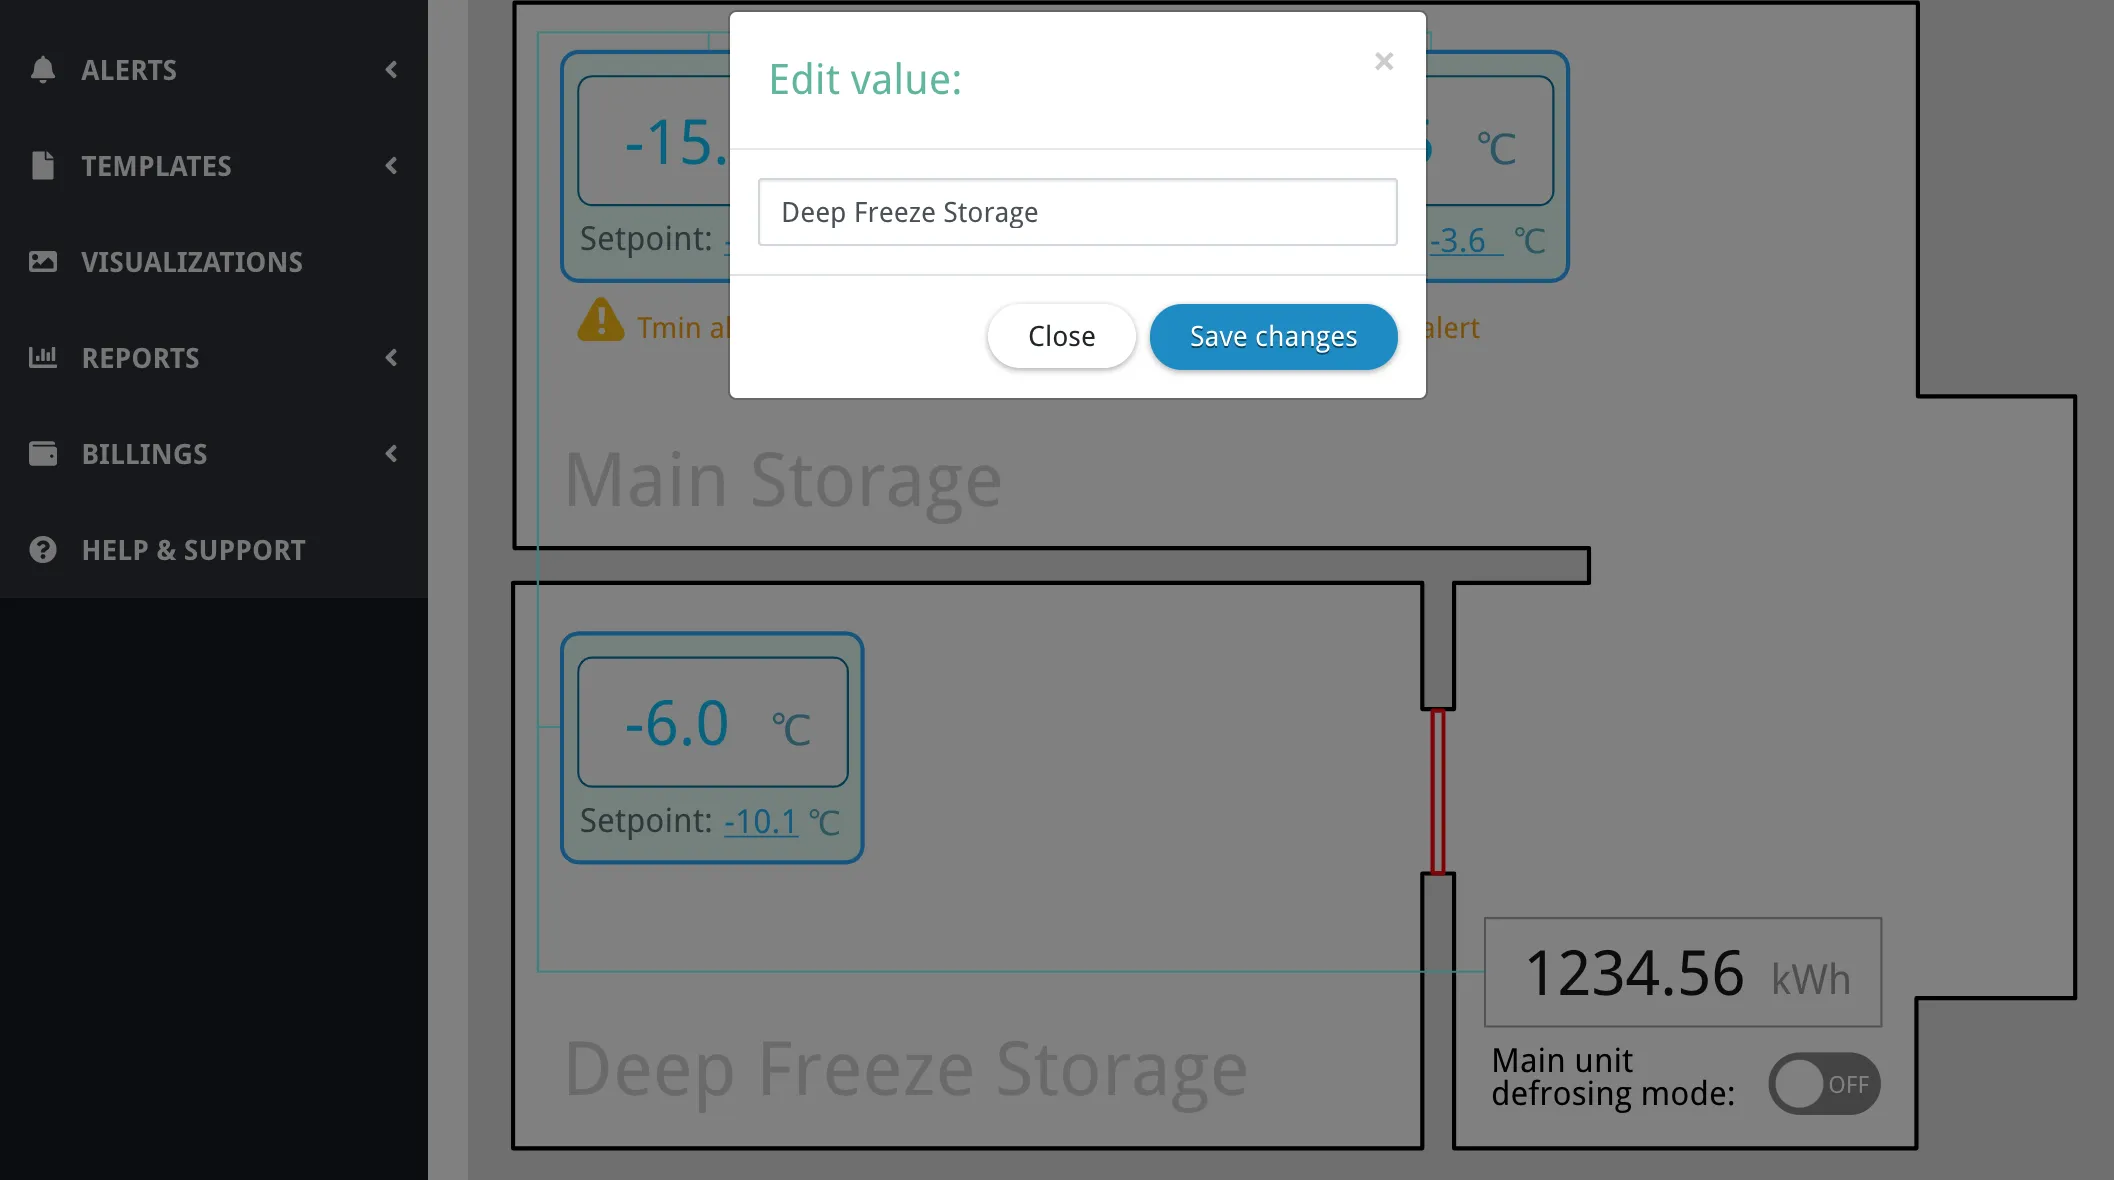
<text id="small-room-name" serif:id="small room name" x="45.195px" y="550.539px" style="font-family:'DroidSans', 'Droid Sans', sans-serif;font-size:36px;fill:rgb(211,211,211);" text-replacement="small-room-name" on-click="edit-visdata:small-room-name">Rental Storage Room</text>The text-replacement attribute specifies a storage key. The initial text content becomes the default value. When users click the element (due to on-click="edit-visdata:..."), they can edit and save a new value that persists in the database.
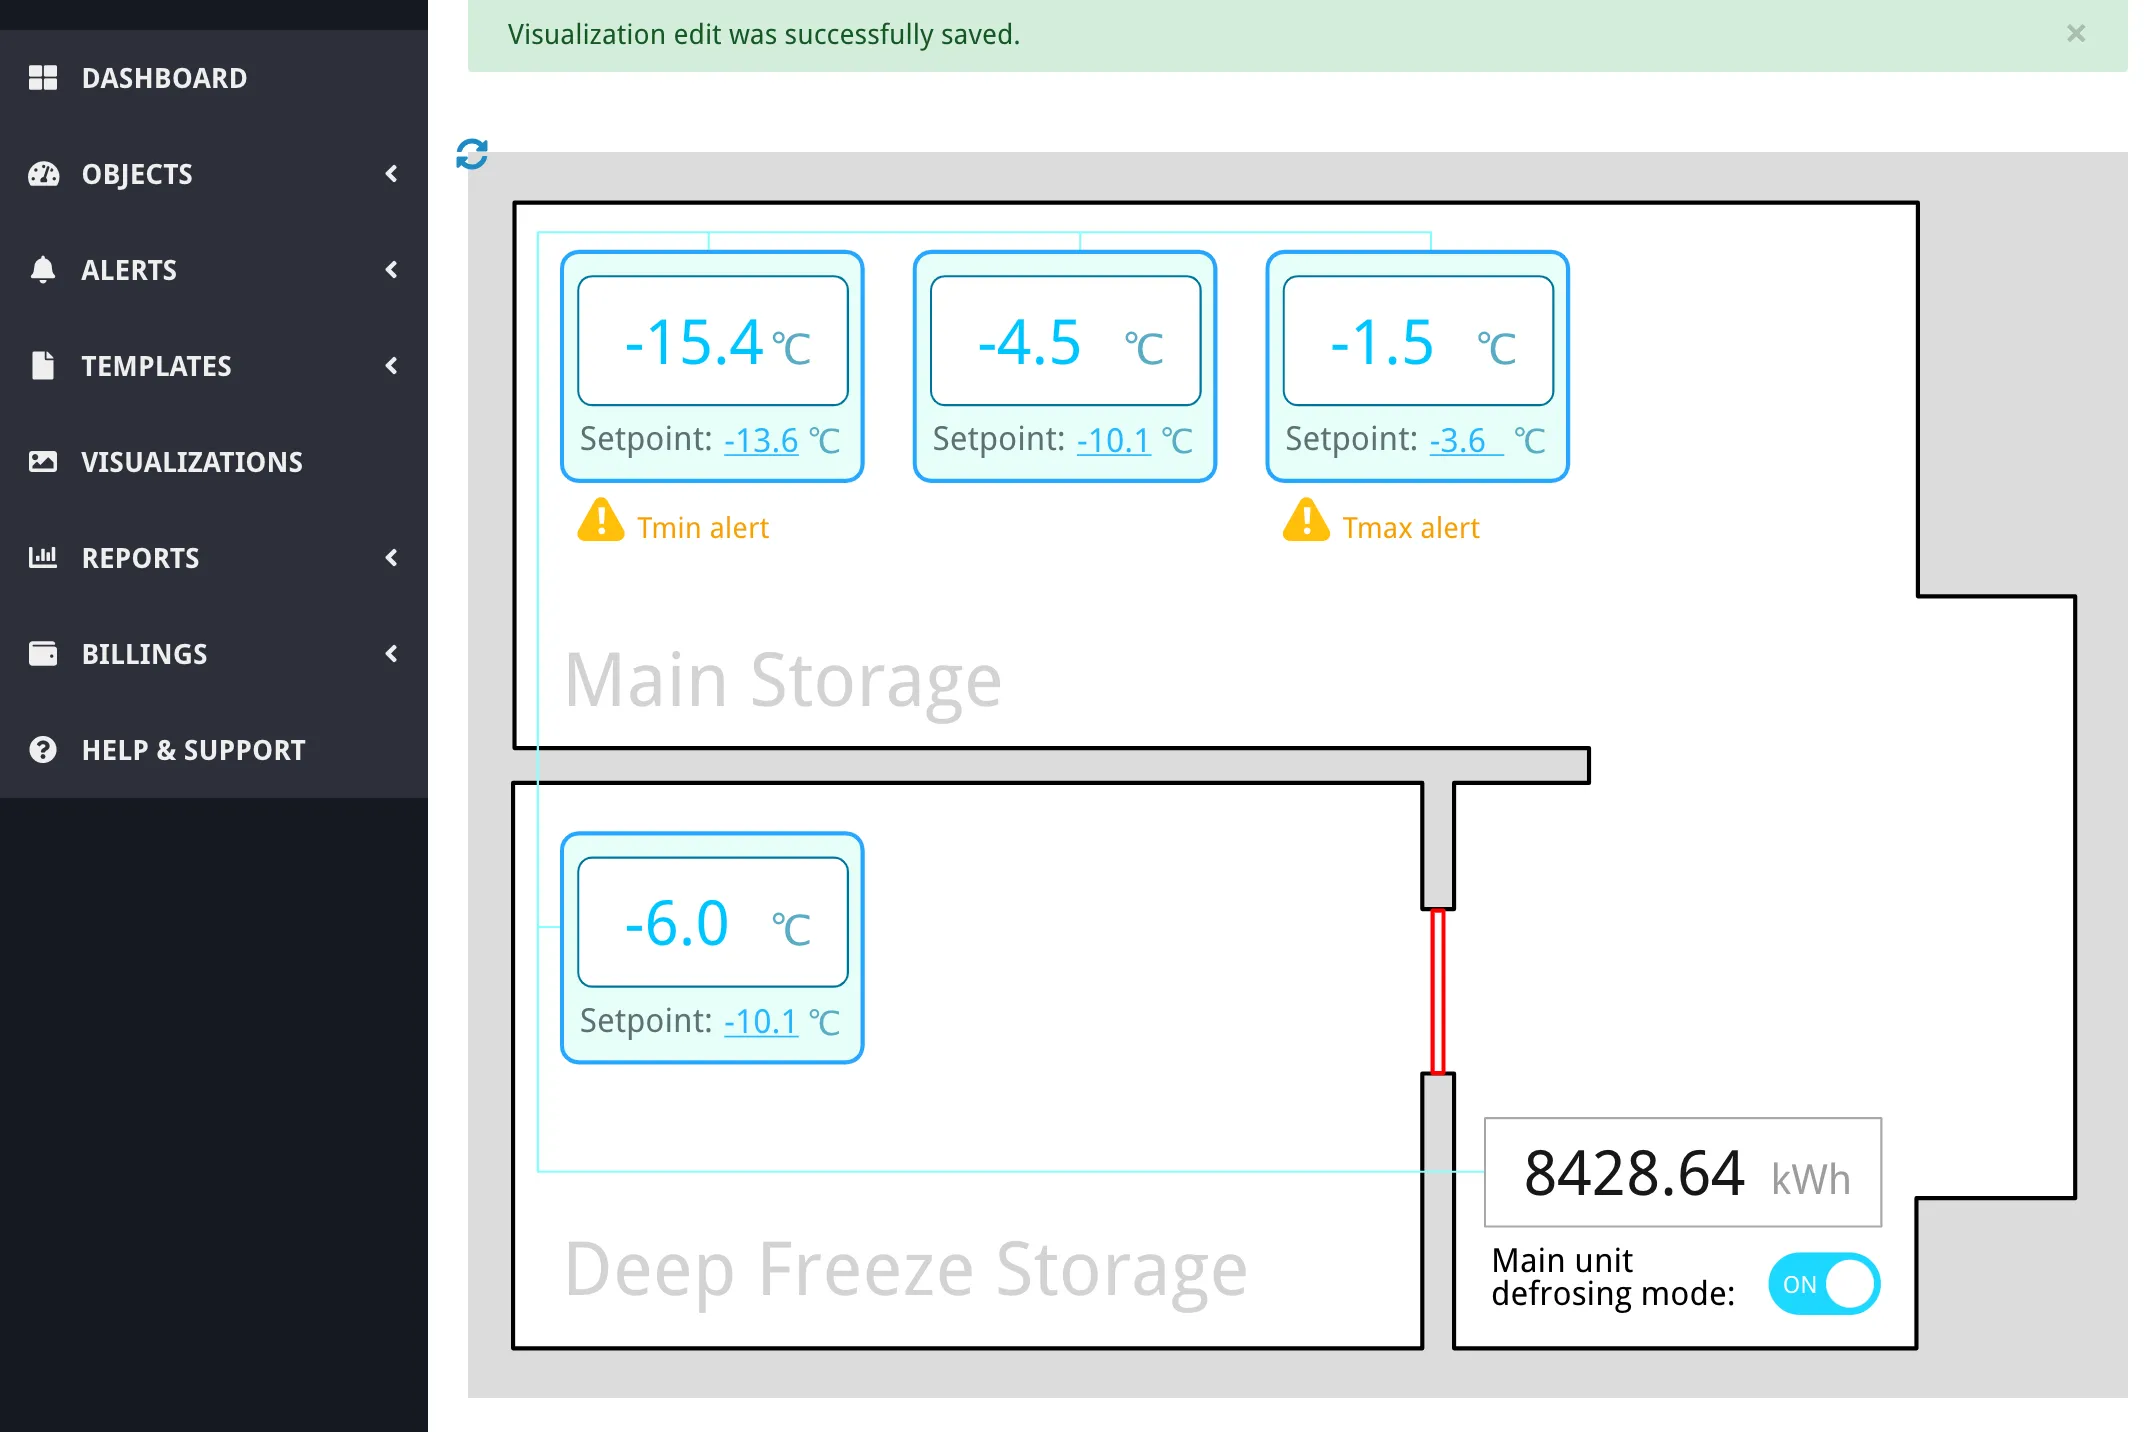
Step 6: Complete the Visualization
Section titled “Step 6: Complete the Visualization”Complete the visualization by adding the remaining data bindings. For the energy meter, display the value from the database rather than reading it directly from the device:
<text id="value" x="508.542px" y="502.132px" style="font-family:'DroidSans', 'Droid Sans', sans-serif;font-size:30px;fill:rgb(23,23,23);" param-value="11-22-33-44-55-66>10>1000">-</text>Notice there’s no :r flag. This reads the last value from the database (updated every 5 minutes) rather than polling the device directly. This reduces network load for values that don’t need real-time updates.
The completed visualization displays live equipment data, allows user interaction, and updates automatically:
Common Techniques
Section titled “Common Techniques”Configuration Settings
Section titled “Configuration Settings”You can configure visualization behavior by adding attributes to the first <svg> tag or any tag with the vis-settings class:
<svg update-period-sec="5" refresh-button="yes" use-vis-data="no"> <!-- Your visualization content --></svg>Available settings:
update-period-sec="{{number}}"- Refresh period in seconds (default: 10). Set to 0 to refresh immediately after each cycle completes.refresh-button="yes|no"- Show/hide the refresh button in the top-left corner (default: yes).use-vis-data="yes|no"- Enable loading of visualization strings table data (default: no).
Database vs. Real-Time Reads
Section titled “Database vs. Real-Time Reads”By default, param-value reads the last stored value from the database. Add the :r option to read directly from the device in real-time. Choose based on your needs:
Use database reads (no :r option) when:
- The value changes infrequently
- Exact real-time data isn’t critical
- You want to reduce network traffic and improve refresh speed
- Multiple visualizations display the same data
- The parameter is tracked in the system
Use real-time reads (:r option) when:
- You need the absolute current value
- The parameter changes frequently
- User interactions depend on immediate feedback
- Displaying control states that users just changed
- The parameter is not tracked in the system
Error Codes
Section titled “Error Codes”If a parameter value cannot be retrieved, special error codes are displayed:
NON- Parameter network does not existNOP- Parameter does not existNOLR- No last reading in the database (parameter never read or not tracked)NOPR- No parameter resolved for this realtime binding (misconfigured reference)NORV- Realtime read did not return a value (device error, timeout, or missingokin the operator response)
These codes help diagnose issues with data bindings and device connectivity.
Available Click Actions
Section titled “Available Click Actions”The on-click attribute supports these actions:
goto:param:{{paramRef}}- Open parameter historygoto:params:{{paramRef}},{{paramRef}},...- Open comparison of multiple parametersgoto:device:{{deviceRef}}- Open device parameters list pagegoto:network:{{networkRef}}- Open network pagegoto:vis:{{visualizationRef}}- Open another visualizationtoggle-param:{{paramRef}}:{{defaultValue}}:{{valueOn}}:{{options}}- Toggle parameter between two valuesedit-param:{{paramRef}}:{{options}}- Open dialog to edit parameter valueincrement-param:{{paramRef}}:{{amount}}:{{options}}- Add amount to parameter (can be negative)edit-visdata:{{key}}- Open dialog to edit visualization string
The :g option can be added to any action to refresh all visualization data after completion.
Custom Fonts
Section titled “Custom Fonts”While web-safe fonts and Droid Sans are available by default, you can add custom fonts with inline CSS:
<style> @import url("https://fonts.googleapis.com/css2?family=Roboto:wght@400;700&display=swap");</style><svg> <text style="font-family:'Roboto', sans-serif;">Custom Font Text</text></svg>Responsive Layouts
Section titled “Responsive Layouts”Make visualizations adapt to different screen sizes by using percentage-based sizing and the preserveAspectRatio attribute:
<svg width="100%" height="100%" viewBox="0 0 800 600" preserveAspectRatio="xMidYMid meet"> <!-- Your content --></svg>Multiple Alarm Indicators
Section titled “Multiple Alarm Indicators”When displaying multiple alarms simultaneously, create separate indicator elements for each alarm type and position them to avoid overlap. Use individual on-param-value bindings for each. For complex alarm scenarios, consider using JavaScript to dynamically position indicators.
Advanced: JavaScript Integration
Section titled “Advanced: JavaScript Integration”While data bindings handle most common scenarios, you can use JavaScript for advanced functionality. Visualizations run in the context of the Overvis web page, giving you access to the full browser API and Overvis-specific functions.
Accessing the Overvis API
Section titled “Accessing the Overvis API”To make authenticated API calls from your visualization, you need to include the session token. The token is stored in browser storage and accessible via JavaScript.
Use the preInitViz() function to execute code before the visualization initializes. This is useful for fetching data from the API or setting up custom logic:
<script>    window.preInitViz = function (callback) {        // Get the authentication token from session storage        const token = sessionStorage.getItem("auth_token");
        // Fetch data from Overvis API        fetch("https://ocp.overvis.com/api/v1/org/1/nets/", {            headers: {                "Content-Type": "application/json",                Authorization: "token " + token,            },        })            .then((response) => response.json())            .then((data) => {                console.log("Networks:", data);
                // Process the data and update your visualization                document.getElementById("network-count").textContent = data.length;
                // Always call the callback when done                callback();            })            .catch((error) => {                console.error("API error:", error);                callback();            });    };</script>
<div>Total networks: <span id="network-count">Loading...</span></div>
Handling Real-Time Updates
Section titled “Handling Real-Time Updates”The onVizUpdate() function is called every time the visualization refreshes with new data:
<script>    window.onVizUpdate = function (data) {        // data contains all parameter values from data bindings        console.log("Visualization updated with data:", data);
        // Perform custom calculations or transformations        const temp1 = parseFloat(data["12-34-56-78-90-ab>1>101"]);        const temp2 = parseFloat(data["12-34-56-78-90-ab>1>102"]);        const average = (temp1 + temp2) / 2;
        // Update custom elements        document.getElementById("avg-temp").textContent = average.toFixed(1);    };</script>
<div>Average temperature: <span id="avg-temp">-</span>°C</div>
Writing Parameter Values Programmatically
Section titled “Writing Parameter Values Programmatically”Use the writeParamValue() function to send values to devices from JavaScript:
<script>    function setSetpoint(value) {        writeParamValue(            "12-34-56-78-90-ab>1>201", // Parameter reference            value.toString(), // Value as string            function (result) {                // Callback                if (result.ok) {                    console.log("Write successful:", result);                } else {                    console.error("Write failed:", result.err);                }            },            true, // Refresh all visualization data after write        );    }</script>
<button onclick="setSetpoint(18)">Set to 18°C</button><button onclick="setSetpoint(20)">Set to 20°C</button><button onclick="setSetpoint(22)">Set to 22°C</button>
Fetching Historical Data
Section titled “Fetching Historical Data”To display charts or analyze trends, fetch historical readings from the API:
<script>    window.preInitViz = function (callback) {        const token = sessionStorage.getItem("auth_token");
        // Request dispersed readings for charting        fetch("https://ocp.overvis.com/api/v1/readings/dispersed/", {            method: "POST",            headers: {                "Content-Type": "application/json",                Authorization: "token " + token,            },            body: JSON.stringify({                paramIds: [547, 545], // Parameter system IDs                from: new Date(Date.now() - 24 * 60 * 60 * 1000).toISOString(), // Last 24 hours                till: new Date().toISOString(),                points: 100, // 100 data points            }),        })            .then((response) => response.json())            .then((data) => {                console.log("Historical data:", data);                // Use data to render a chart                renderChart(data);                callback();            })            .catch((error) => {                console.error("Error fetching data:", error);                callback();            });    };
function renderChart(data) { // Implement chart rendering logic here // Can use libraries like Chart.js, D3.js, etc. }</script>Example: Google Maps Integration
Section titled “Example: Google Maps Integration”You can embed interactive Google Maps to display equipment locations with real-time status indicators.
<script src="https://maps.googleapis.com/maps/api/js?key=YOUR_API_KEY"></script>
<div id="map" style="height: 600px;"></div>
<!-- Hidden divs for data binding --><div style="display:none;">    <div id="net1-conn" on-net-connection="aa-bb-cc-dd-ee-ff:opacity:1:0"></div>    <div id="net1-relay" param-value="aa-bb-cc-dd-ee-ff>111>160.0:r"></div>    <div id="net1-alarm" param-value="aa-bb-cc-dd-ee-ff>1>240.0:r"></div></div>
<script>    // Define marker locations and network references    const locations = [        {            lat: 40.7128,            lng: -74.006,            label: "Location 1",            netKey: "net1",            netMac: "aa-bb-cc-dd-ee-ff",            url: "/manage/network/location-1/",        },        // Add more locations...    ];
    let map,        markers = [];
    window.preInitViz = function (callback) {        // Initialize map        map = new google.maps.Map(document.getElementById("map"), {            center: { lat: 40.7128, lng: -74.006 },            zoom: 13,        });
        // Create markers        locations.forEach((loc) => {            const marker = new google.maps.Marker({                position: { lat: loc.lat, lng: loc.lng },                map: map,                title: loc.label,                label: loc.label,            });
            marker.addListener("click", () => {                window.location.href = loc.url;            });
            markers.push({ marker, netKey: loc.netKey });        });
        callback();    };
    window.onVizUpdate = function (data) {        markers.forEach((m) => {            const connected = parseInt(                data[`conn?${locations.find((l) => l.netKey === m.netKey).netMac}`],            );            const relay = parseInt(                data[`${locations.find((l) => l.netKey === m.netKey).netMac}>111>160.0:r`],            );            const alarm = parseInt(                data[`${locations.find((l) => l.netKey === m.netKey).netMac}>1>240.0:r`],            );
            // Update marker color based on status            let icon = null;            if (alarm === 1) {                icon = "http://maps.google.com/mapfiles/ms/icons/red-dot.png";            } else if (relay === 1) {                icon = "http://maps.google.com/mapfiles/ms/icons/yellow-dot.png";            } else if (connected === 1) {                icon = "http://maps.google.com/mapfiles/ms/icons/green-dot.png";            } else {                icon = "http://maps.google.com/mapfiles/ms/icons/grey-dot.png";            }
            m.marker.setIcon(icon);        });    };</script>
Status Indicators
Section titled “Status Indicators”The example uses color-coded markers:
- Red: Alarm active
- Yellow: Equipment working (relay on)
- Green: Connected, normal operation
- Grey: Disconnected
You can customize marker appearance using custom icons, SVG graphics, or the Google Maps marker customization API.
Common Issues
Section titled “Common Issues”Visualization doesn’t update
Check that the refresh interval is configured correctly, verify parameter addresses match your device configuration, and confirm devices are online and responding. Use your browser’s developer console (F12) to check for JavaScript errors.
Data shows error codes (NOLR, NOPR, NORV, etc.)
NOLR(No Last Reading) - Parameter has never been read or not tracked. Mark it as “tracked” in device settings or add:roption for real-time reads.NOPR(No Parameter for realtime) - The realtime slot could not resolve a parameter. Check that the parameter reference in the visualization is valid.NORV(No realtime value) - The realtime read did not return a value. Check device connectivity and try reading the parameter on the device parameters page to see the actual error.NON(No Network) - Referenced network doesn’t exist or you don’t have access.NOP(No Parameter) - Referenced parameter doesn’t exist in the device.
Interactive elements don’t work
Verify on-click syntax matches the documentation. Ensure cursor:pointer is in the style attribute. Check that another element isn’t covering the clickable element (SVG layer order matters).
Styling looks wrong
Confirm your SVG export didn’t convert text to curves. Use inline styles within SVG elements to avoid conflicts with page CSS. Validate SVG structure using an SVG validator tool.
Refresh is slower than expected
If you’re reading many parameters with the :r option (real-time reads), each one requires a device query. The next refresh cycle doesn’t start until the previous one finishes. Use database reads (without :r) for non-critical values to optimize refresh cycle time, or increase the update-period-sec setting.
Frequently Asked Questions
Section titled “Frequently Asked Questions”Can I use external JavaScript libraries like Chart.js or D3.js?
Yes. Include them via CDN in a <script> tag at the beginning of your visualization source code. However, be aware that large libraries may slow down page loading.
Can I create multi-page visualizations?
Visualizations are single-page by design, but you can simulate multiple pages using JavaScript to show/hide different sections, or create multiple separate visualizations and link between them using on-click="goto:vis:...".
How do I debug visualization JavaScript?
Use your browser’s Developer Tools (F12). Console logs, breakpoints, and network inspection work normally. Check the console for errors related to API calls or data binding issues.
Can visualizations access data from multiple organizations?
No. Each visualization belongs to one organization and can only access data from networks and devices within that organization. The API enforces this through authentication tokens.
What’s the difference between parameter system ID and parameter address?
Parameter address is the Modbus register address on the device (e.g., 101). System ID is Overvis’s internal database identifier for that parameter. Use addresses in references like 12-34-56-78-90-ab>1>101, or use system IDs with the # prefix: #1234567.
Can I style visualizations with custom CSS frameworks?
Yes, but include the framework’s CSS file in a <style> or <link> tag. Be aware that the Overvis page has its own styles that might conflict. Use specific selectors or inline styles to avoid issues.
How do I handle time zones?
All dates from the Overvis API are in UTC. Use JavaScript’s Date object and toLocaleString() to convert to the user’s local time zone, or specify a particular time zone if needed.
Technical Reference
Section titled “Technical Reference”For complete technical details on all available attributes, parameter reference formats, and advanced options:
- Visualizations Reference - Complete attribute reference and syntax
- API Documentation - REST API for JavaScript-enhanced visualizations
Related Documentation
Section titled “Related Documentation”- Getting Started - Your first steps with Overvis Cloud
- Connecting Devices - How to connect equipment
- Networks, Devices & Parameters - Understanding the equipment hierarchy
- Alerts - Setting up monitoring and notifications
Get Help
Section titled “Get Help”If you need assistance creating Overvis visualizations, contact us at support@overvis.com. We’re happy to help with custom visualizations, answer questions about advanced features, or clarify documentation.