Overvis Cloud Documentation
https://www.overvis.com/docs/en/cloud/
2026-07-30
| |
|---|
Overvis Cloud OverviewOvervis Cloud is a comprehensive IoT platform for monitoring and controlling industrial equipment. Connect Modbus devices, visualize data in real-time, configure alerts, and integrate with your systems via API. Key CapabilitiesSection titled “Key Capabilities”
Common Use CasesSection titled “Common Use Cases”
Quick StartSection titled “Quick Start”
DocumentationSection titled “Documentation”Getting StartedSection titled “Getting Started”
FeaturesSection titled “Features”
ManagementSection titled “Management”
SupportSection titled “Support”
|
| |
|---|
Getting StartedOvervis Cloud is an industrial IoT platform for remote monitoring and control of equipment via the Modbus protocol. It connects your field devices — temperature controllers, energy meters, PLCs, sensors — to the cloud, giving you real-time data access, historical logging, alerts, and remote control from anywhere with a web browser. The guide is intended for engineers, integrators, and automation enthusiasts who are familiar with Modbus and industrial equipment, but new to the Overvis platform. For detailed connection troubleshooting and alternative connection methods, see Connecting Equipment. For platform features like alerts, visualizations, and reports, see the Overvis Cloud documentation. What You NeedSection titled “What You Need”To follow this guide, you will need:
You may also need:
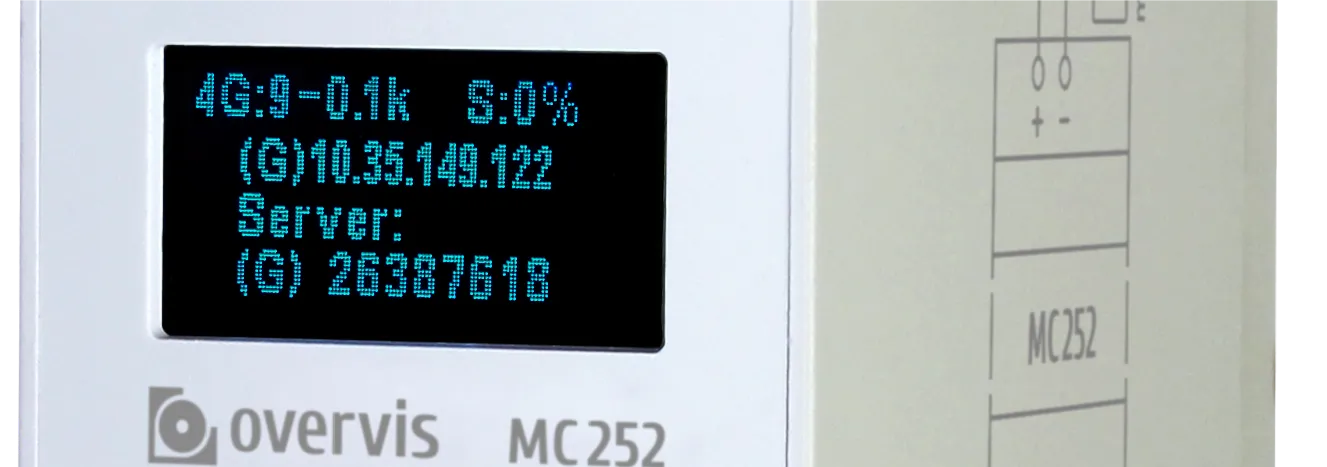
Step 1: Connect the Controller to the InternetSection titled “Step 1: Connect the Controller to the Internet”Before you can register a controller in Overvis, it must be powered on and connected to the internet. The steps below are for the Overvis MC252. Other Overvis-compatible controllers with a PIN code label follow a similar process — for specifics, refer to the controller’s manual.
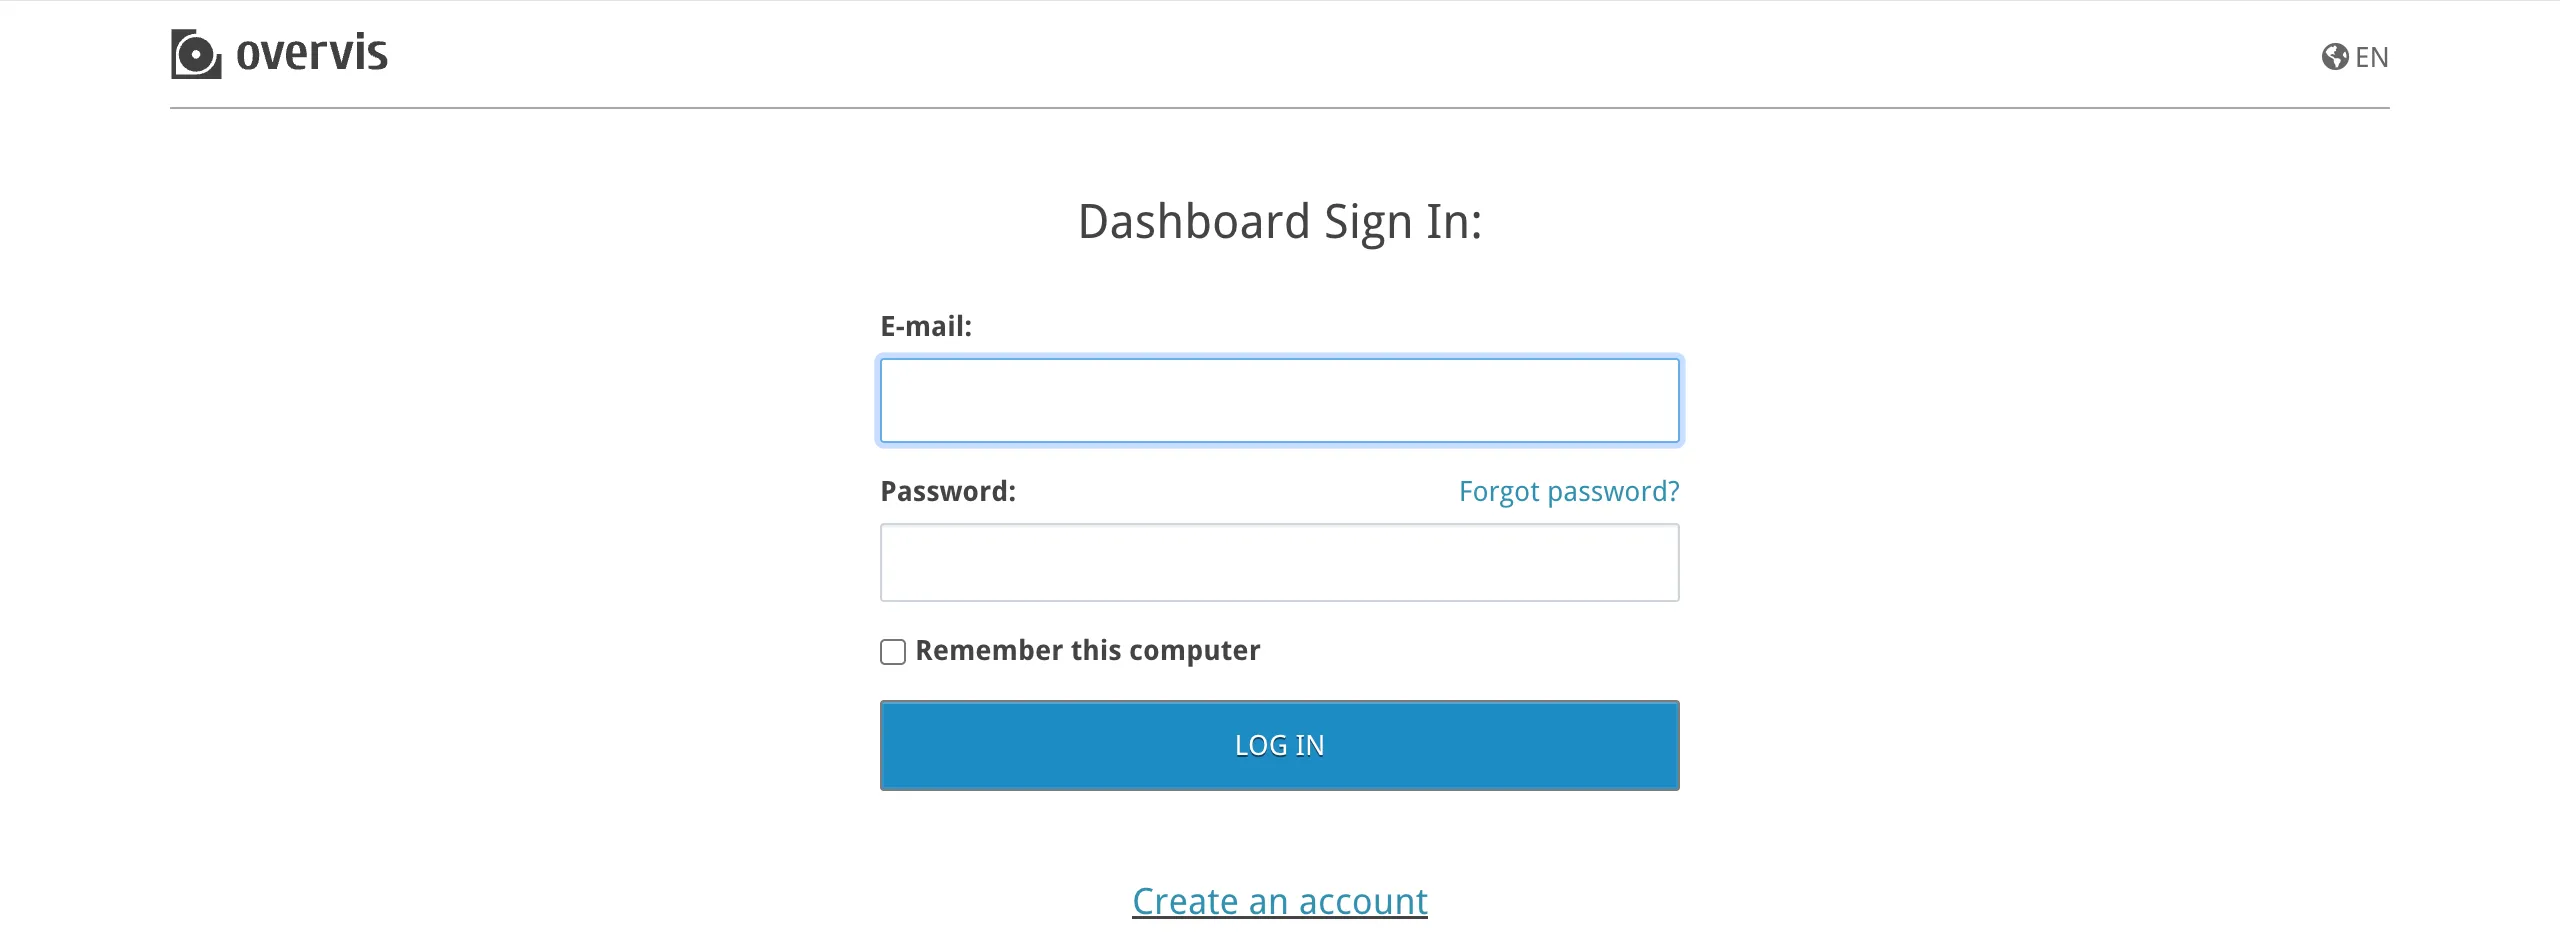
The controller uses DHCP by default, so in most cases it obtains an IP address automatically after plugging in the Ethernet cable. With a SIM card (no PIN lock), cellular connection is typically established within a minute without any user action. If the display shows Step 2: Create an Overvis AccountSection titled “Step 2: Create an Overvis Account”Go to ocp.overvis.com and click Create account.
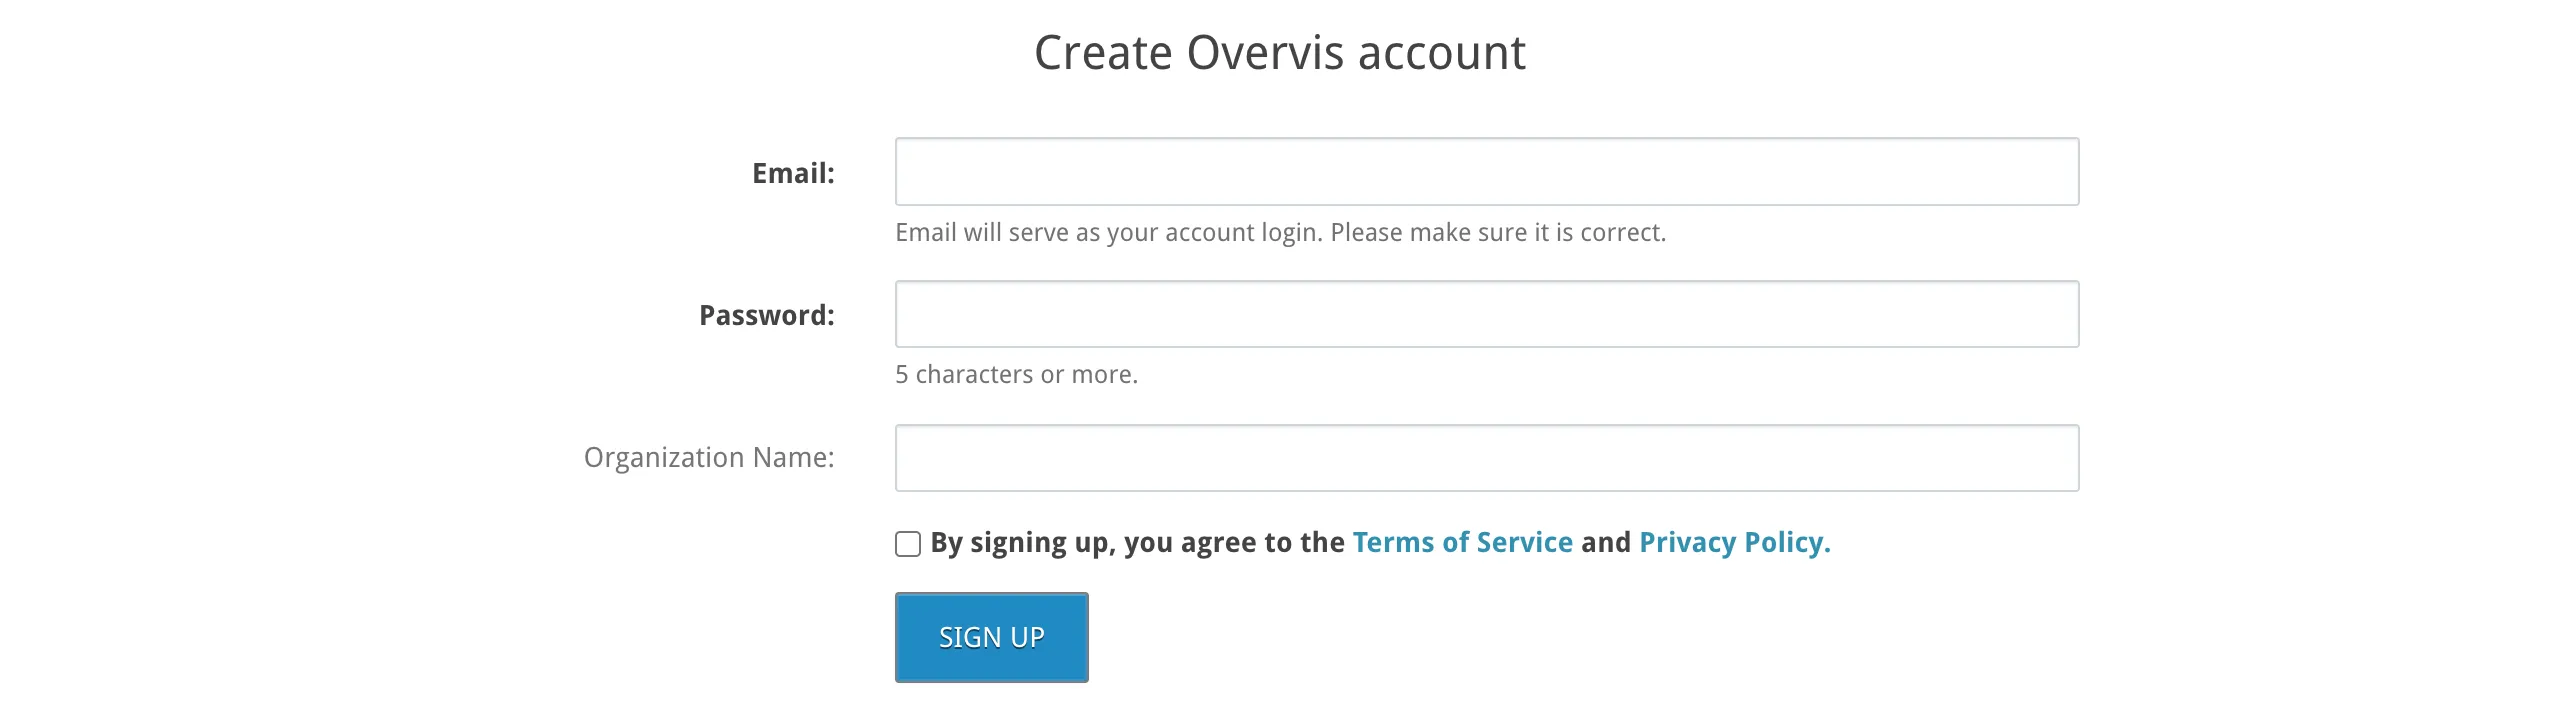
On the registration page, fill in:
Click Sign up.
After registration, you are automatically logged in and redirected to the Create Network page (covered in the next step). A confirmation email is sent to the address you provided — click the link in it within 24 hours to keep your account active.
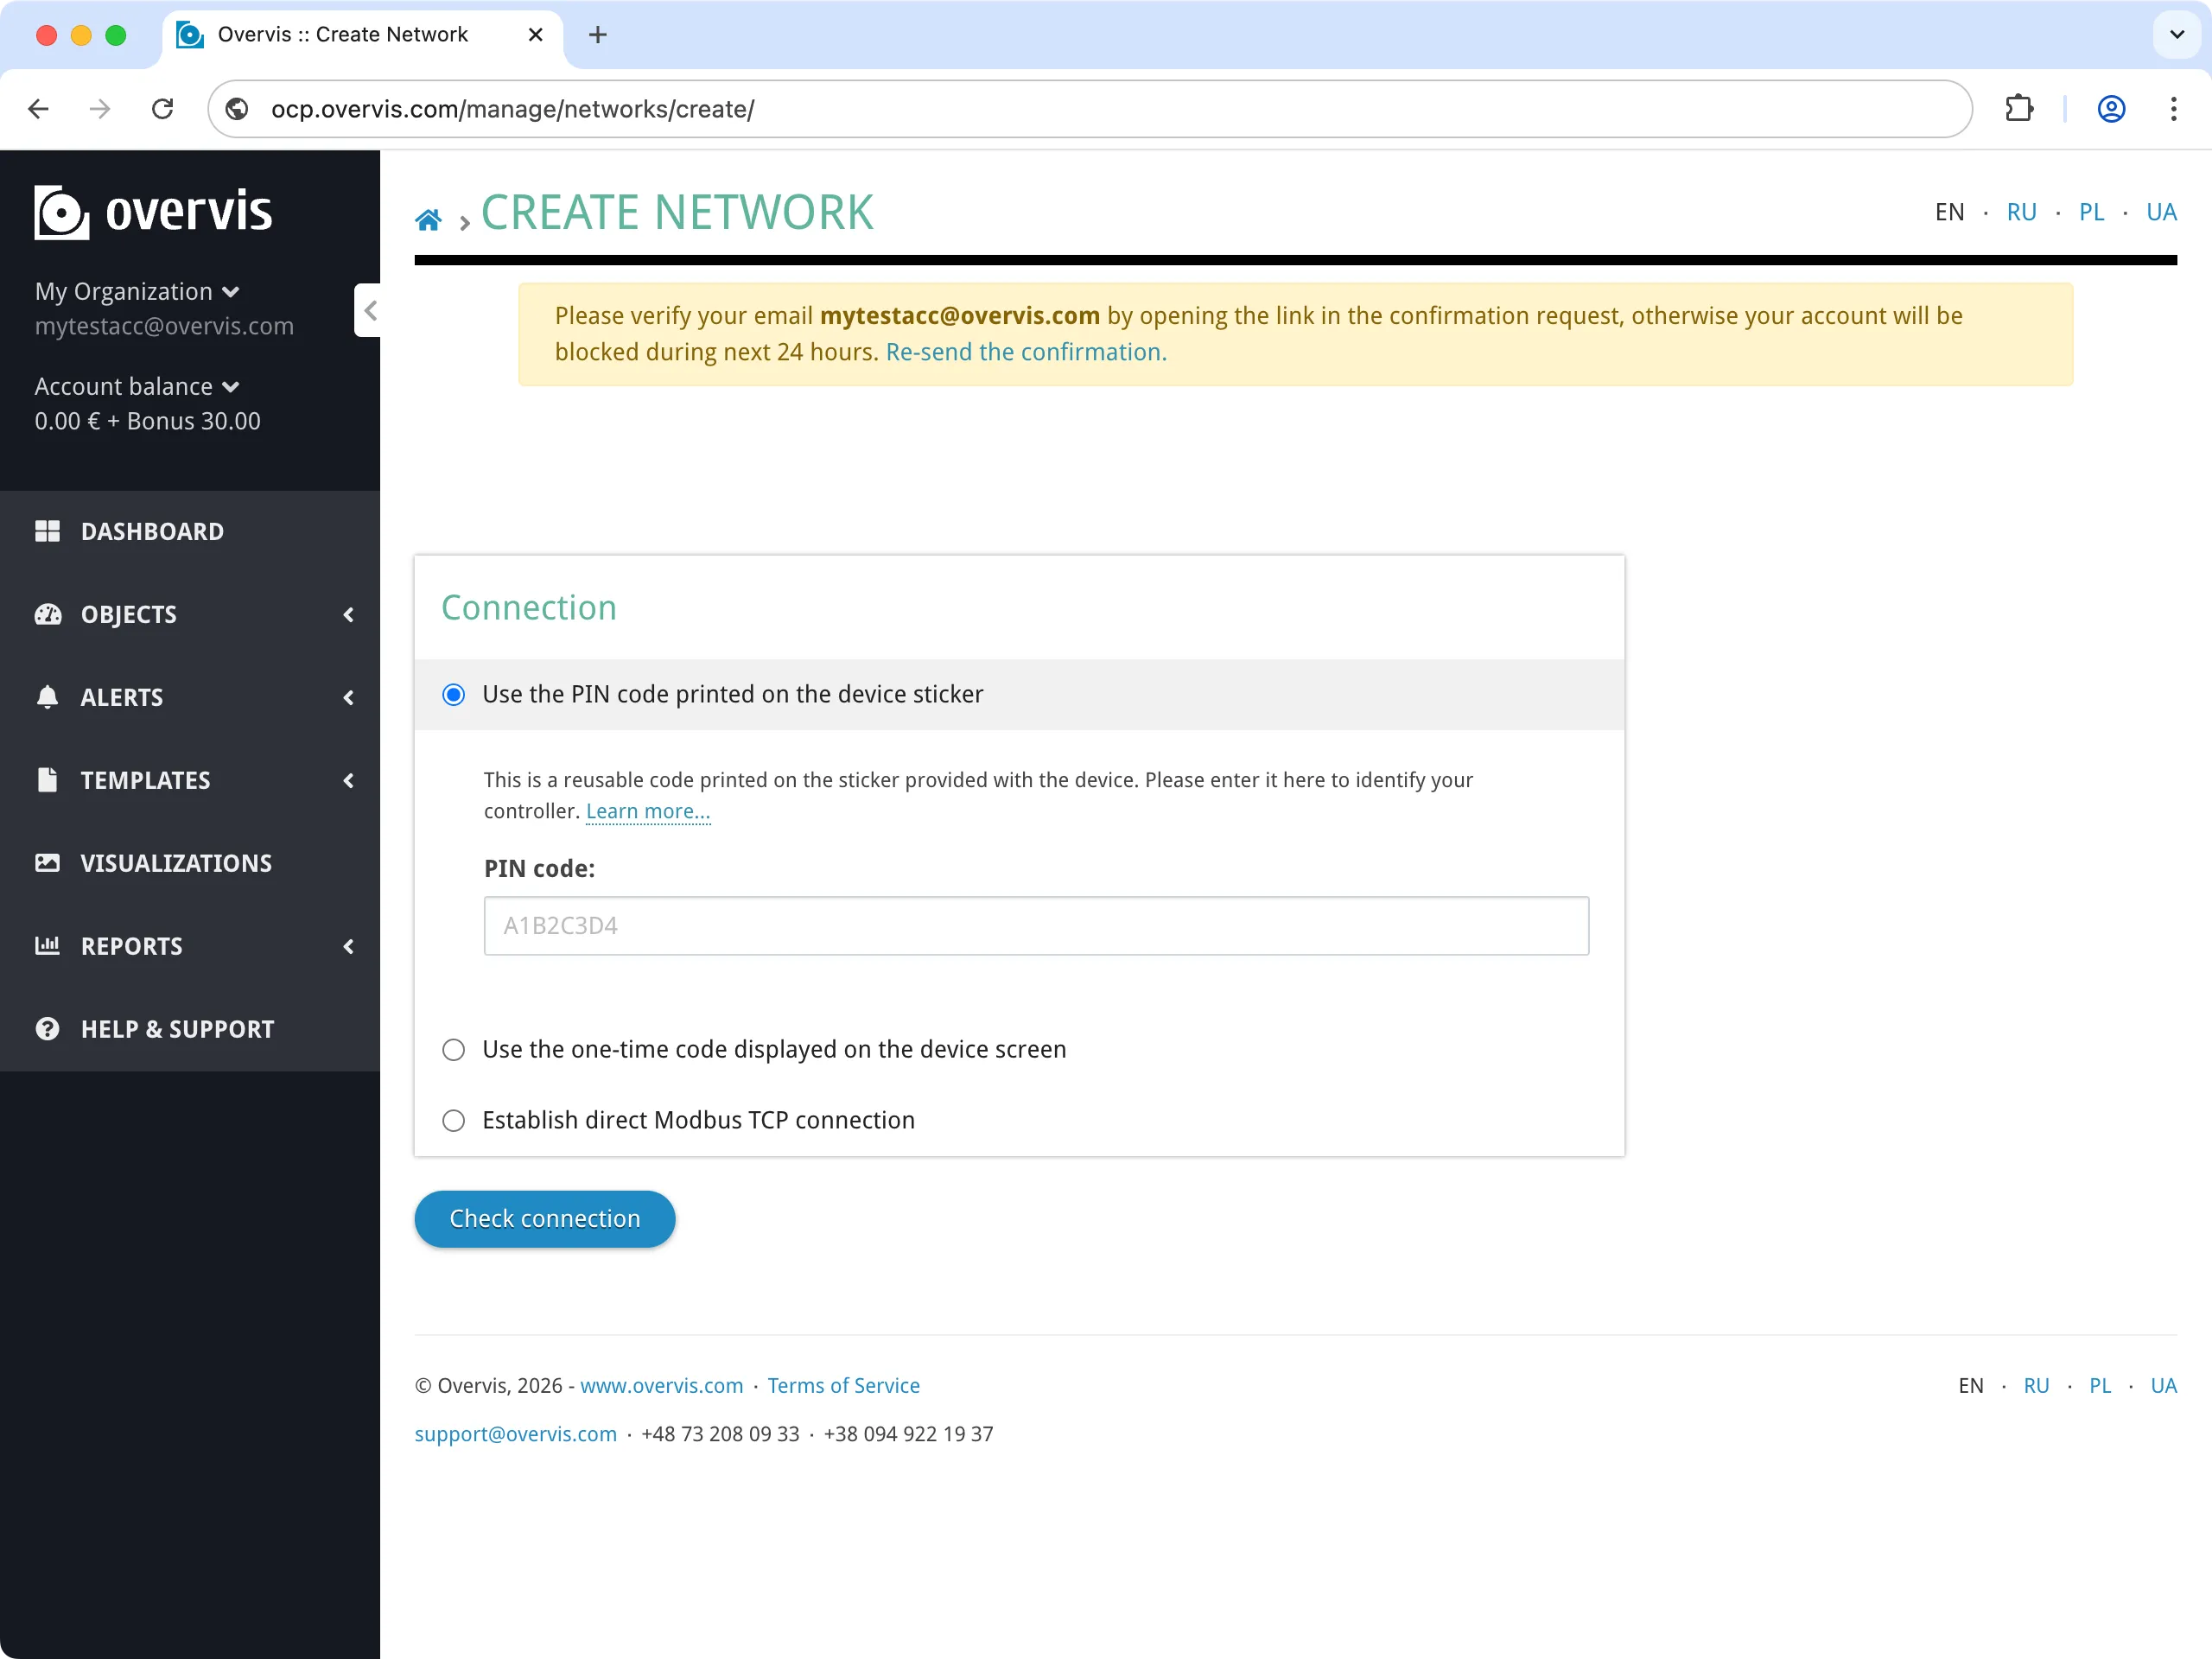
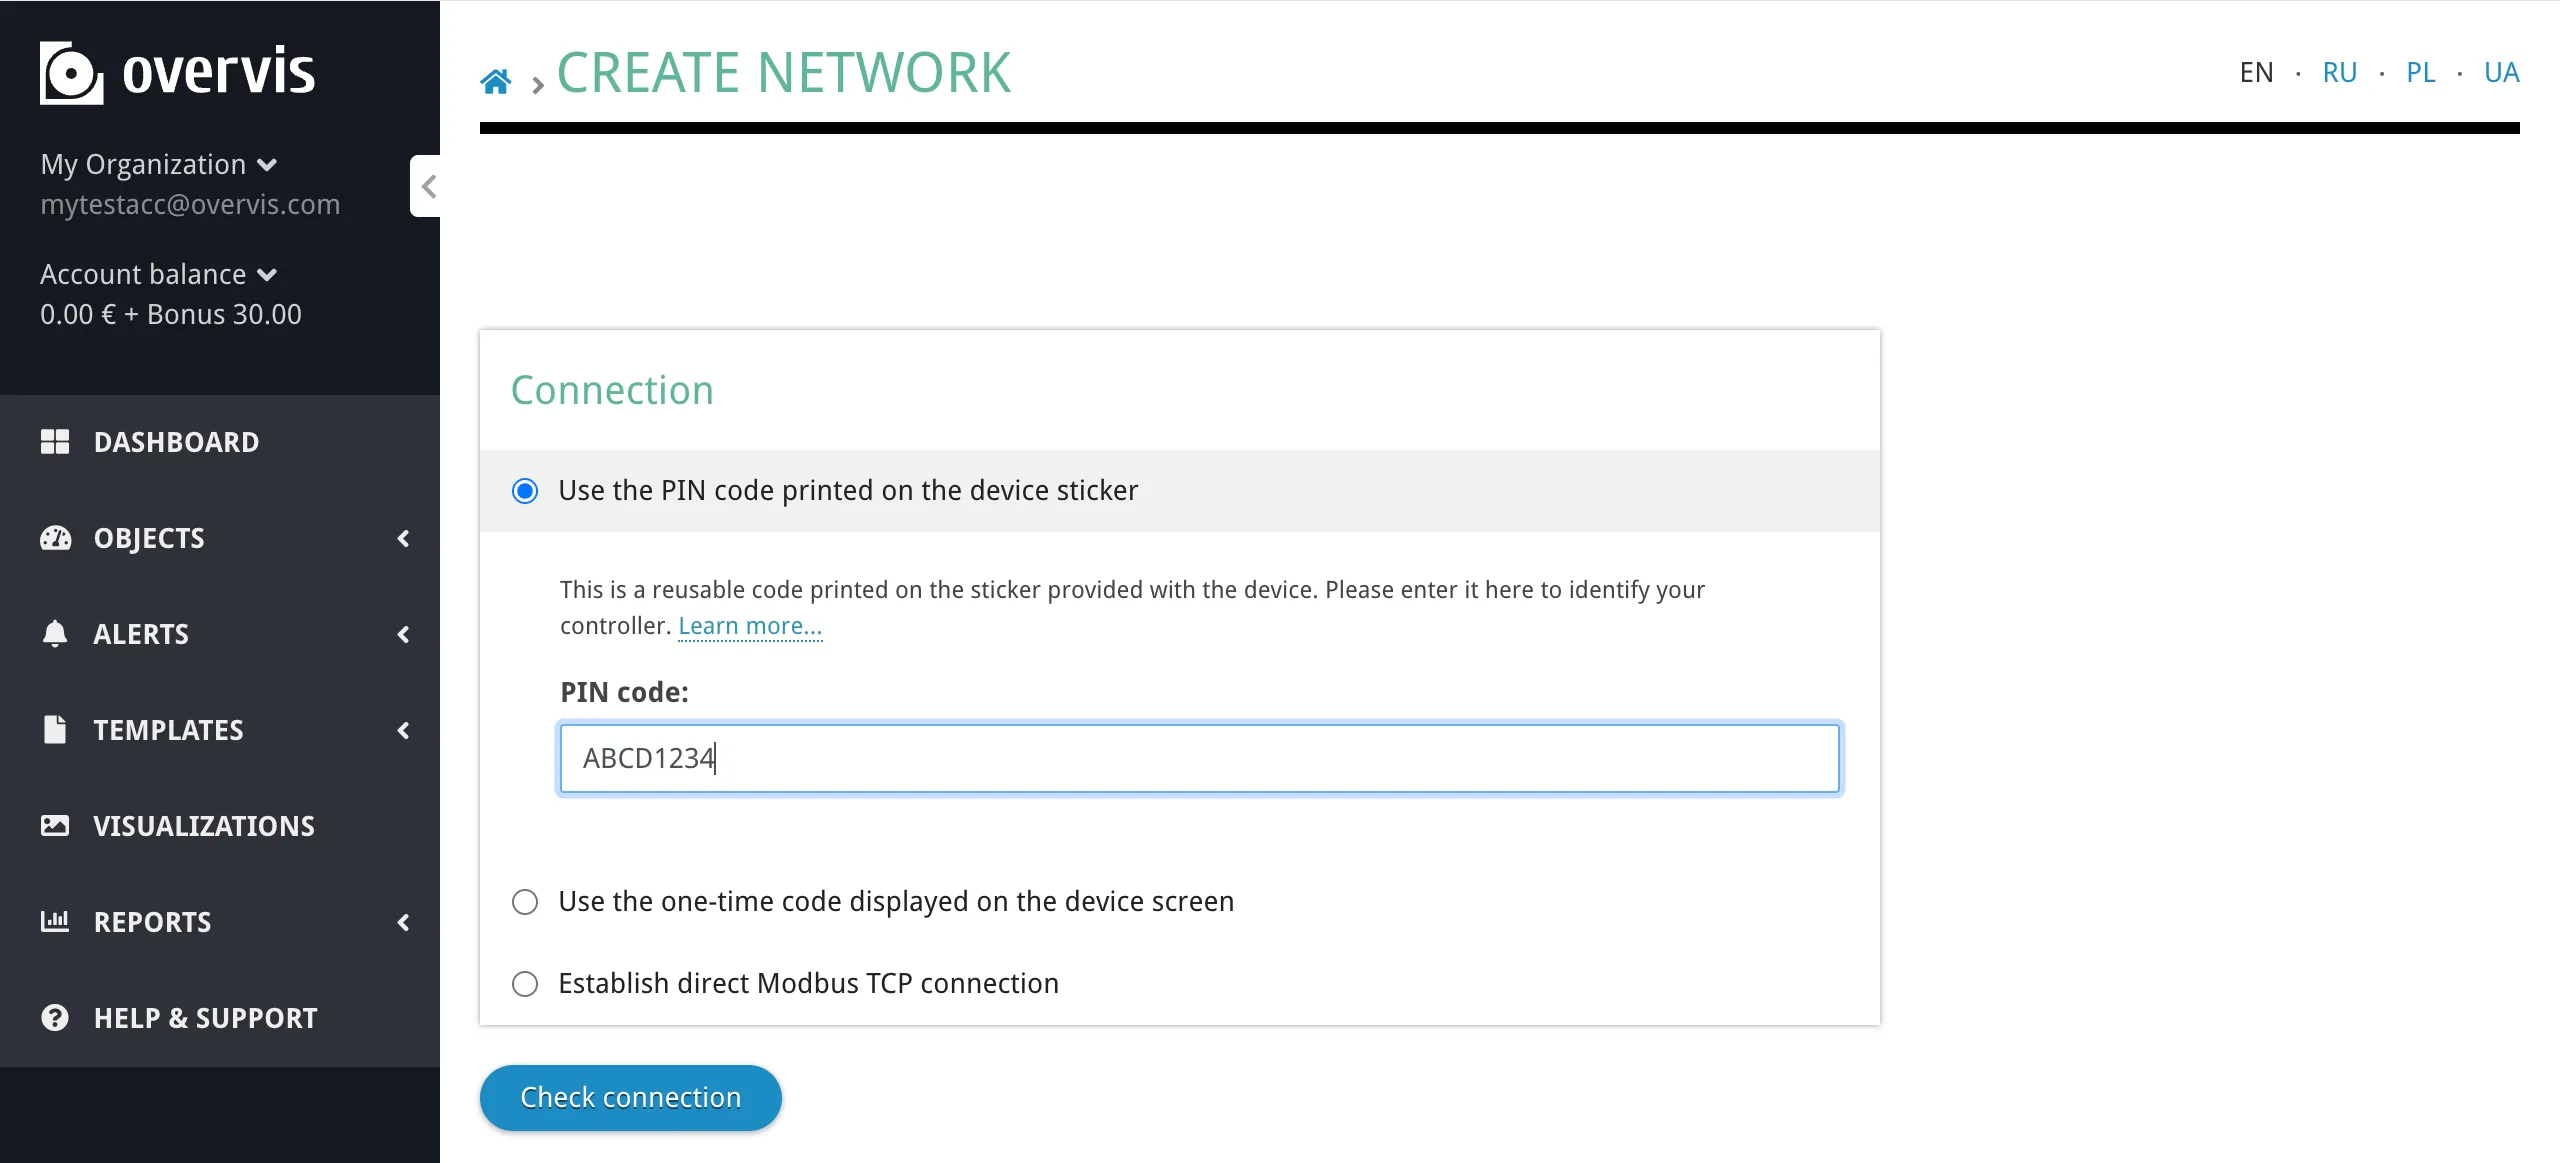
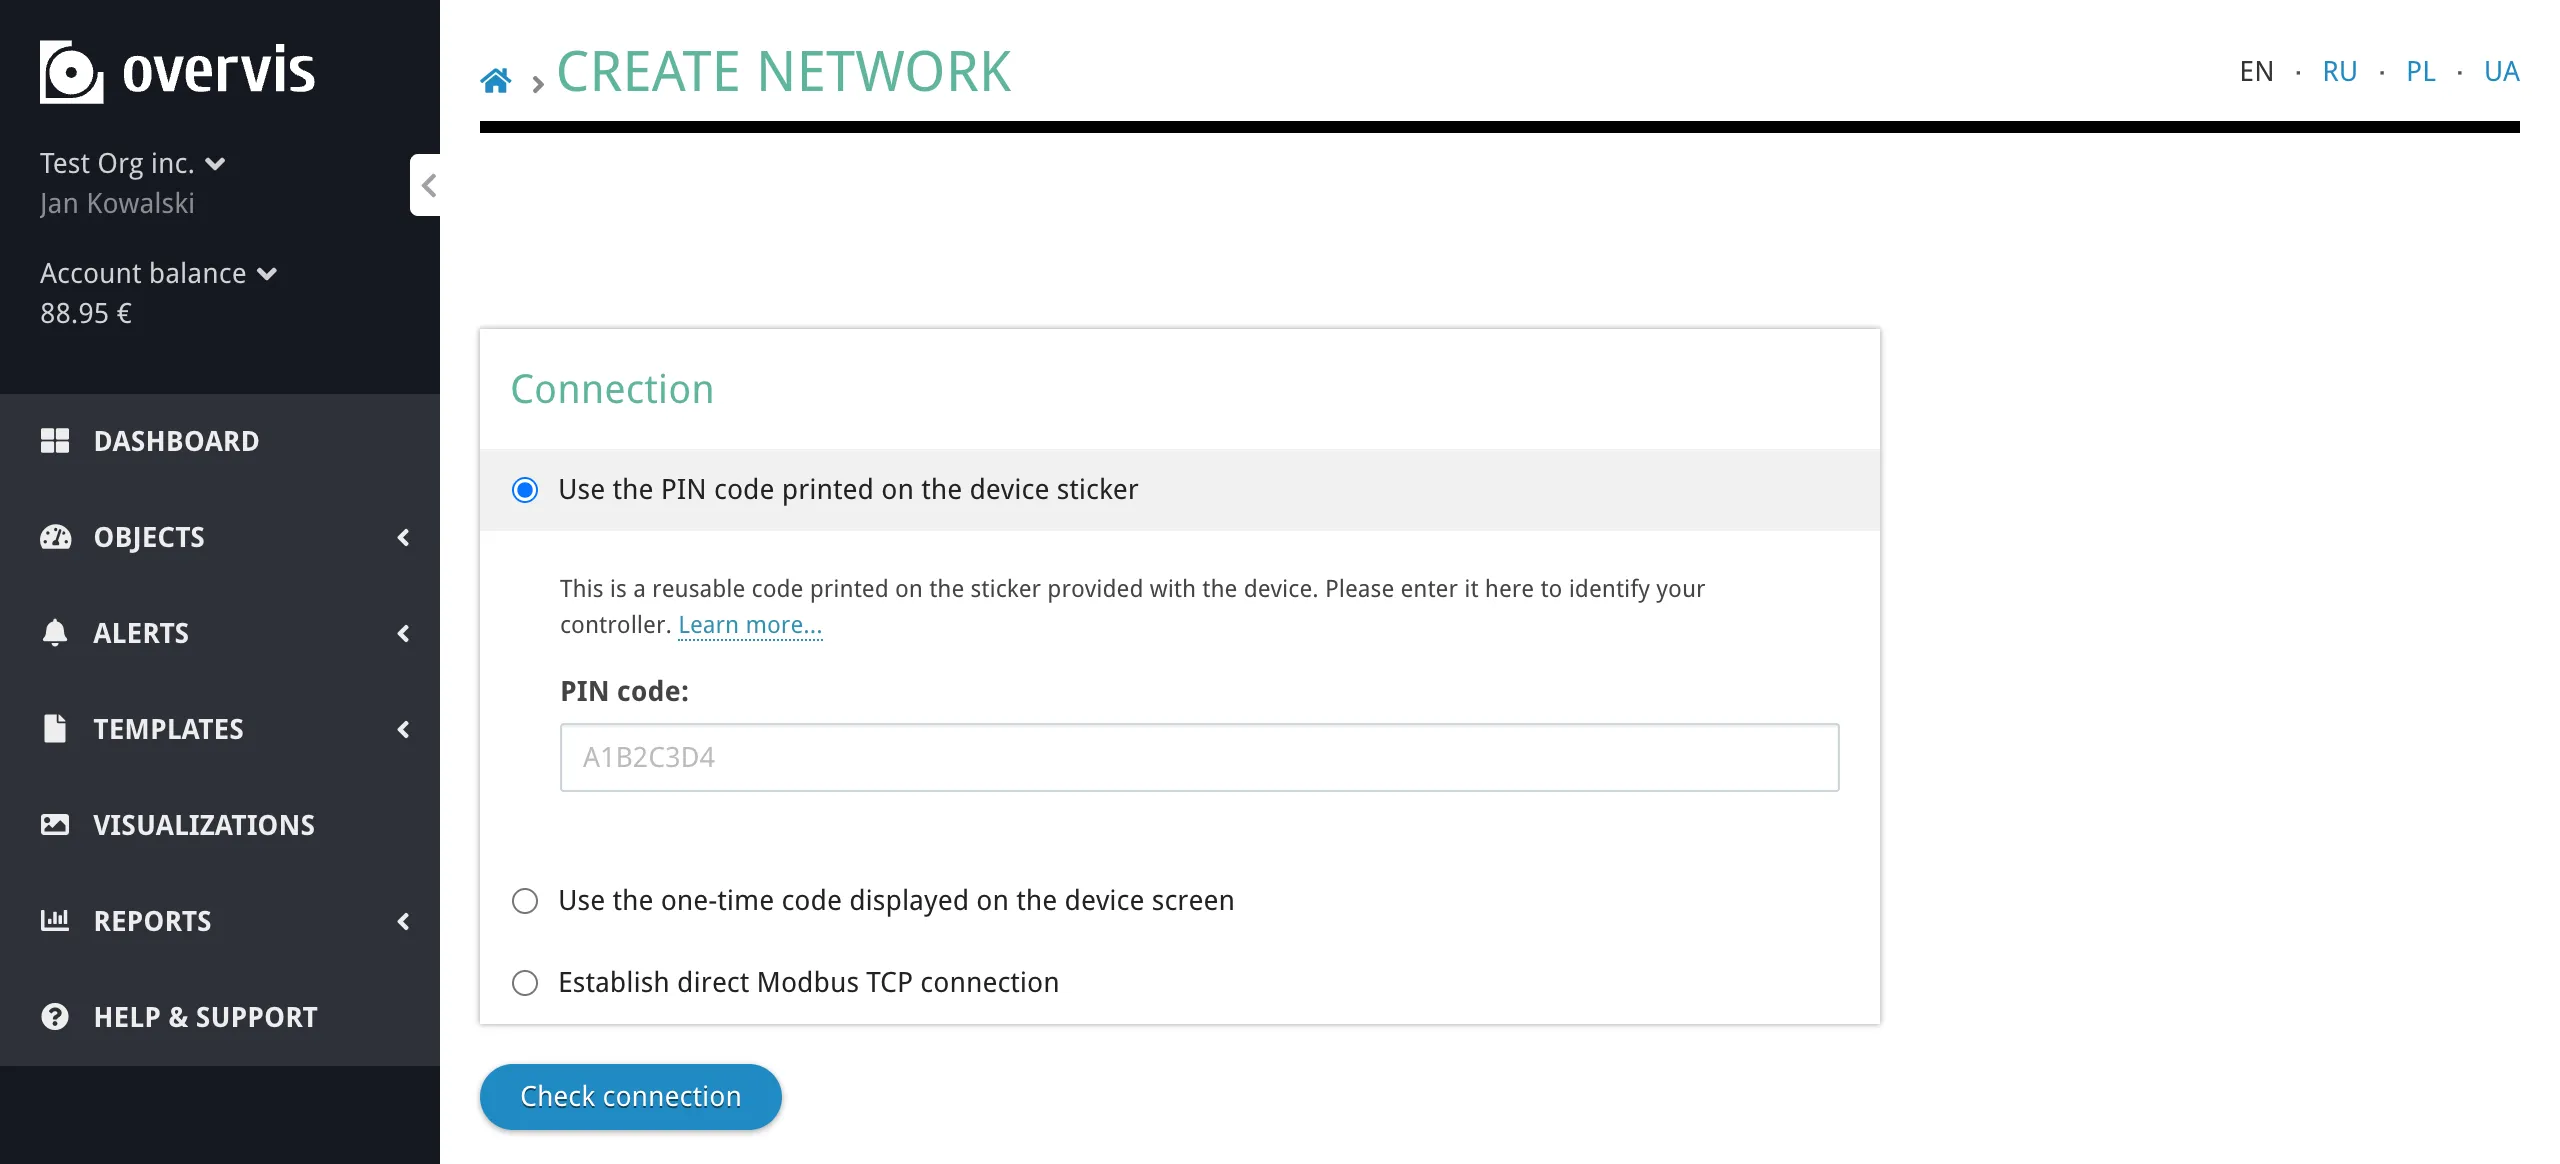
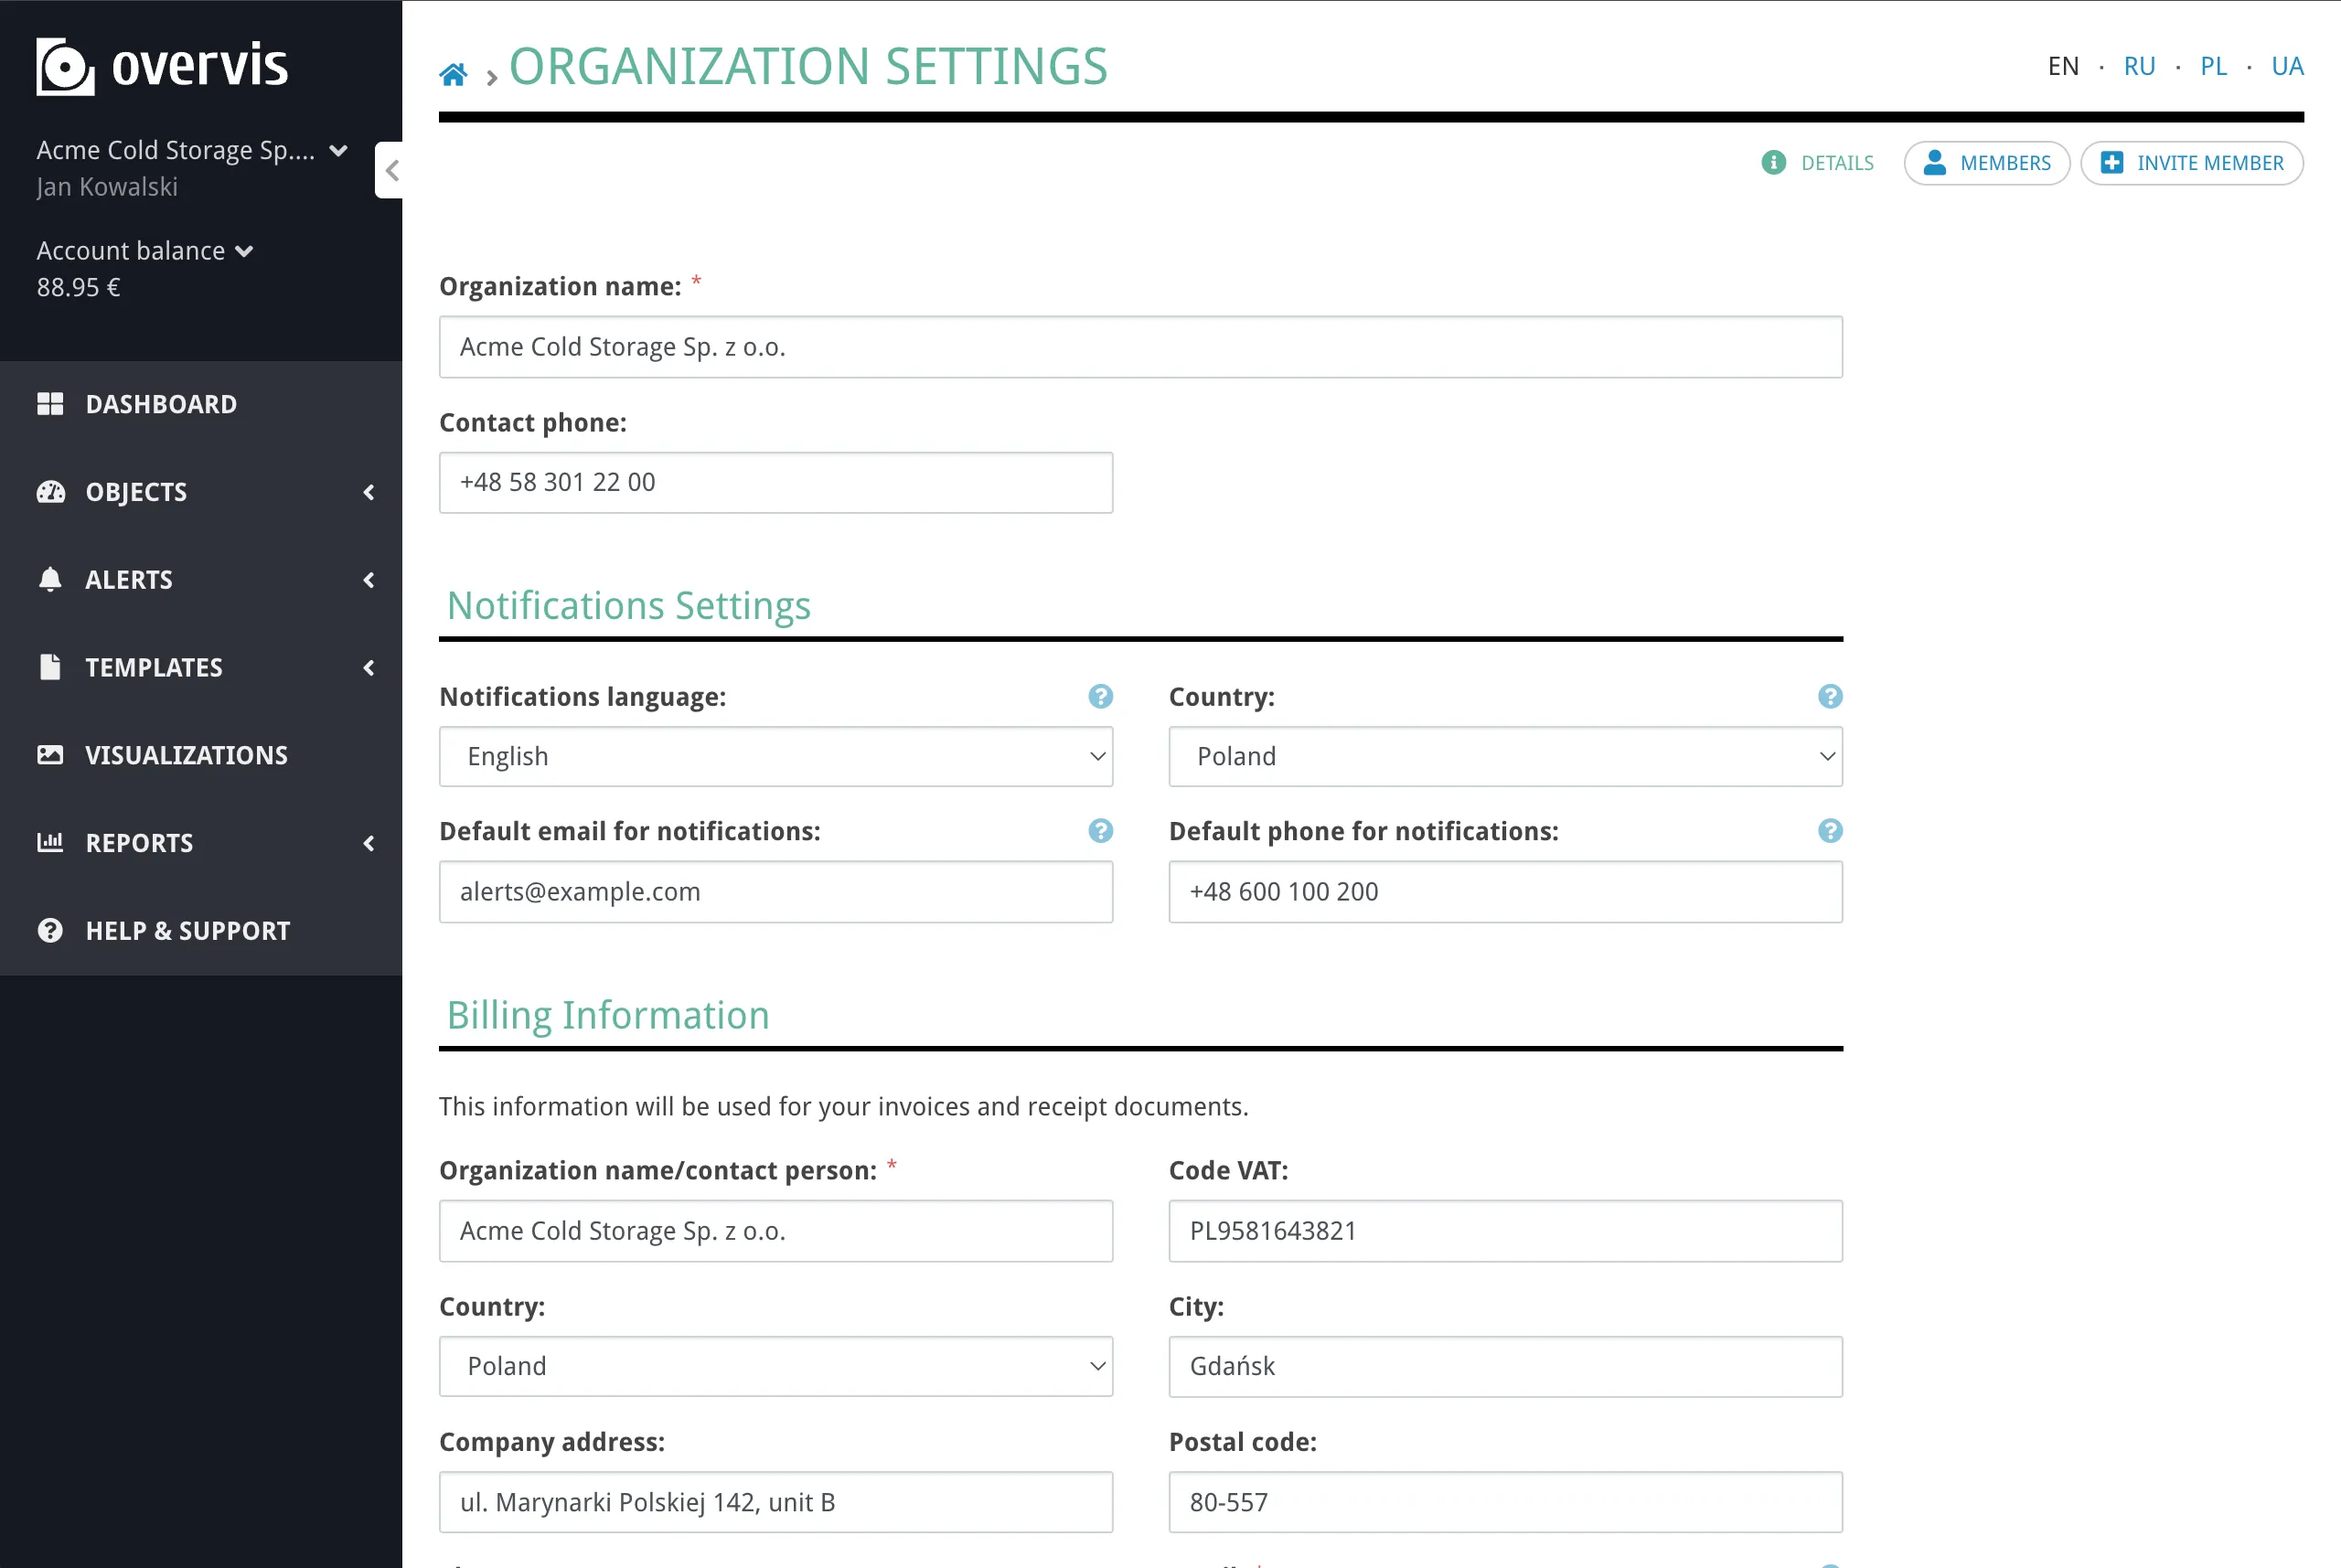
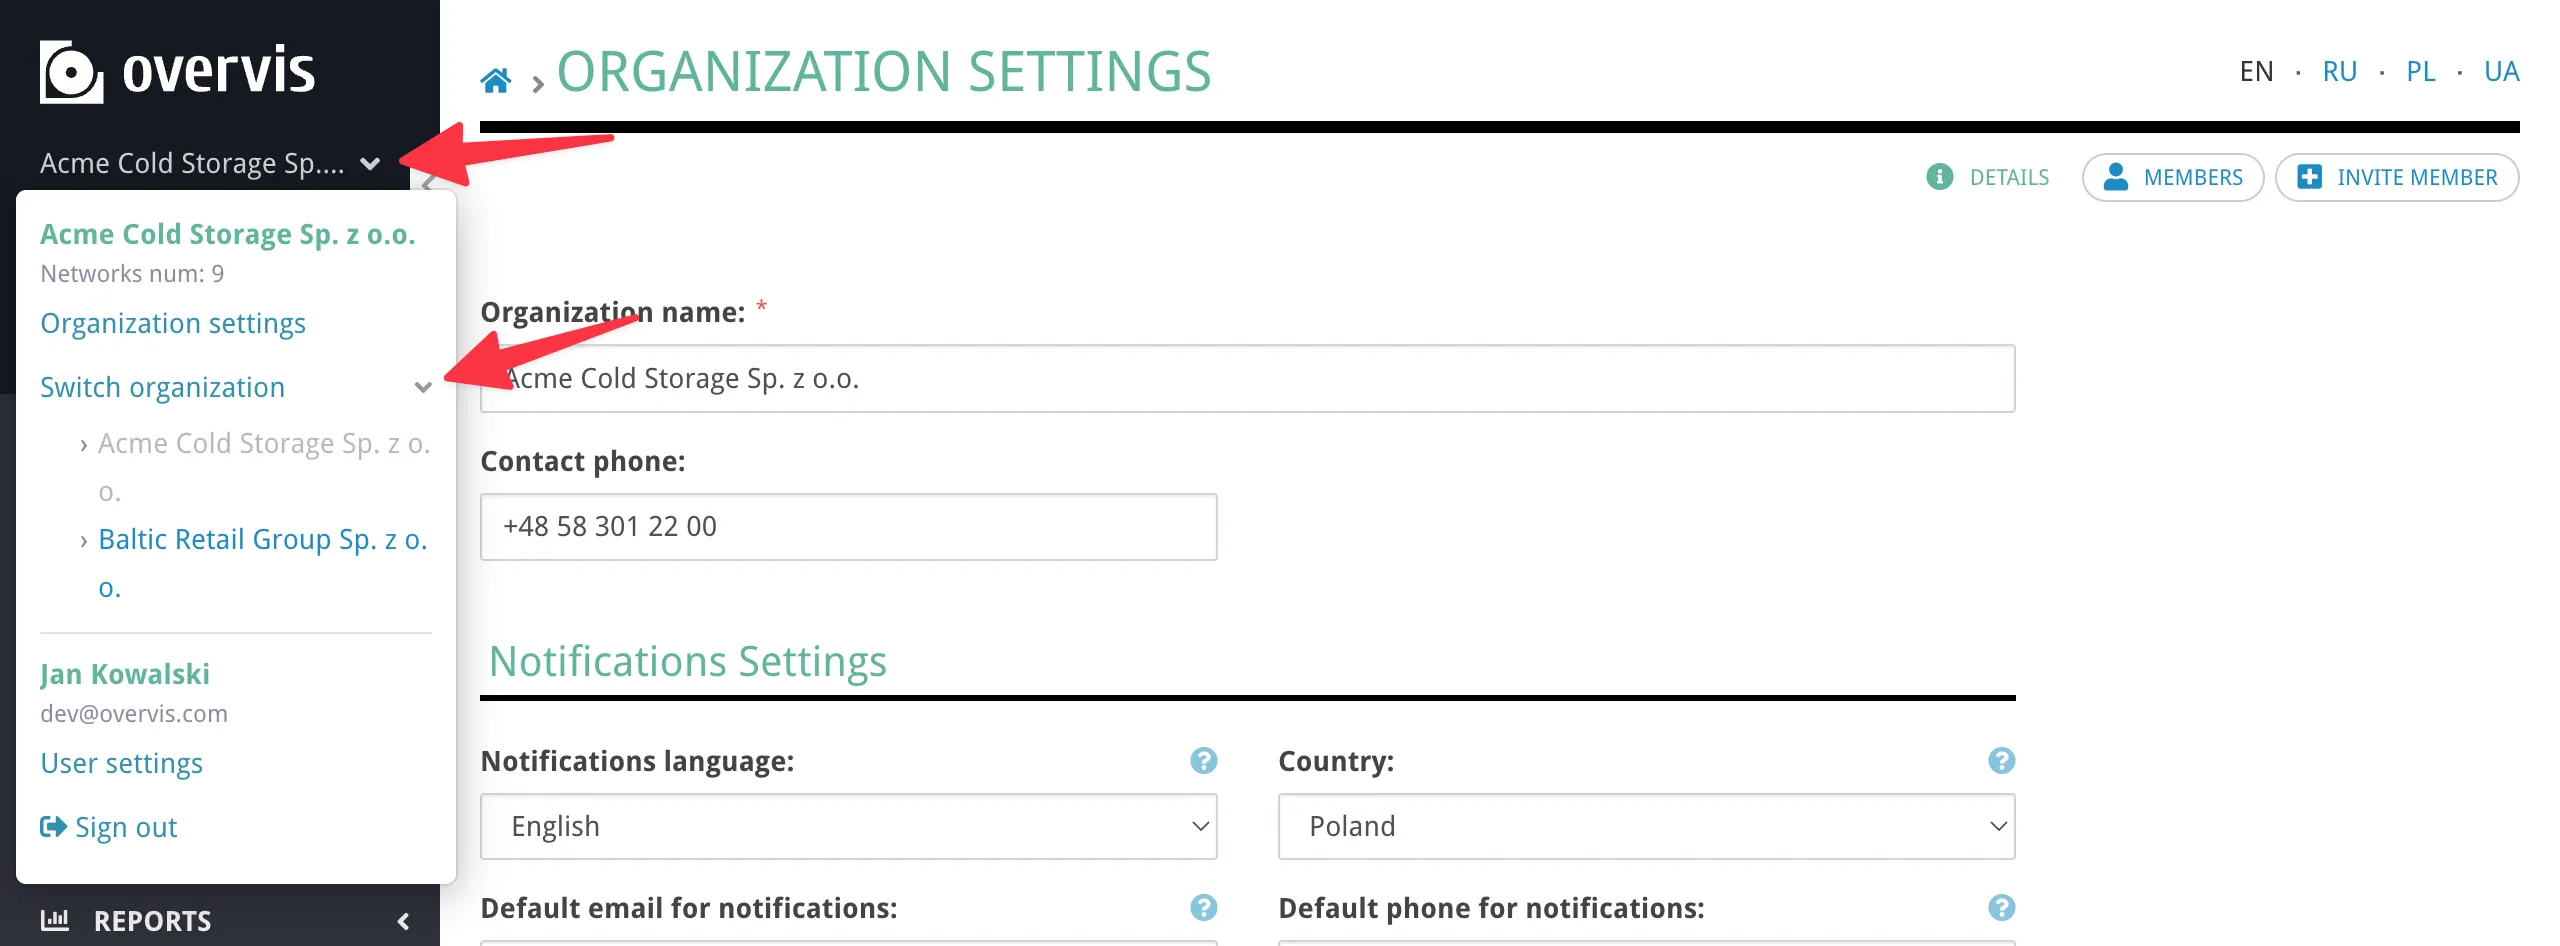
During registration, Overvis creates an organization for your account. In Overvis, an organization is the unit of billing and access control — it groups networks, users, and permissions together. It does not have to correspond to a real-world company: a single company might use several Overvis organizations to separate different sites, projects, or cost centers. For details on managing organizations and inviting team members, see Organizations & Users. Step 3: Register the Controller in OvervisSection titled “Step 3: Register the Controller in Overvis”In Overvis, a network represents a communication controller and all the Modbus RTU devices accessible through it. The next step is to create a network — tell Overvis how to find and access your controller. Navigate to the Create Network page — if you just registered, you are already there. Find the PIN codeSection titled “Find the PIN code”Locate the sticker on your MC252 (or other Overvis-compatible controller). It contains a QR code and a PIN — an 8-character alphanumeric code (e.g.
Create the networkSection titled “Create the network”Enter the PIN from the device label into the PIN code field and click Check connection to verify the controller is online and reachable.
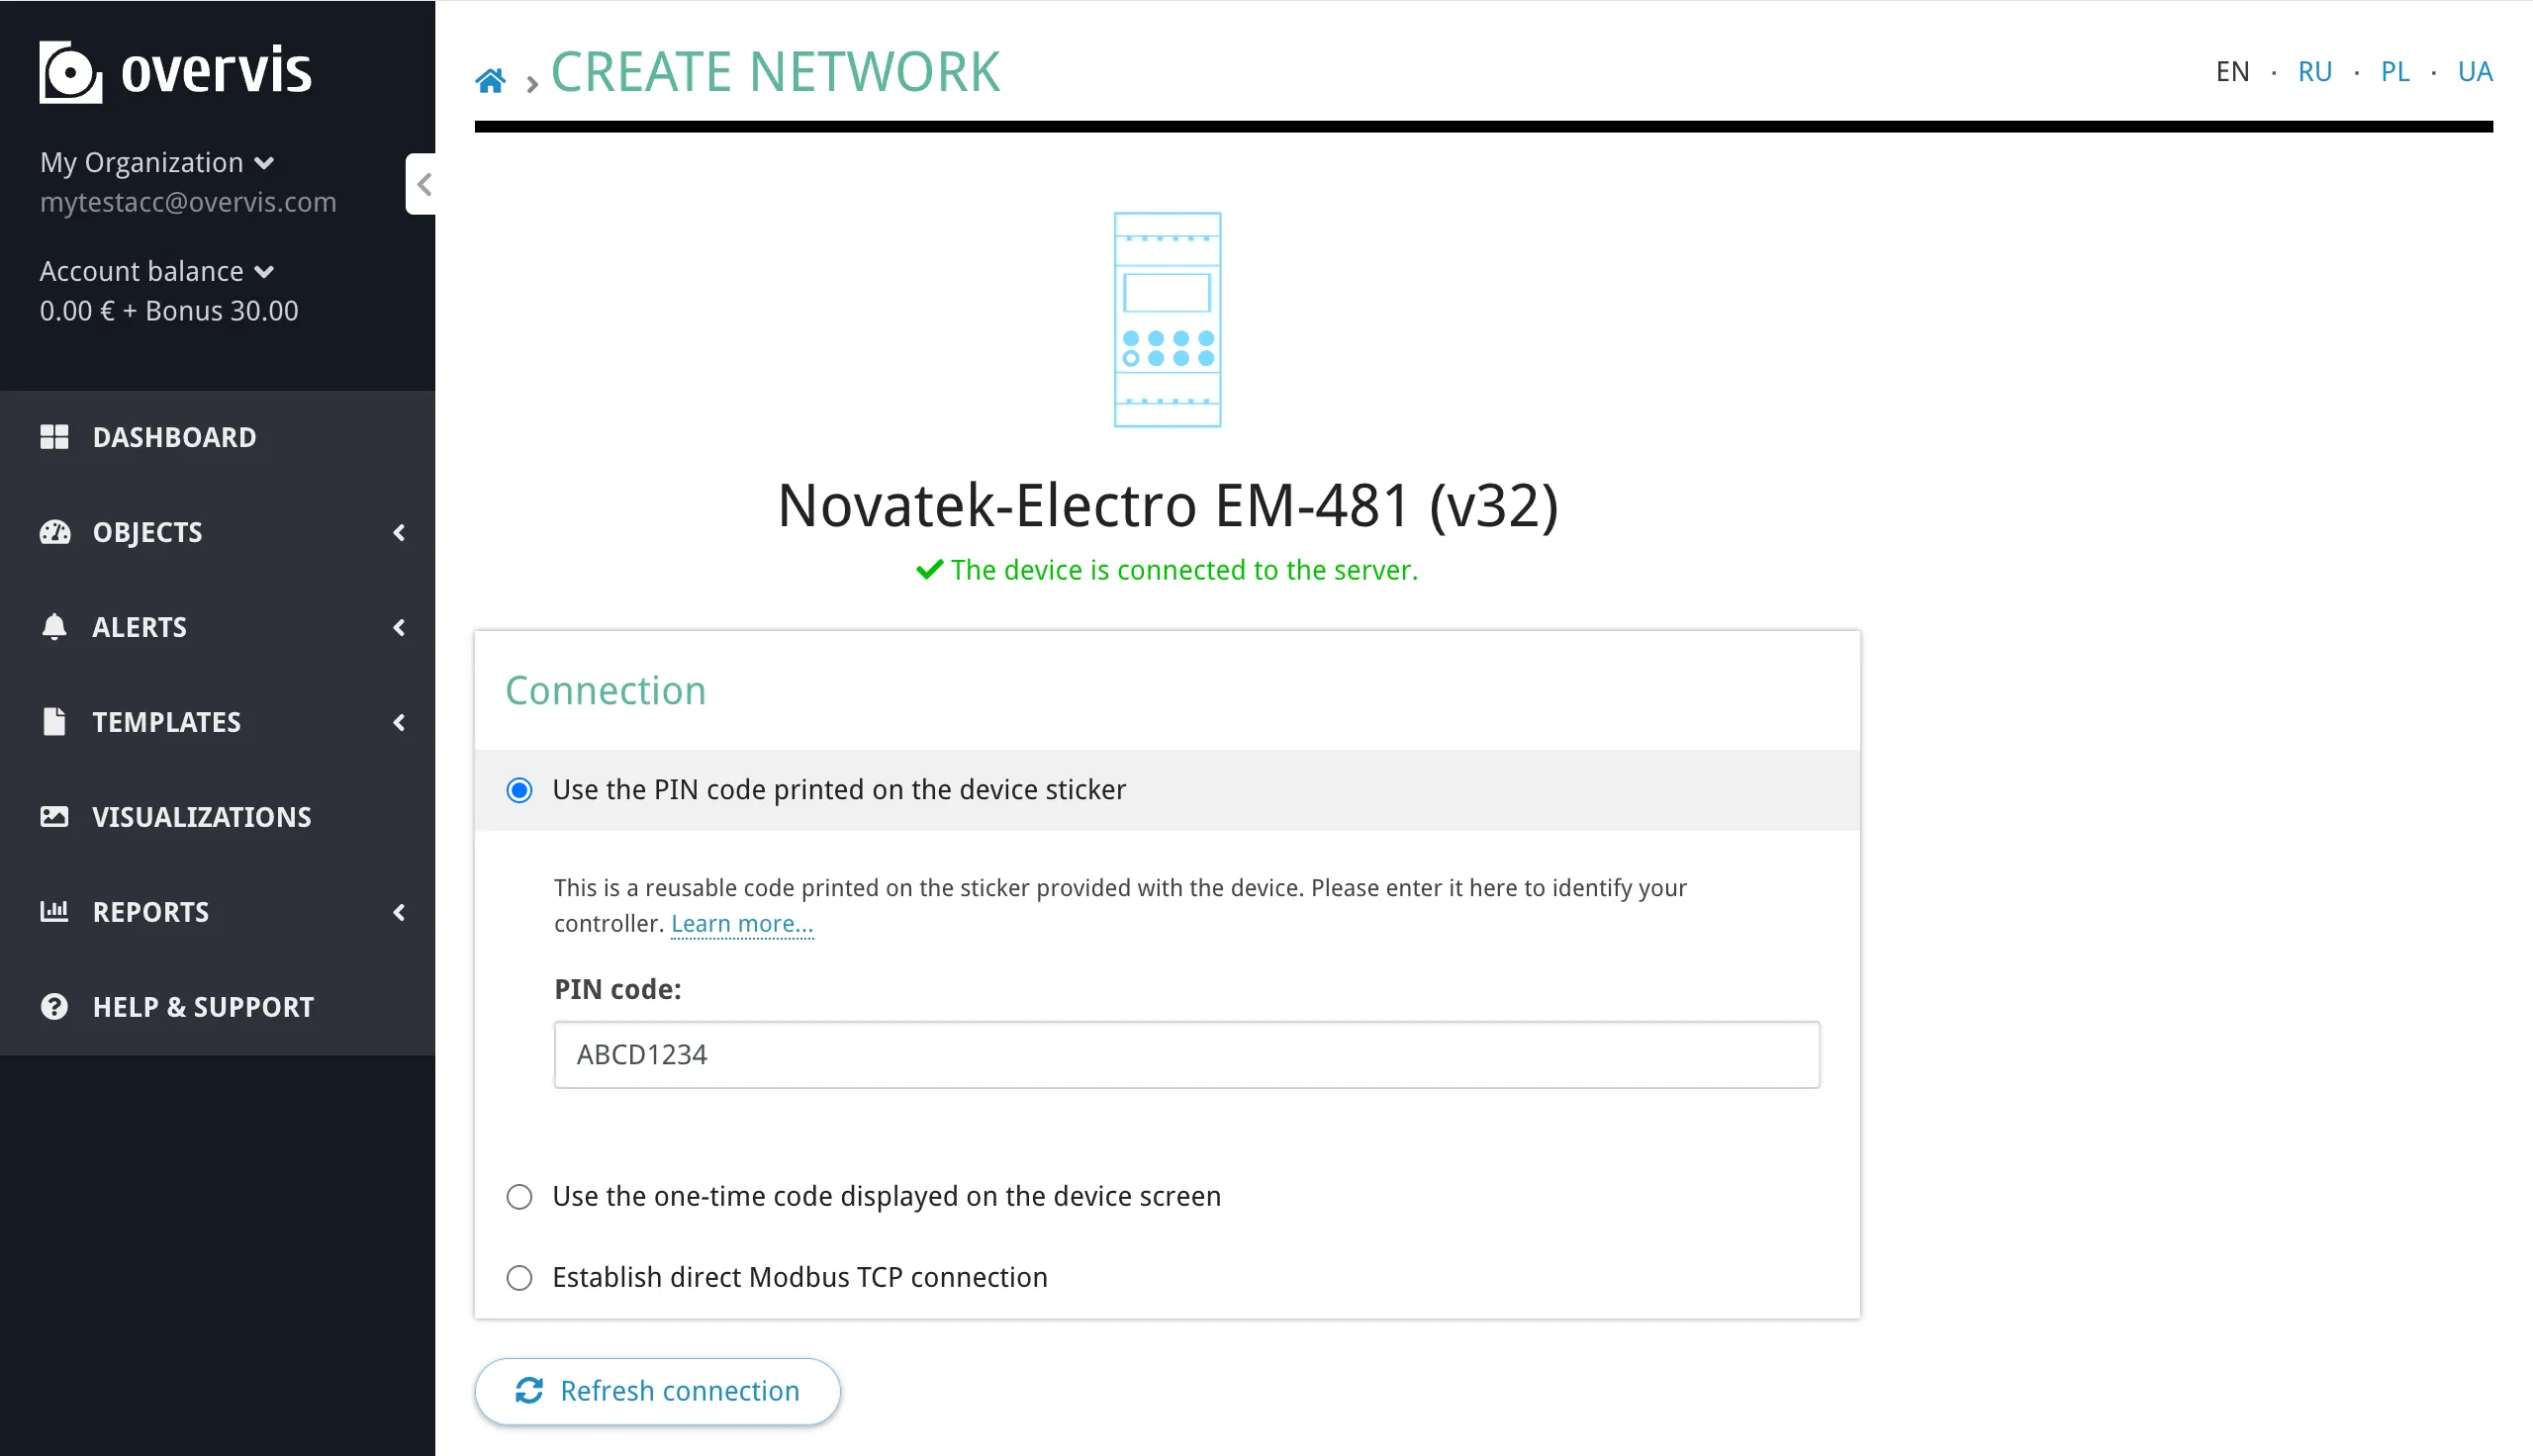
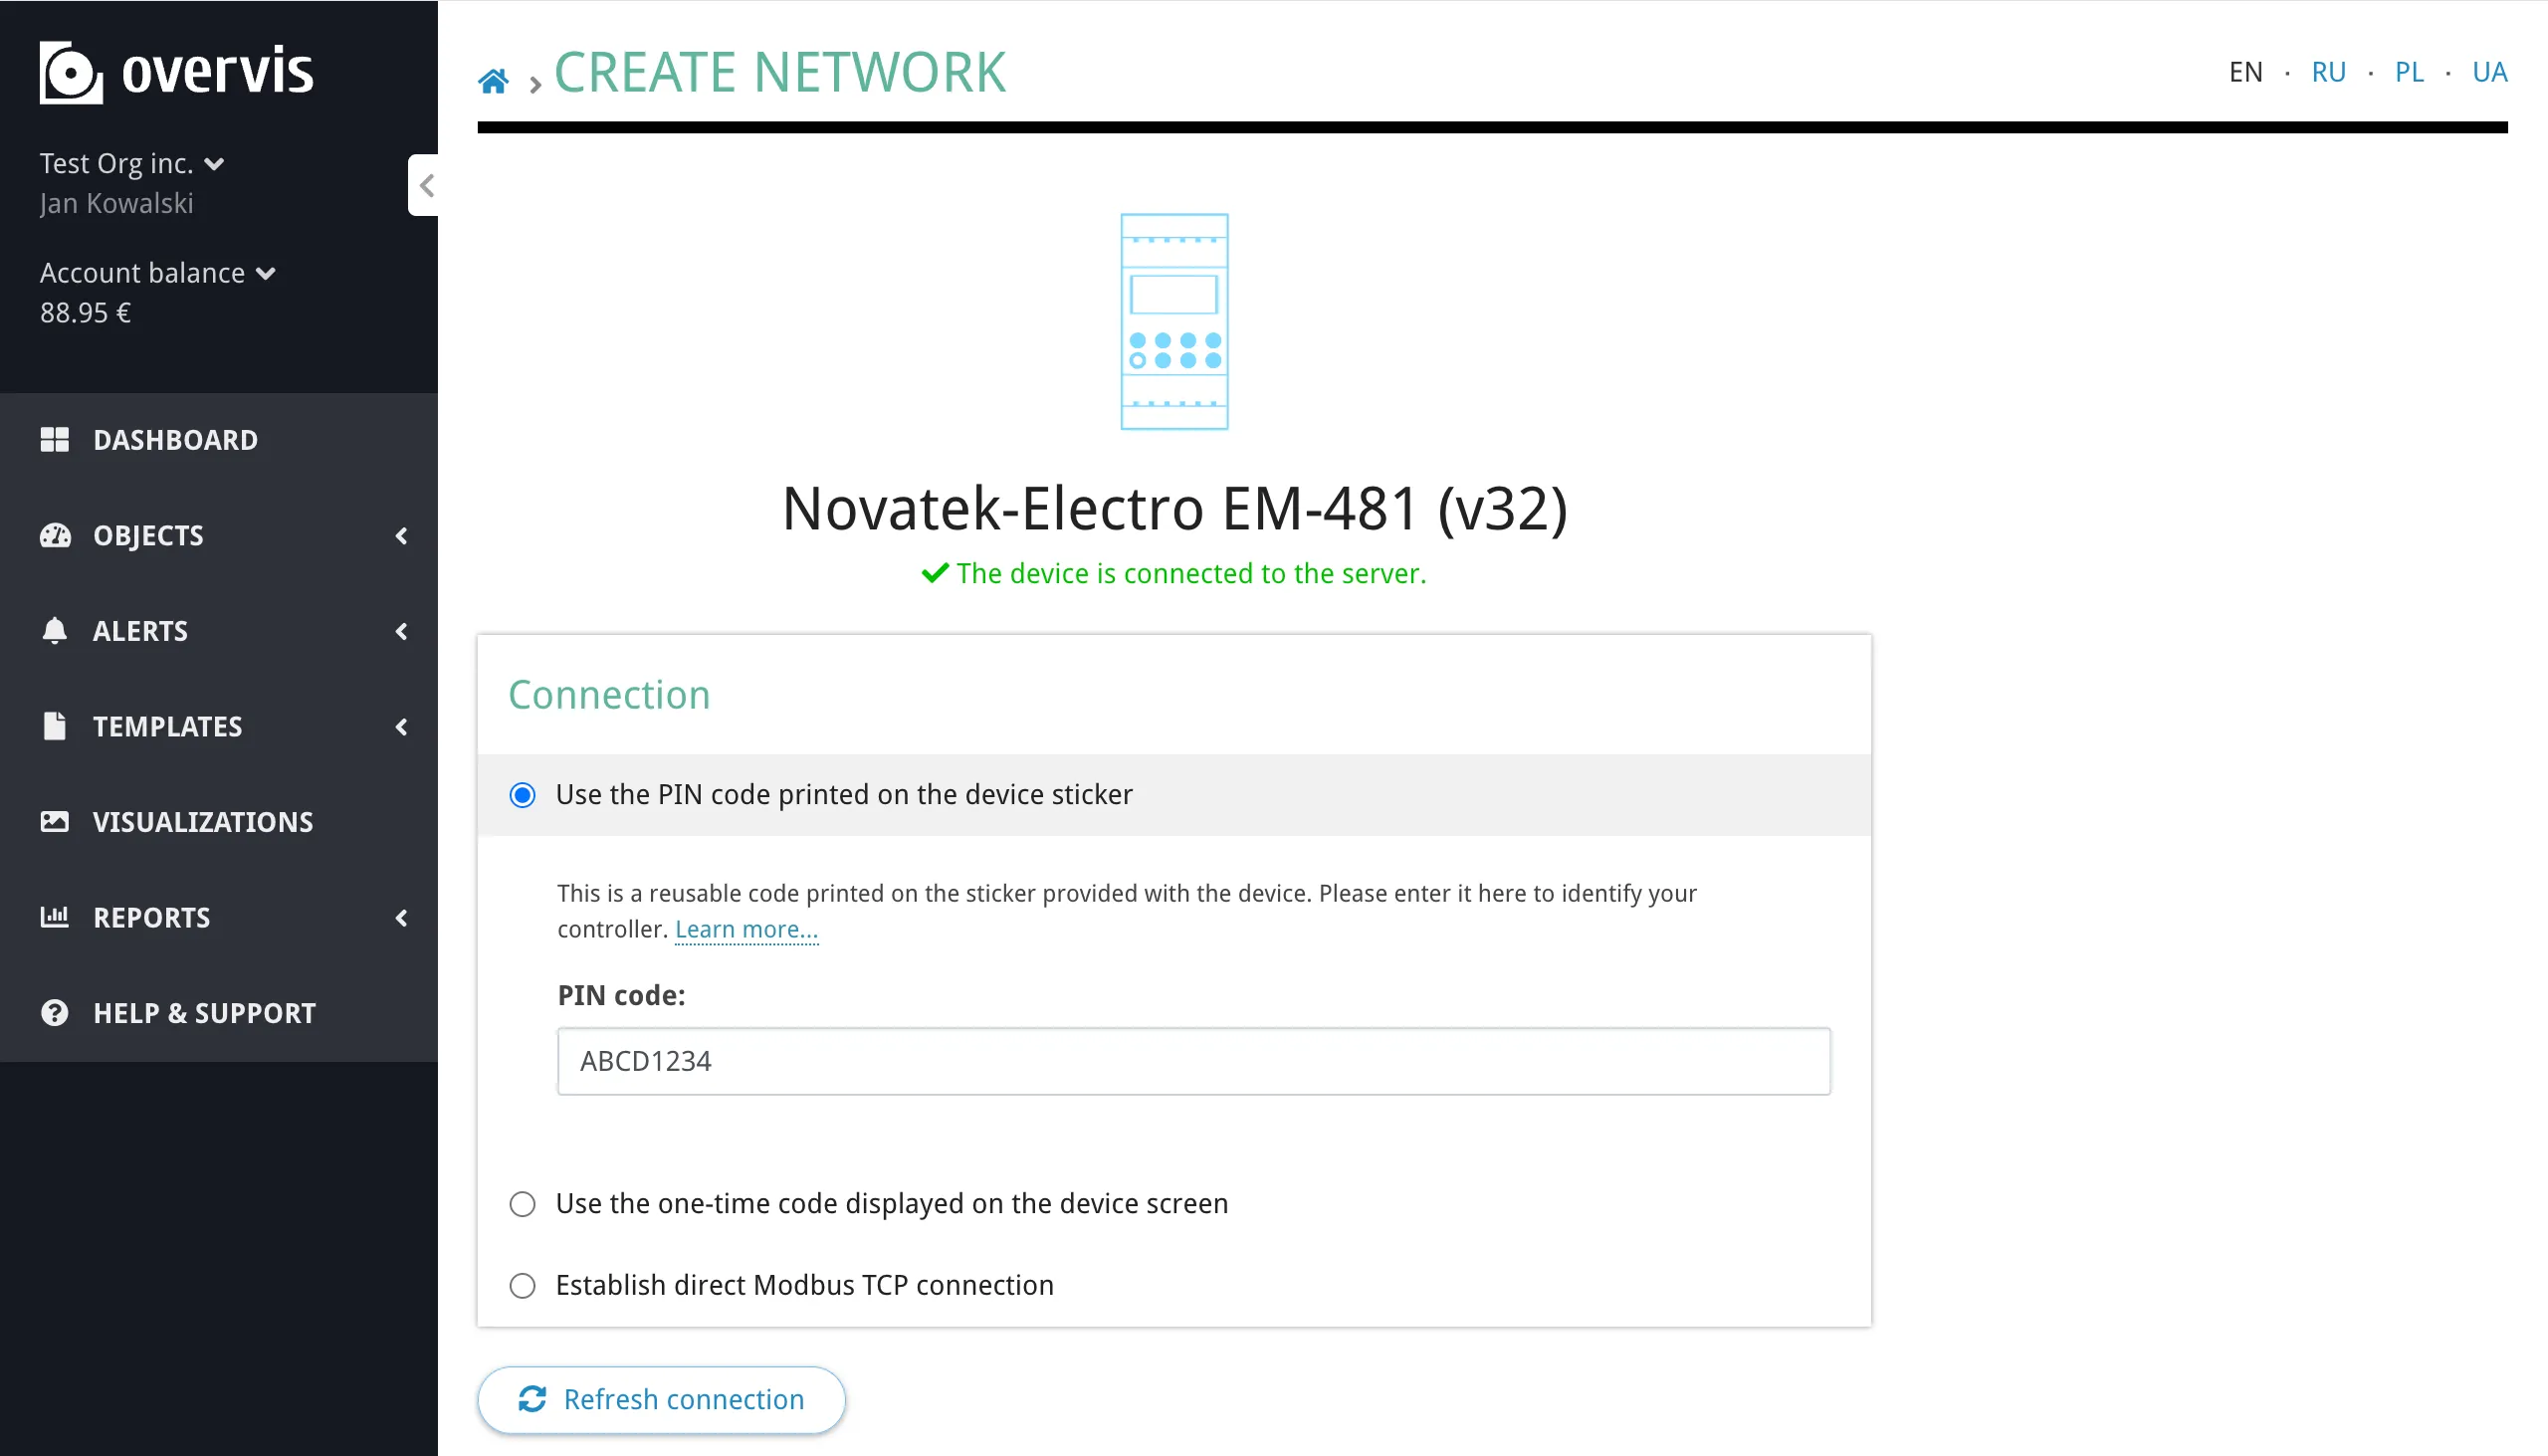
If the check succeeds, Overvis confirms the connection and shows the controller details. If it fails, make sure the controller is powered on, connected to the internet (see Step 1), and try again. Give your network a descriptive name (e.g. “Warehouse”, “Office HVAC”, “Home Heating”) and click Create network to finalize.
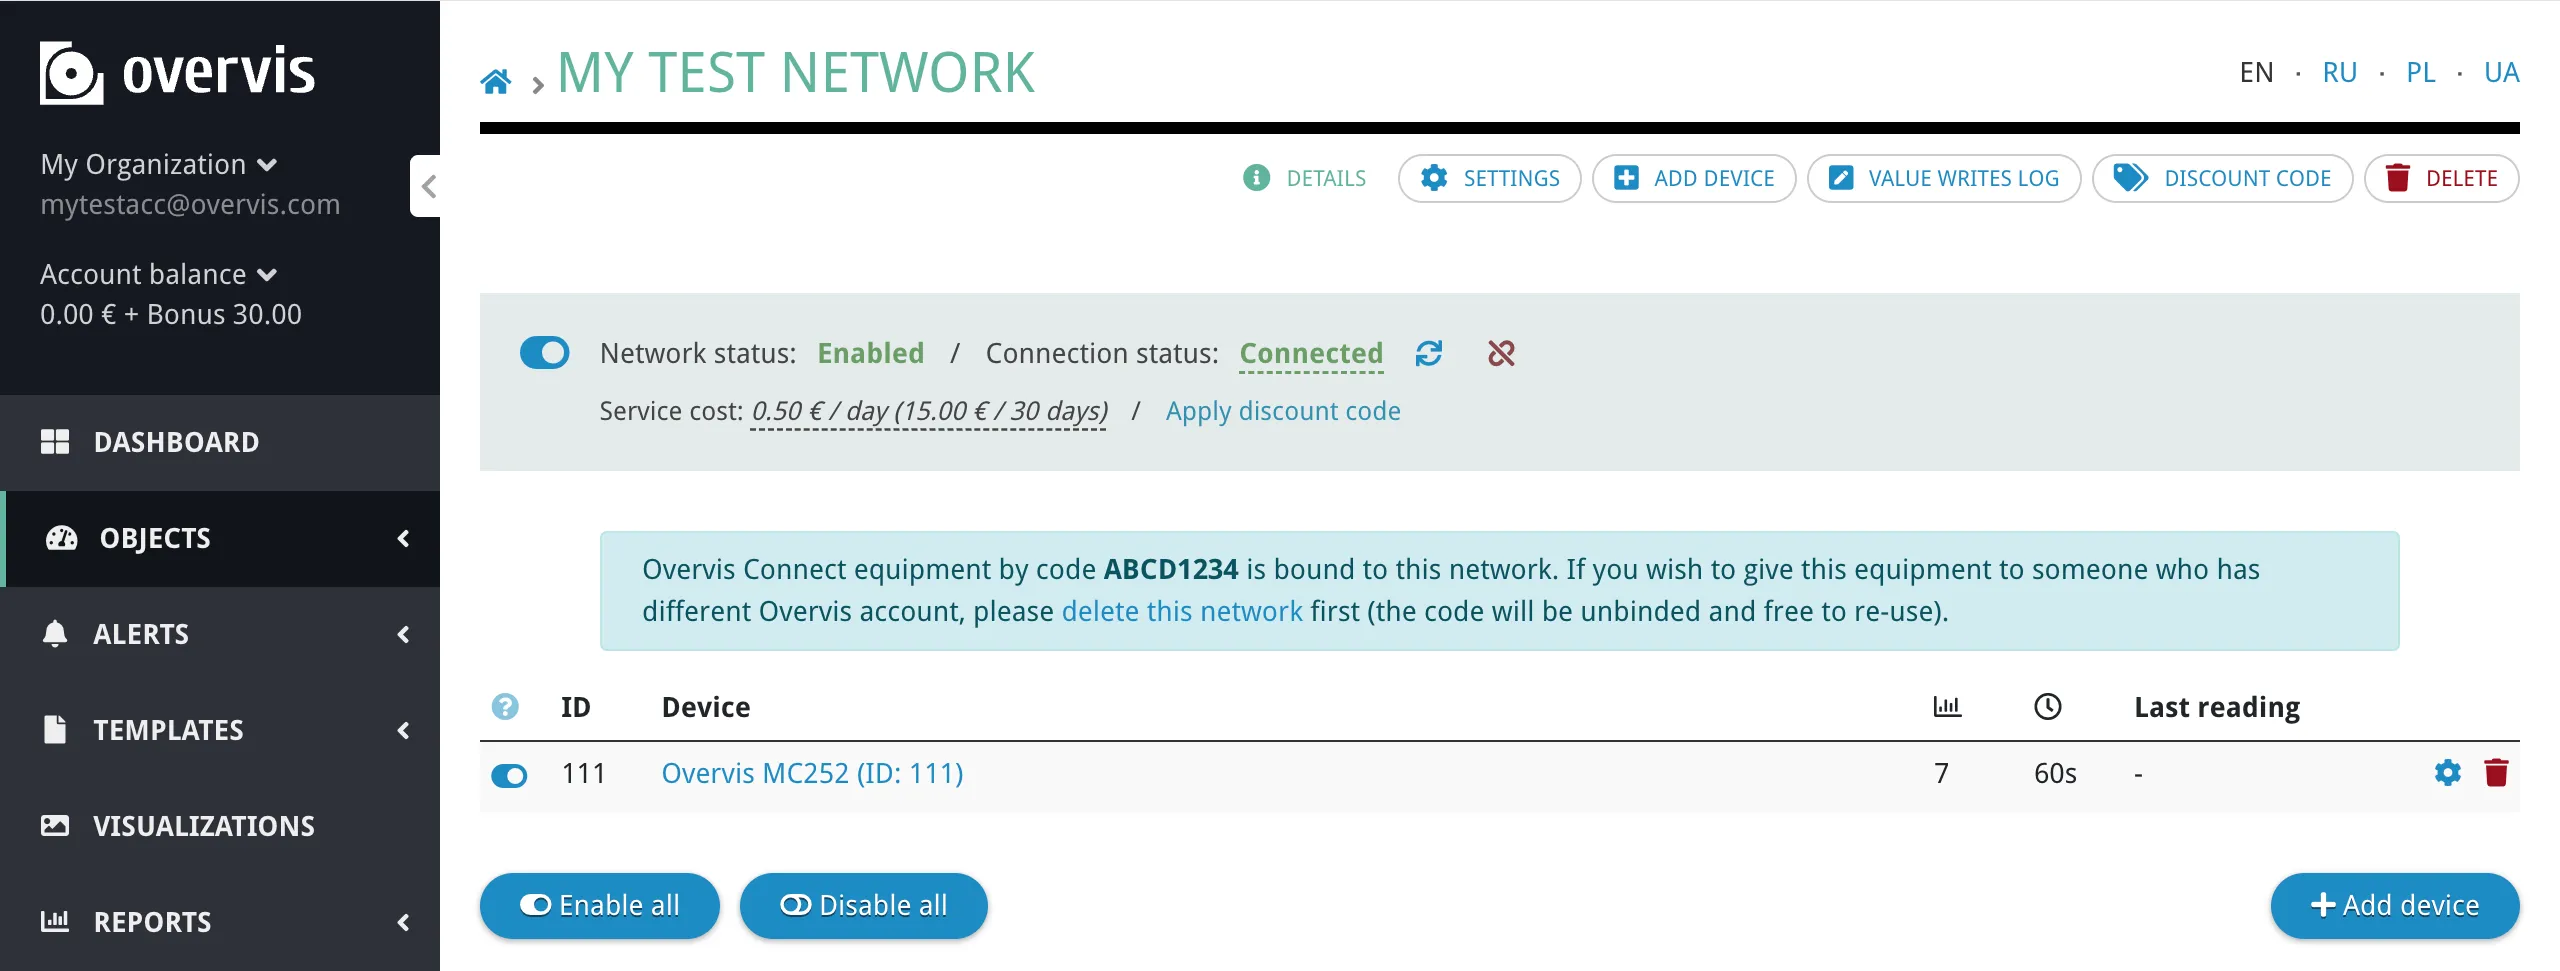
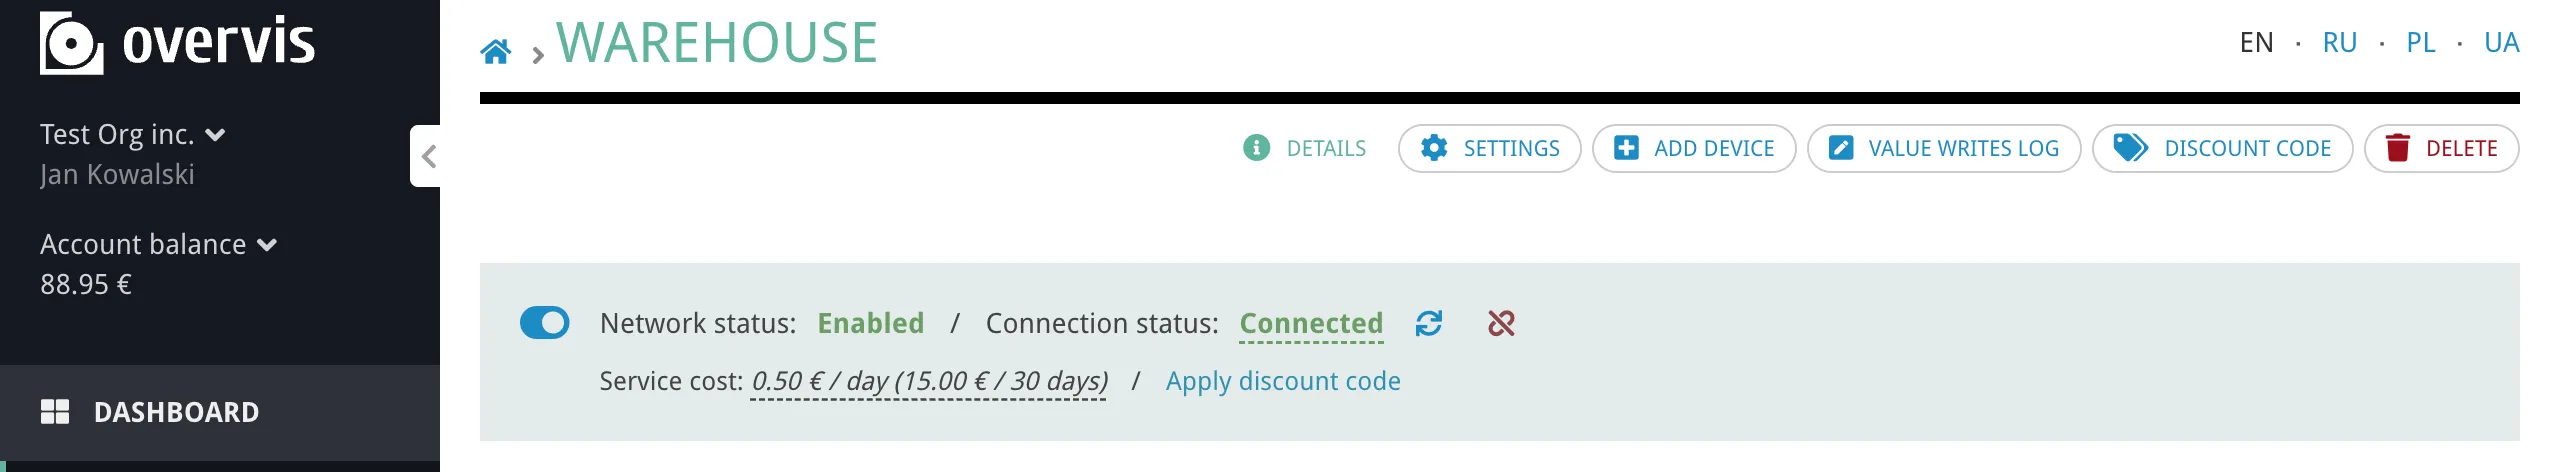
After creation, you are taken to the network page where you can see the controller and its connection status. Verify that the status shows the controller as connected before proceeding to the next step.
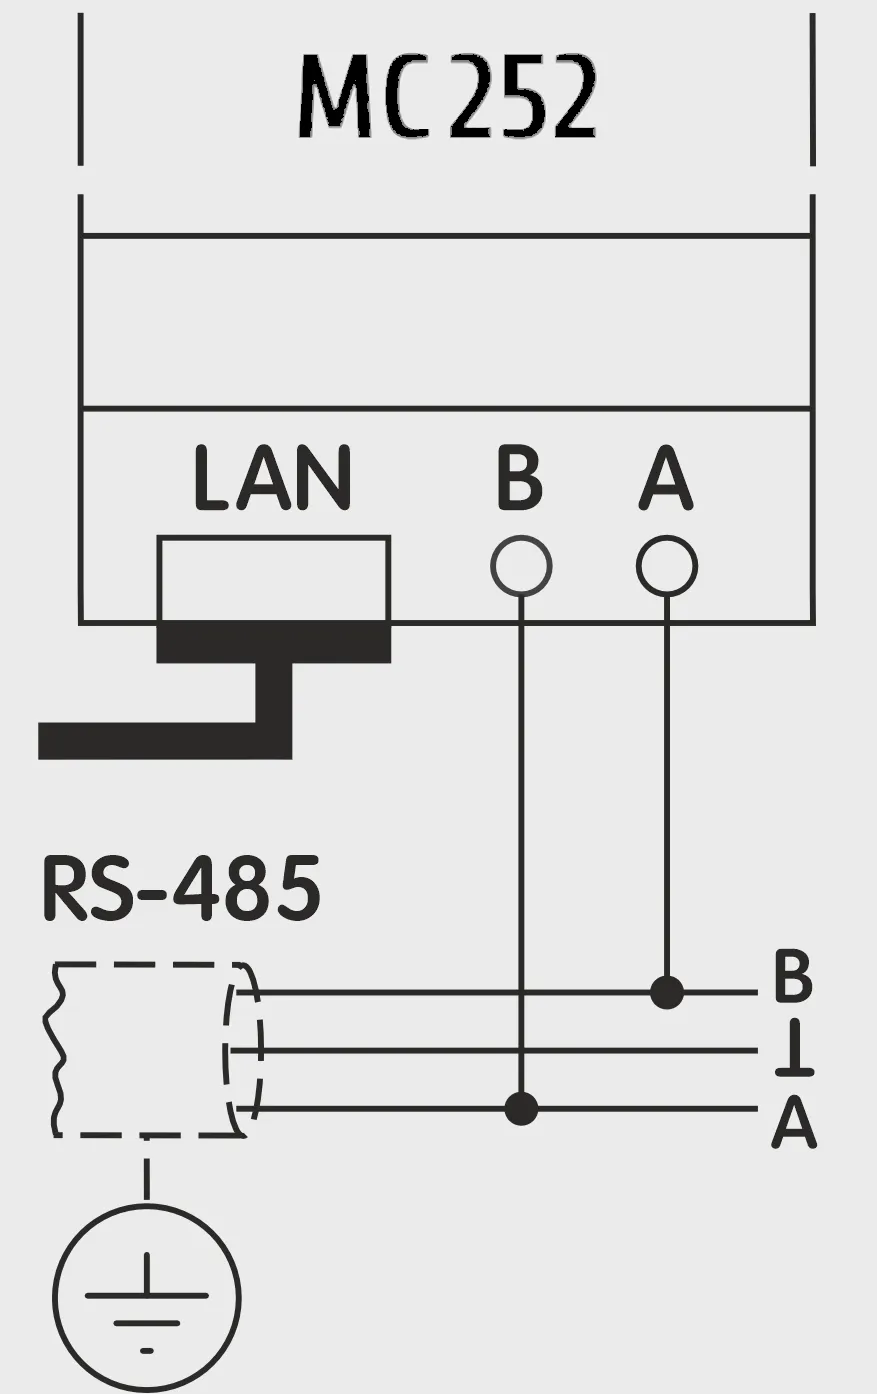
Step 4: Connect a Modbus RTU Device via RS-485Section titled “Step 4: Connect a Modbus RTU Device via RS-485”With the controller registered in Overvis, it is time to connect an actual Modbus RTU device to it. This step has two parts: physical wiring via RS-485 and registering the device in Overvis. Wire the RS-485 connectionSection titled “Wire the RS-485 connection”Connect the Modbus RTU device to the communication controller using a twisted-pair cable:
Make sure both devices use the same serial communication settings (baud rate, parity, stop bits). The MC252 defaults to 9600 baud, Modbus RTU, with automatic stop bit detection. Consult your device’s documentation and adjust settings on the controller if needed (via the MC252 web interface, Modbus tab — see MC252 Quick Start). Add the device in OvervisSection titled “Add the device in Overvis”
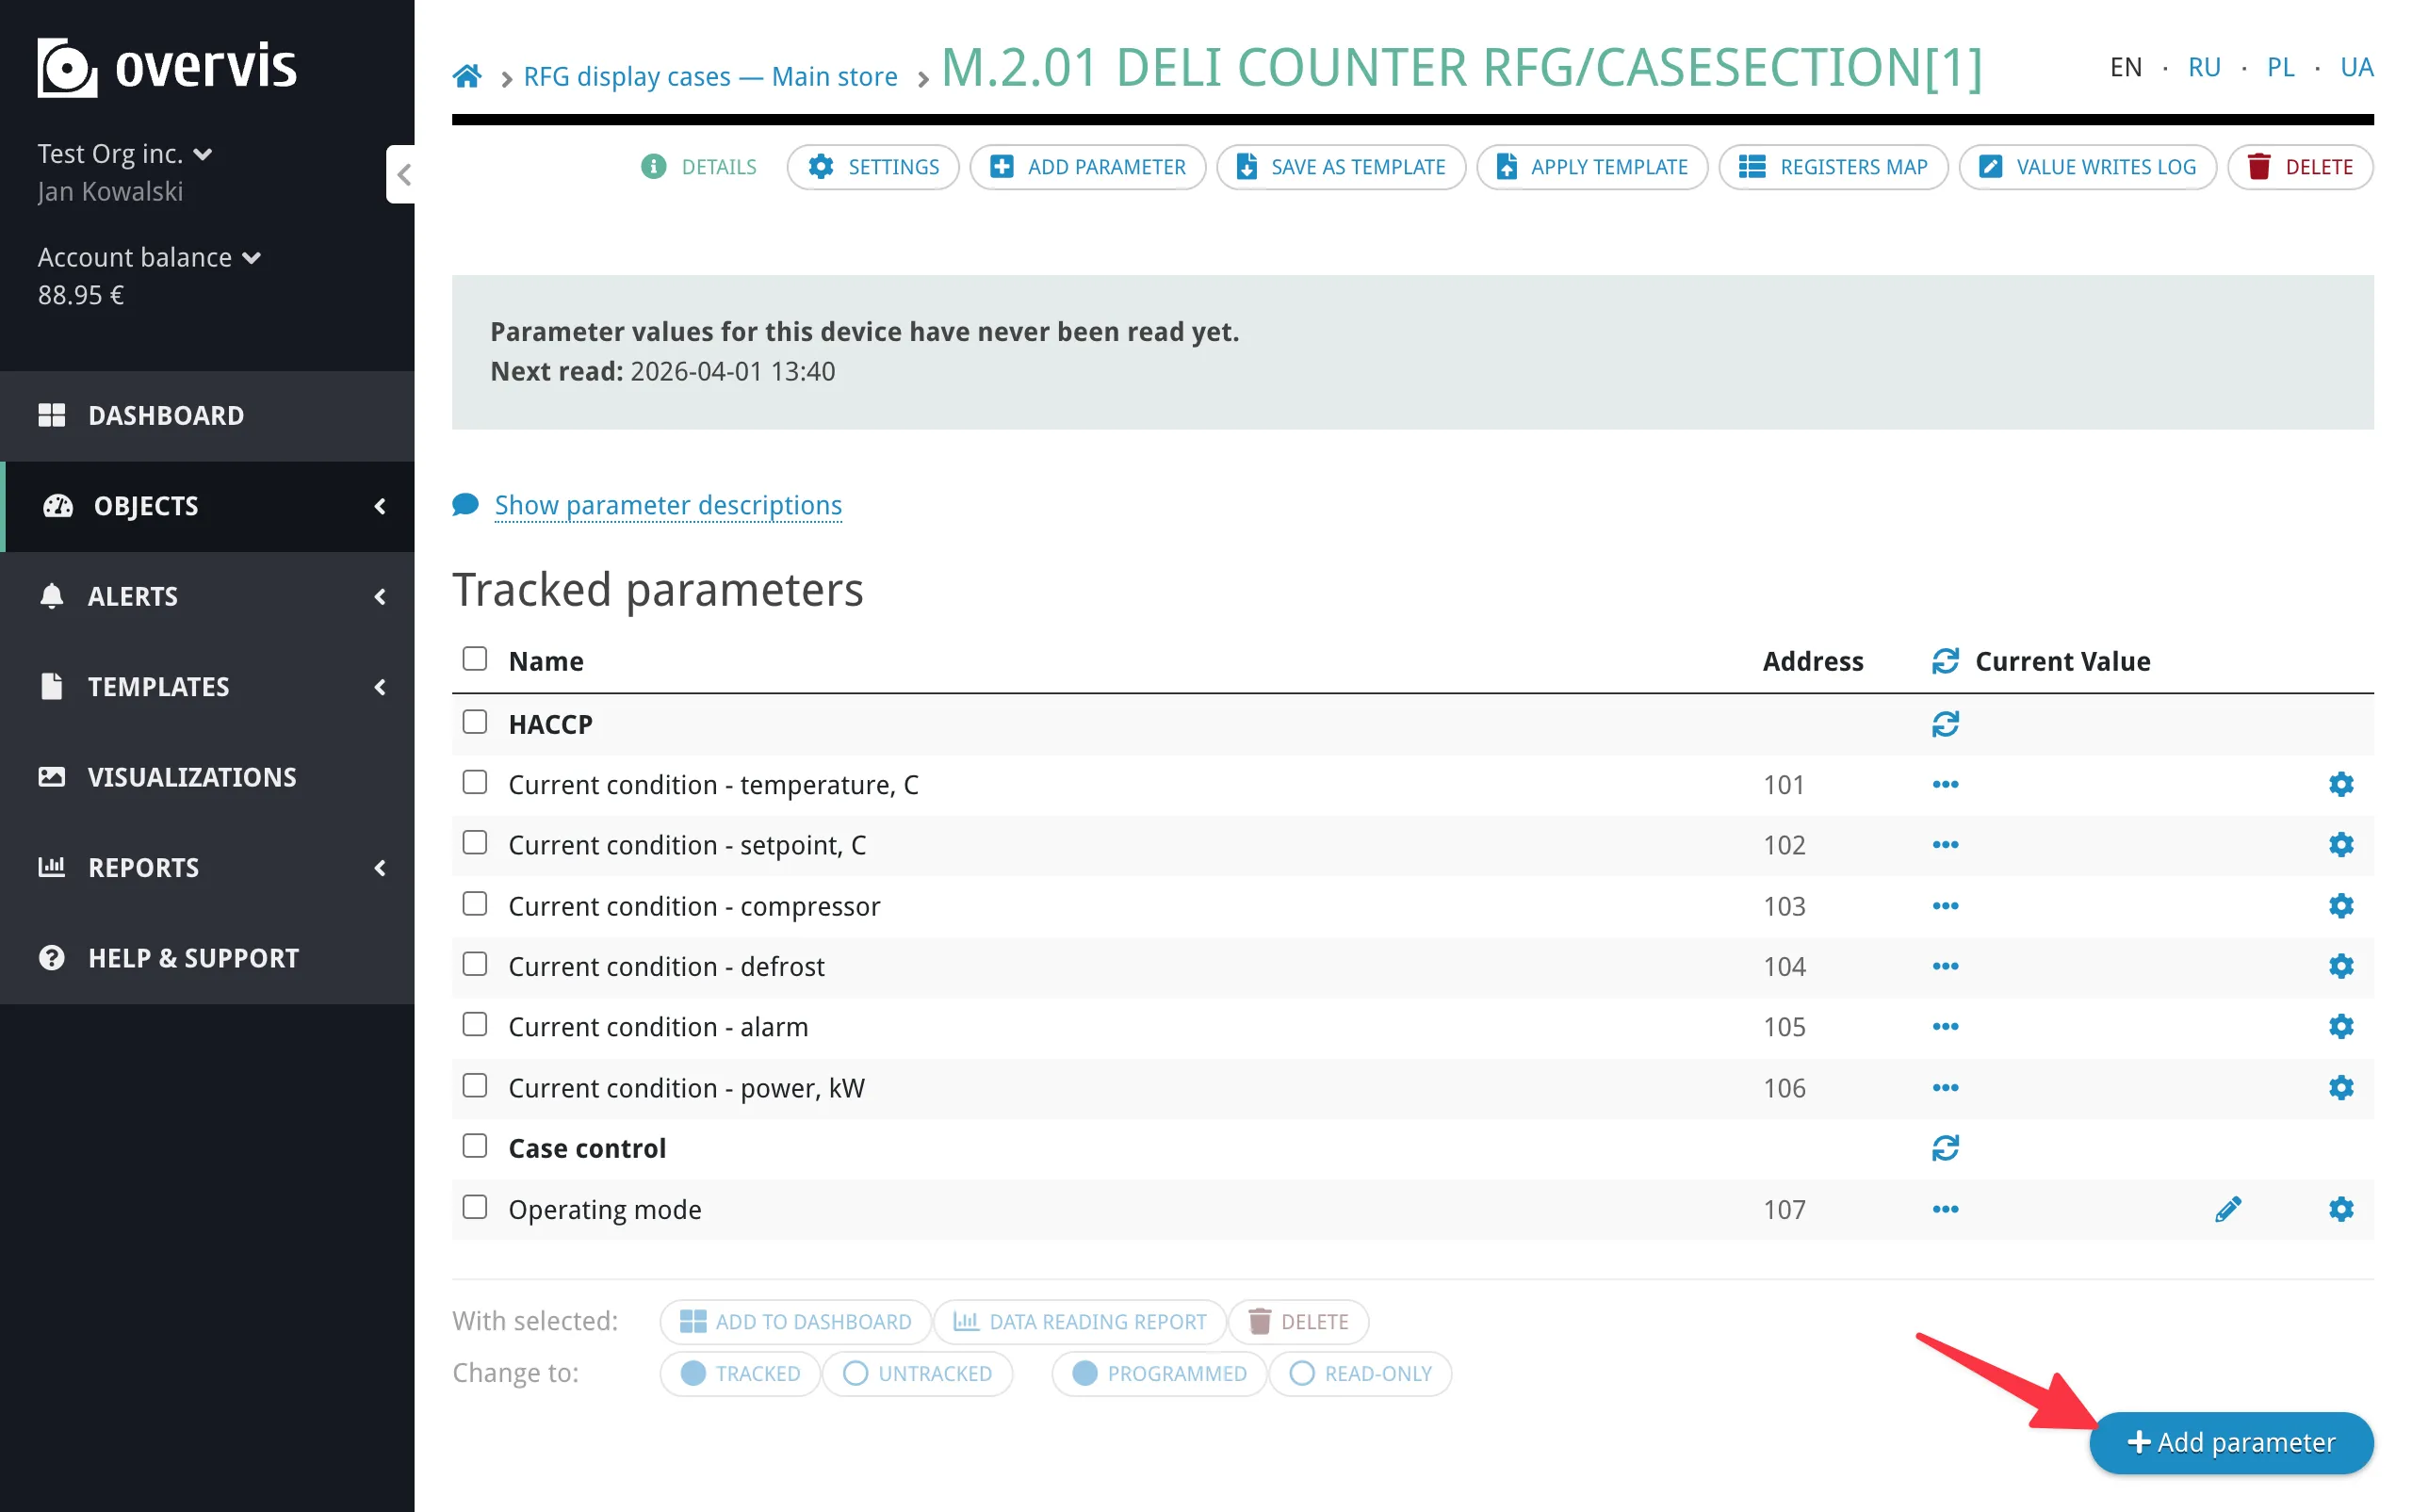
If no template is available for your device, you can add parameters manually after creating the device — see Step 5 and the Networks, Devices & Parameters documentation. You can also create your own templates for reuse — see Device Templates. Step 5: Read Device DataSection titled “Step 5: Read Device Data”Once a device is added to your network, you can view its data in Overvis.
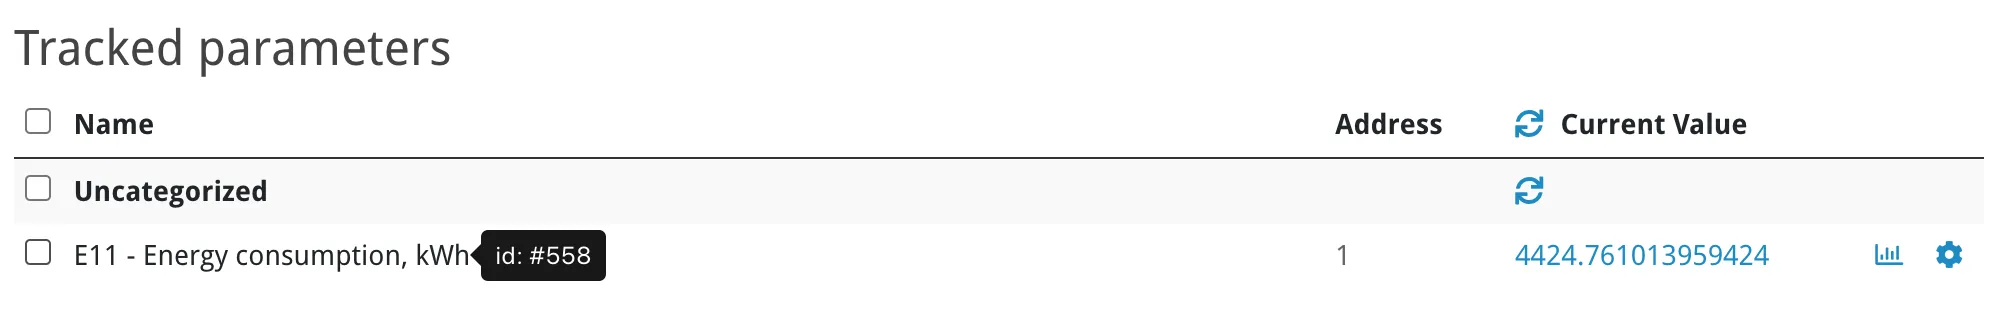
Each parameter row shows the parameter name, its Modbus address, and the current value (with units). Click on a value to refresh it from the device on demand. If you did not use a template, or need to add additional parameters, click Add Parameter in the sidebar and specify:
Click Create parameter to save.
Step 6: Write a Value to a DeviceSection titled “Step 6: Write a Value to a Device”Overvis allows you to write values to Modbus registers on the device — for example, changing a temperature setpoint, switching an output on or off, or adjusting a configuration parameter. Parameters in the Programmed section (those with the Programmable flag — set by the template or manually when adding a parameter) have a pencil icon next to their value. To change a value:
Overvis sends the Modbus write command to the device through the controller. The displayed value updates on the next read cycle (by default every 10 minutes, configurable per device in its settings). What’s Next?Section titled “What’s Next?”You now have a working Overvis Cloud setup with live data from your equipment. Here are the features to explore next:
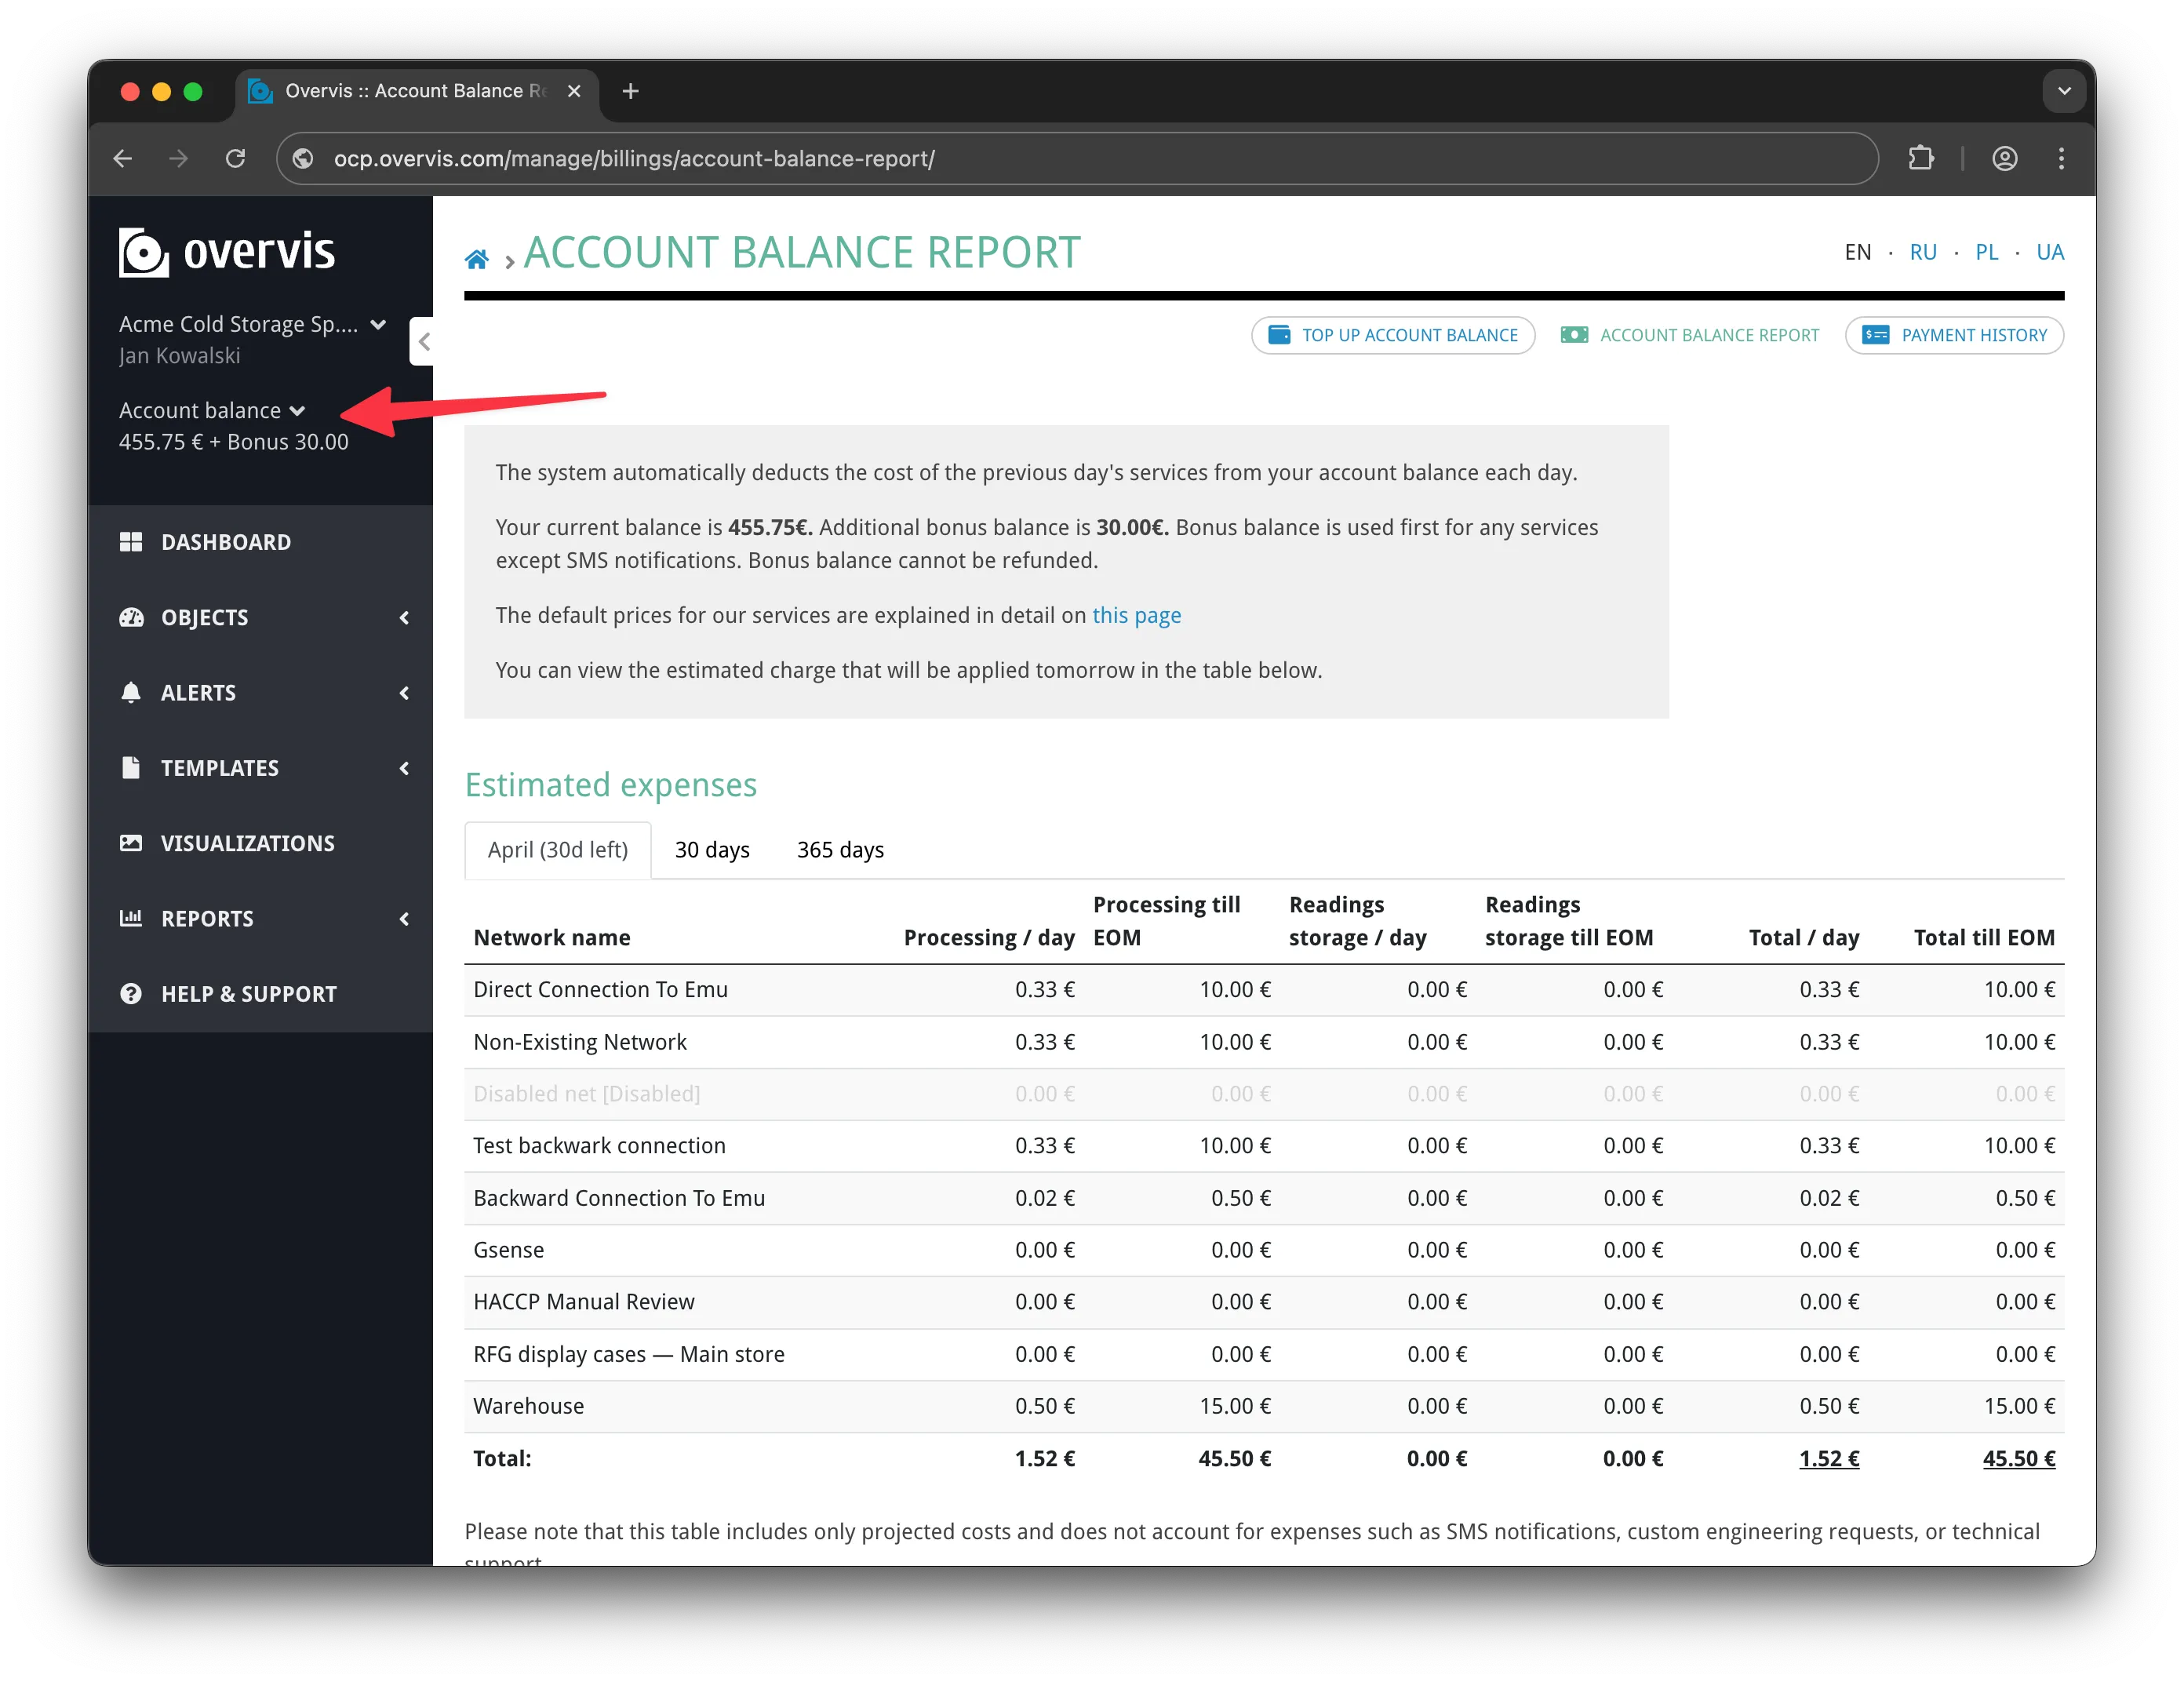
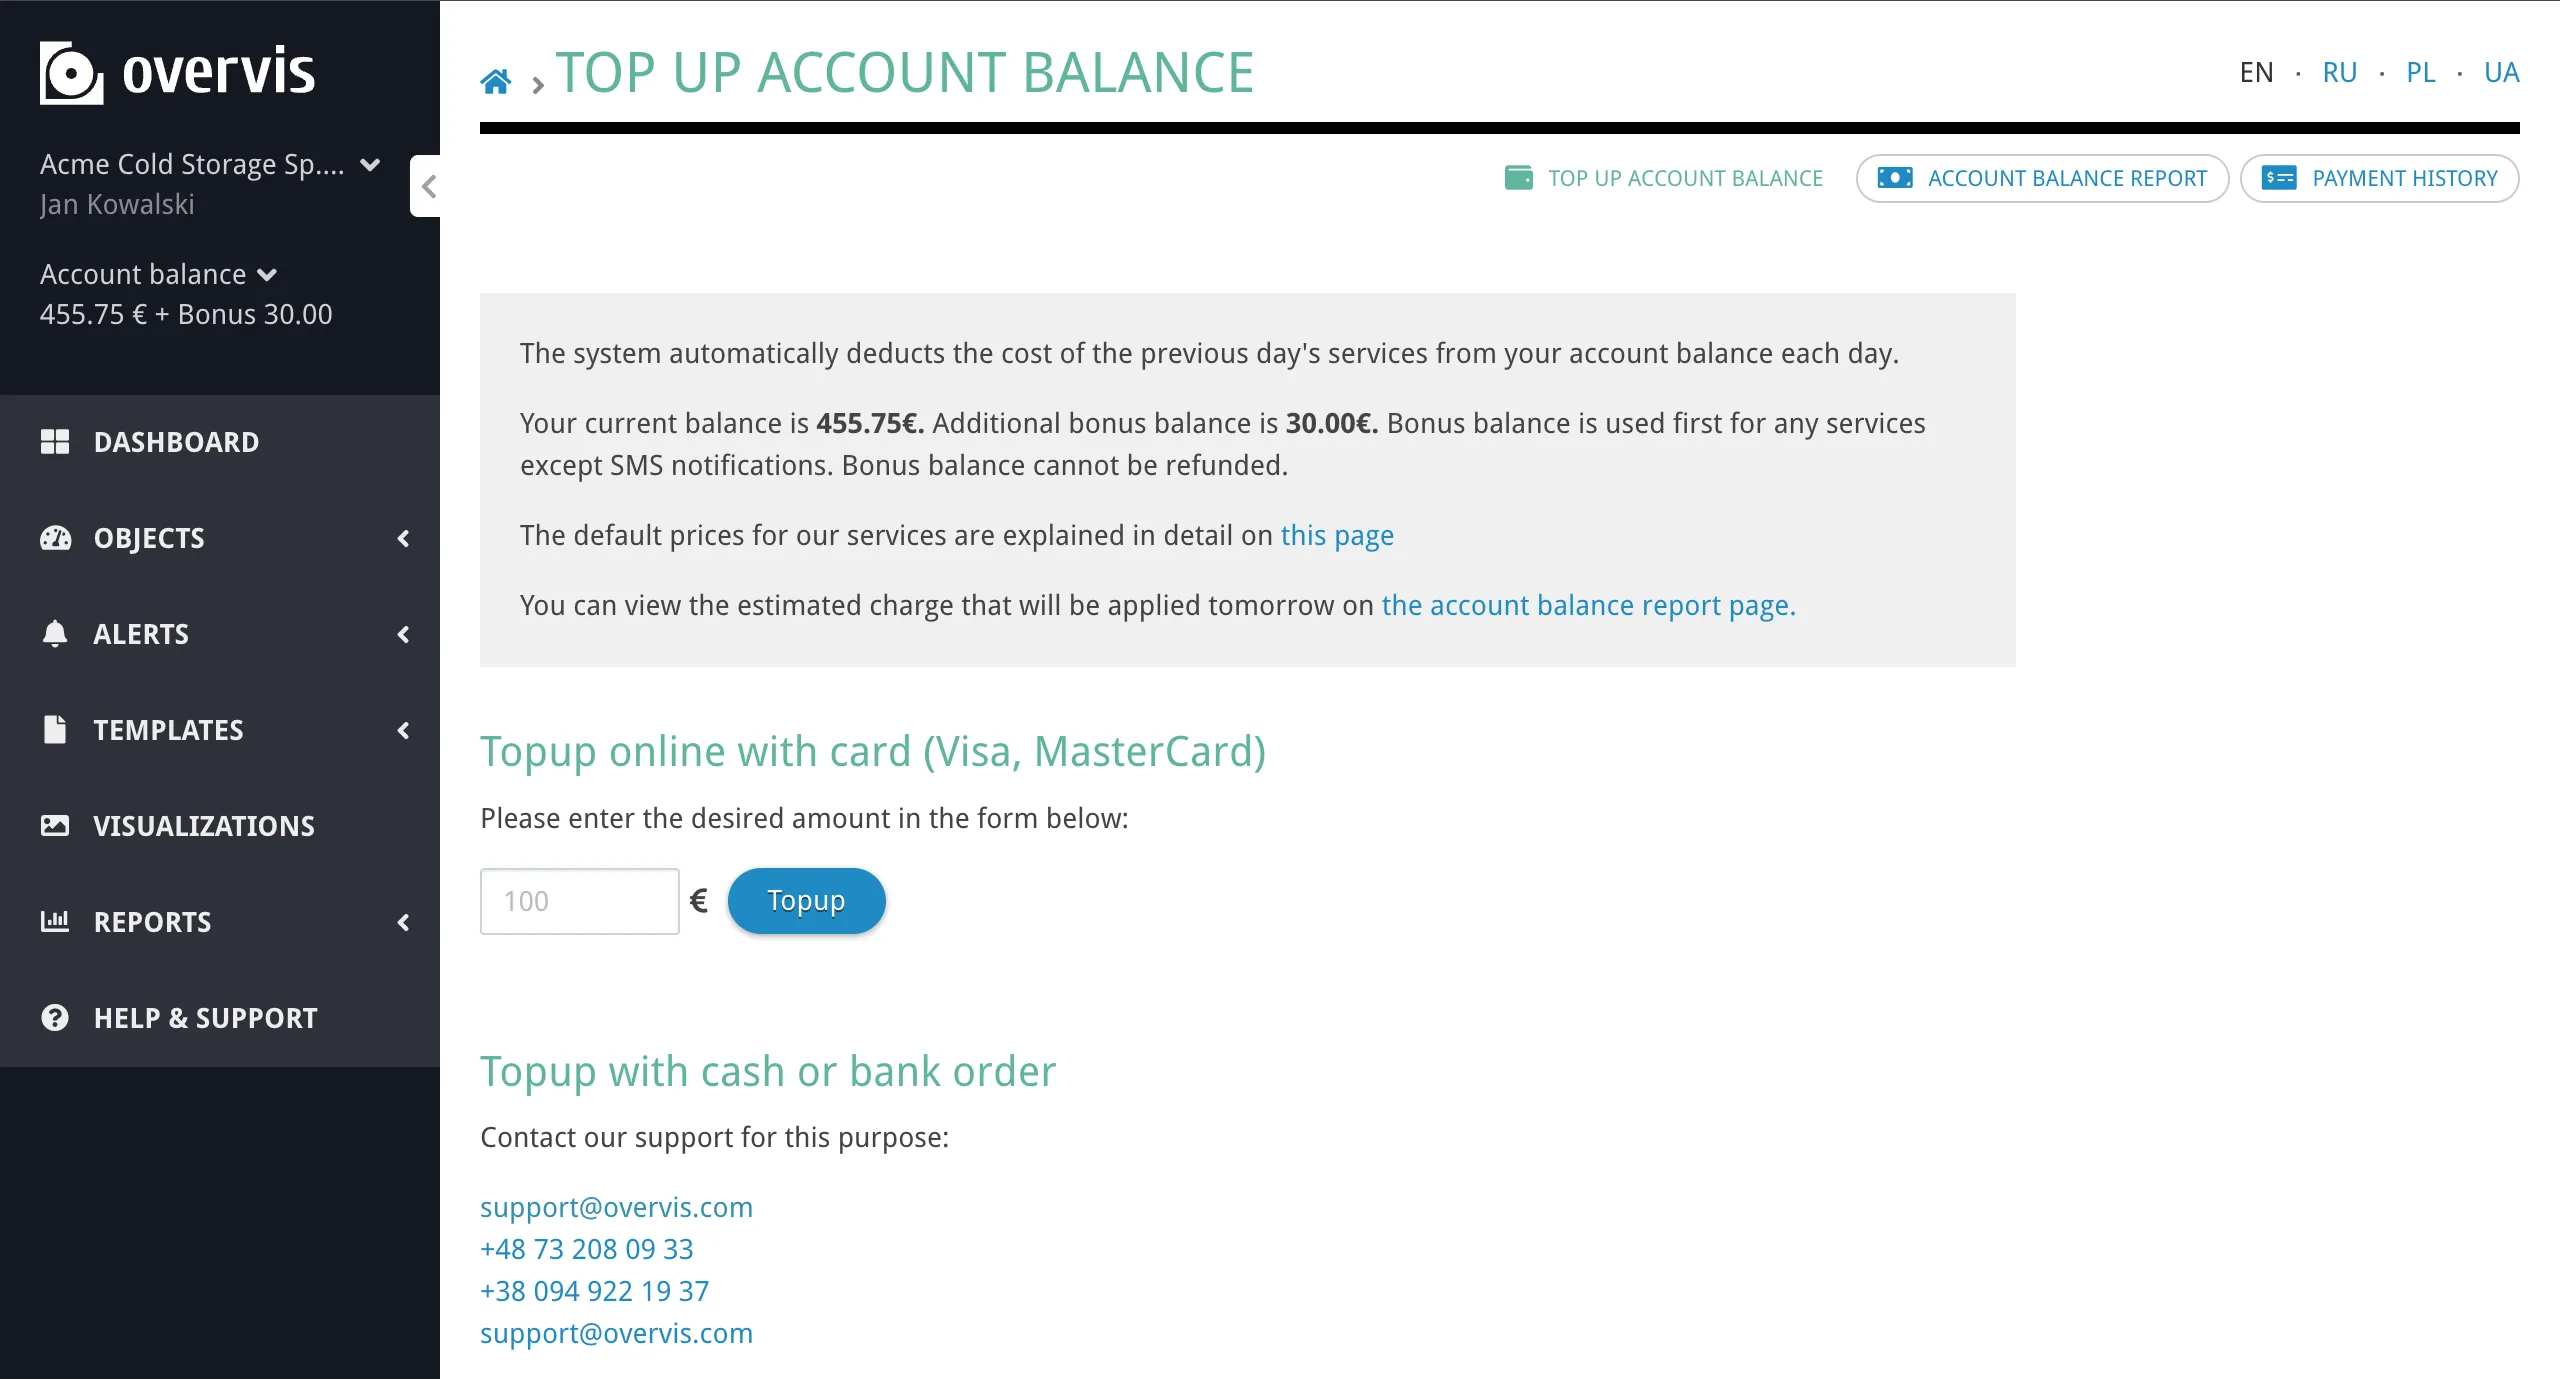
Free trial bonusSection titled “Free trial bonus”Every new account receives a €30 bonus — enough for 1–2 months of free experimentation, depending on the number of connected networks. No payment is required to get started. For pricing details and payment options, see Billing. Getting HelpSection titled “Getting Help”If you run into problems during setup:
For direct assistance:
|
| | ||||||||||||||||||||||||||||||||||||||||||||||||||||||||||||||||||||||||||||||||||||||||||||||||||||||||||||||||||||||||||||||||||||||||||||||||||||||||||||||||
|---|---|---|---|---|---|---|---|---|---|---|---|---|---|---|---|---|---|---|---|---|---|---|---|---|---|---|---|---|---|---|---|---|---|---|---|---|---|---|---|---|---|---|---|---|---|---|---|---|---|---|---|---|---|---|---|---|---|---|---|---|---|---|---|---|---|---|---|---|---|---|---|---|---|---|---|---|---|---|---|---|---|---|---|---|---|---|---|---|---|---|---|---|---|---|---|---|---|---|---|---|---|---|---|---|---|---|---|---|---|---|---|---|---|---|---|---|---|---|---|---|---|---|---|---|---|---|---|---|---|---|---|---|---|---|---|---|---|---|---|---|---|---|---|---|---|---|---|---|---|---|---|---|---|---|---|---|---|---|---|---|
Connecting EquipmentOvervis Cloud communicates with field equipment through Modbus TCP. In a typical setup, a communication controller (Modbus TCP gateway) connects to the internet and maintains a link with the Overvis server. Modbus RTU devices — temperature controllers, energy meters, PLCs, sensors — connect to the gateway via RS-485 and are accessed by Overvis through the gateway. graph LR
A["Modbus RTU<br/>devices"] -->|"RS-485<br/>Modbus RTU"| B["Communication<br/>controller<br/>(Modbus TCP gateway)"]
B -->|"Internet<br/>Modbus TCP"| C["Overvis Cloud"]
C -->|"Web / HTTPS"| D["User<br/>(browser)"]
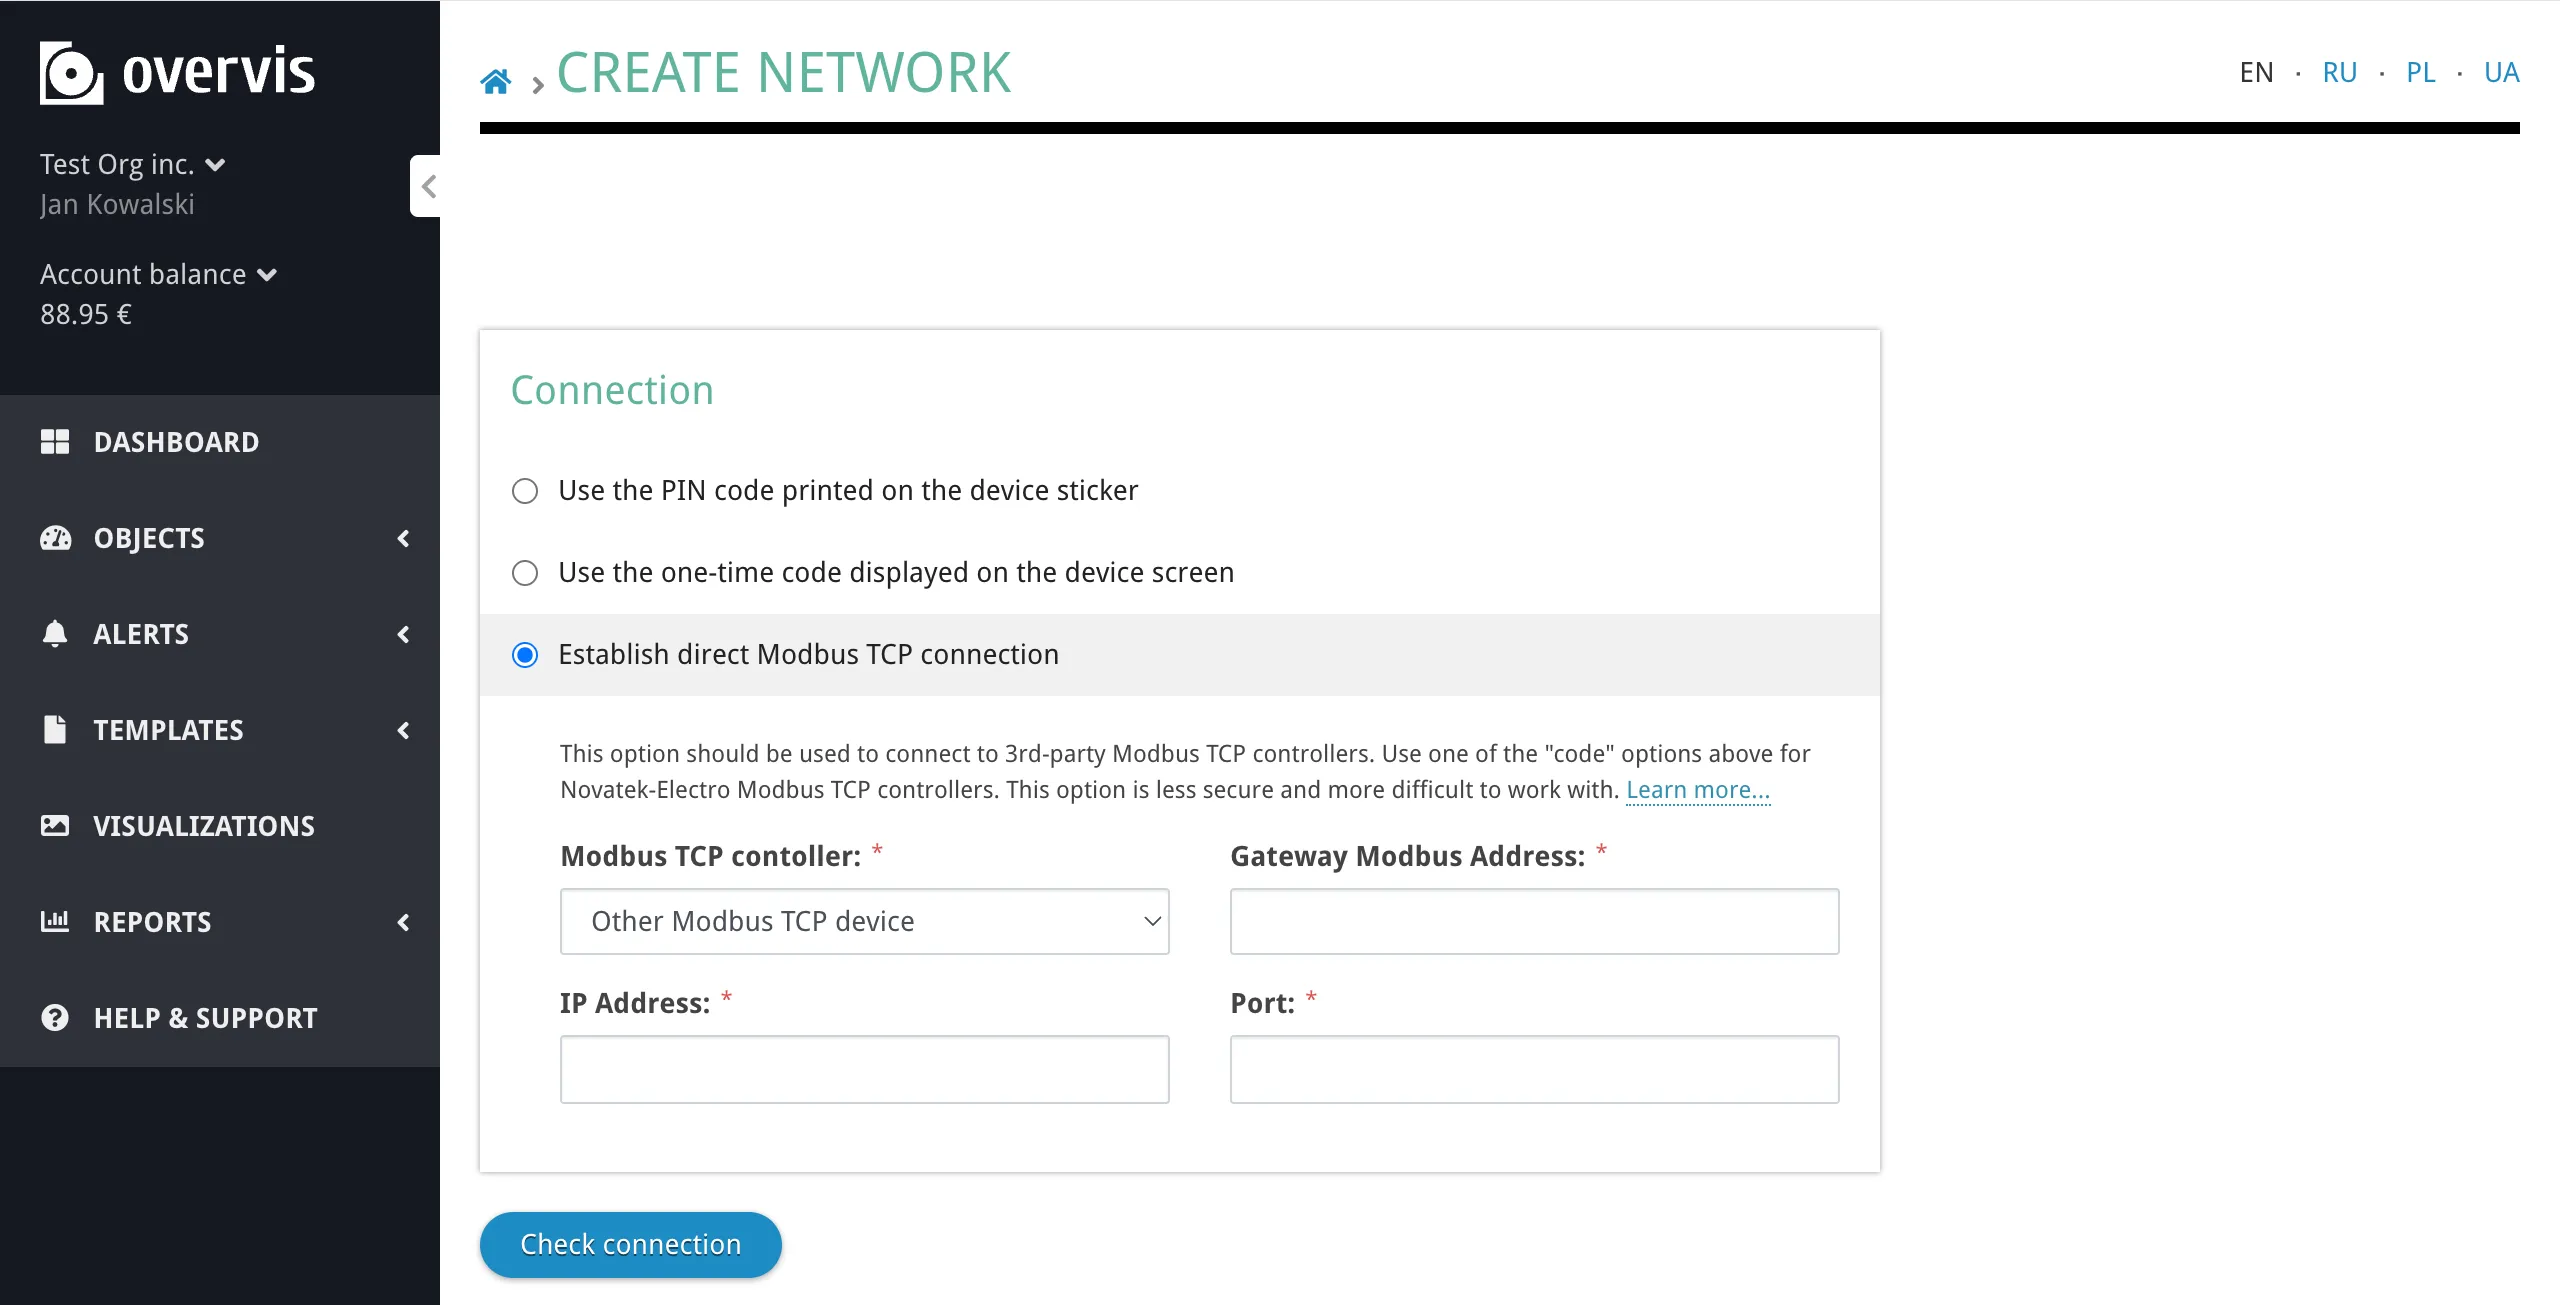
In Overvis, this entire chain is represented as a network: one communication controller plus all the Modbus RTU devices accessible through it. Each device within a network has a unique Modbus address (unit ID) and a set of parameters — individual register values that Overvis reads from or writes to the device. For details on managing networks, devices, and parameters after connection, see Networks, Devices & Parameters. This page covers everything needed to establish the connection: registering the gateway in Overvis, wiring RS-485 devices, configuring serial communication settings, resolving conflicts with previously registered devices, and diagnosing connection problems. Connection MethodsSection titled “Connection Methods”Overvis supports three methods for connecting a Modbus TCP gateway to the platform. The first two (PIN code and activation code) use a reverse connection — the controller initiates an outbound TCP connection to Overvis, which avoids firewall and NAT issues. The third method (direct connection) requires Overvis to connect inbound to the controller, which needs a static public IP and port forwarding.
PIN CodeSection titled “PIN Code”The PIN code is an 8-character alphanumeric code (e.g.
This is the simplest connection method and the recommended choice for first-time setup of Overvis-compatible controllers (MC252, EM-482, EM-483, and others). How it works: The controller connects outbound to Overvis and identifies itself by MAC address. When the user enters the PIN code, Overvis looks up the MAC address associated with that PIN and links it to the user’s network. Since the controller initiates the connection, no port forwarding or static IP is required — the connection works through firewalls, NAT, and dynamic IP addresses. sequenceDiagram
participant Controller
participant Overvis
participant User
Controller->>Overvis: Connect & send handshake (MAC address)
Overvis->>Controller: Confirm handshake
Note over Controller,Overvis: Reverse connection established, waiting for binding
User->>Overvis: Enter PIN code on Create Network page
Overvis->>Overvis: Look up MAC address by PIN
Overvis->>Overvis: Bind connection to user's network
Overvis->>User: Network created
loop Polling
Overvis->>Controller: Read registers (Modbus TCP)
Controller->>Overvis: Return data
end
Steps:
Important characteristics:
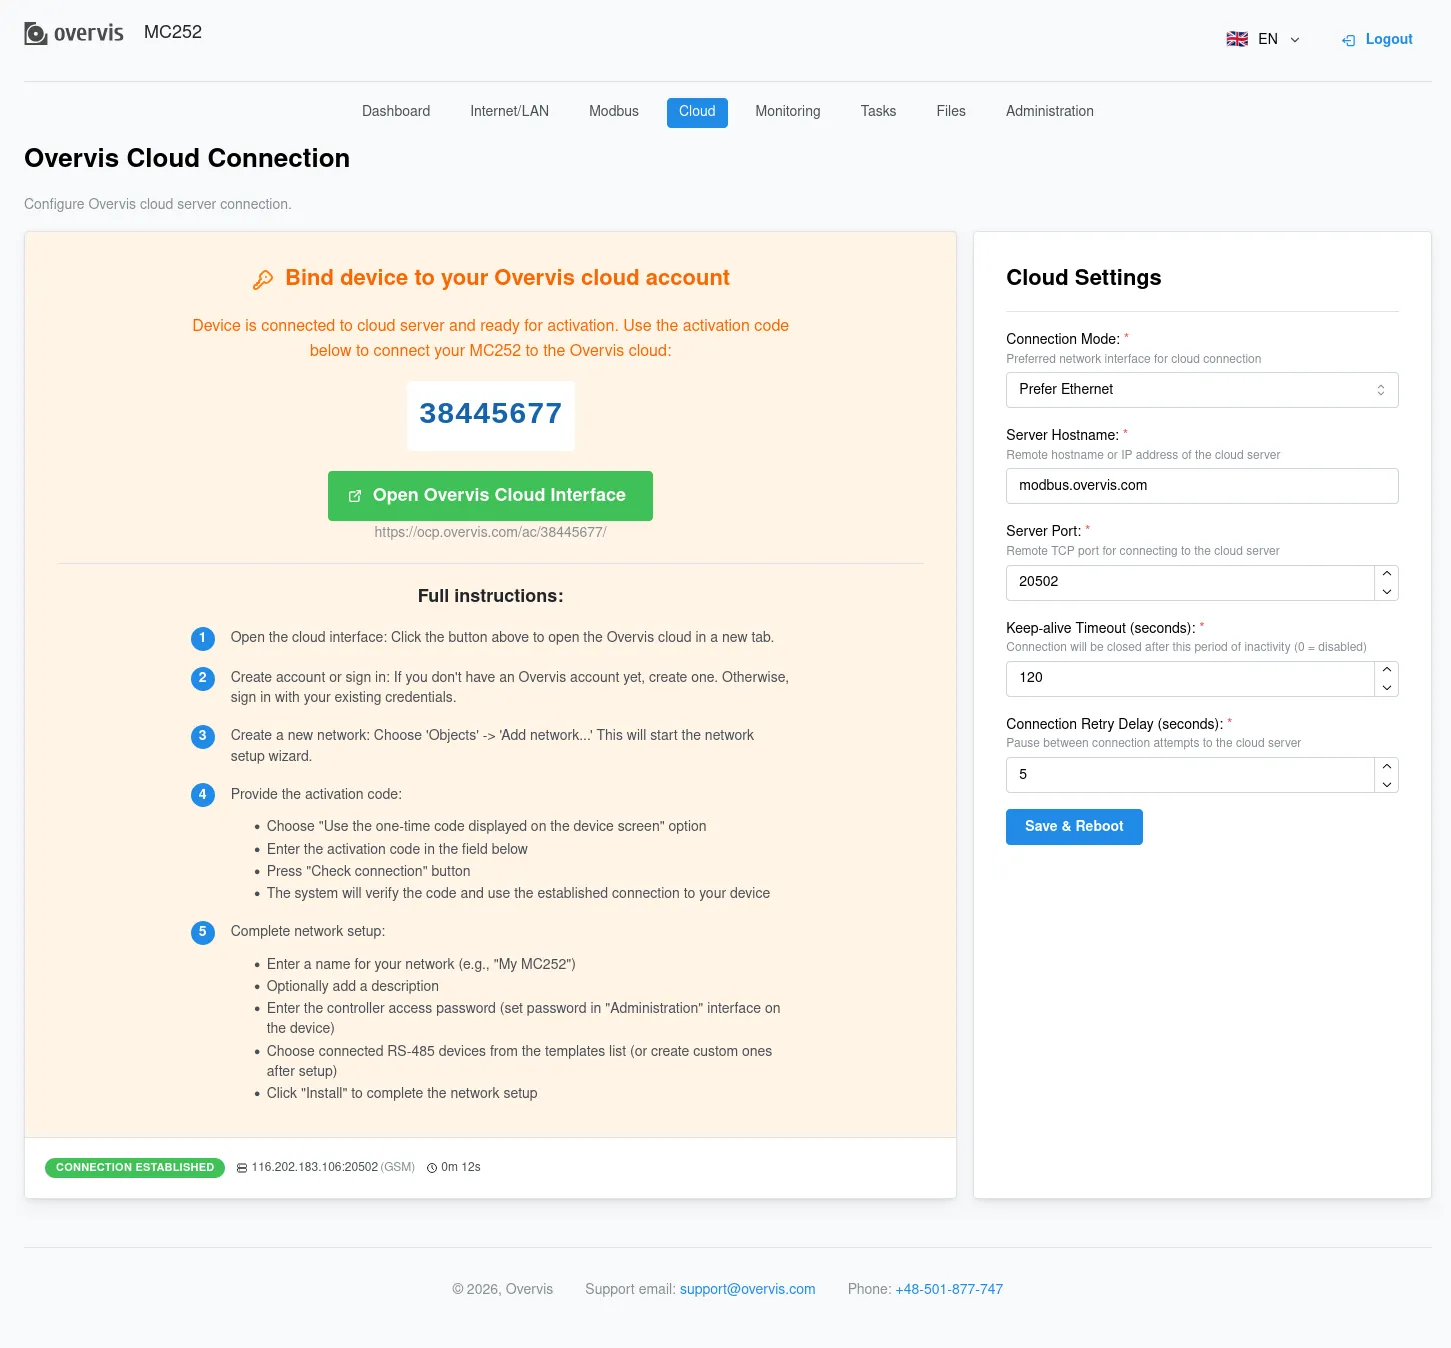
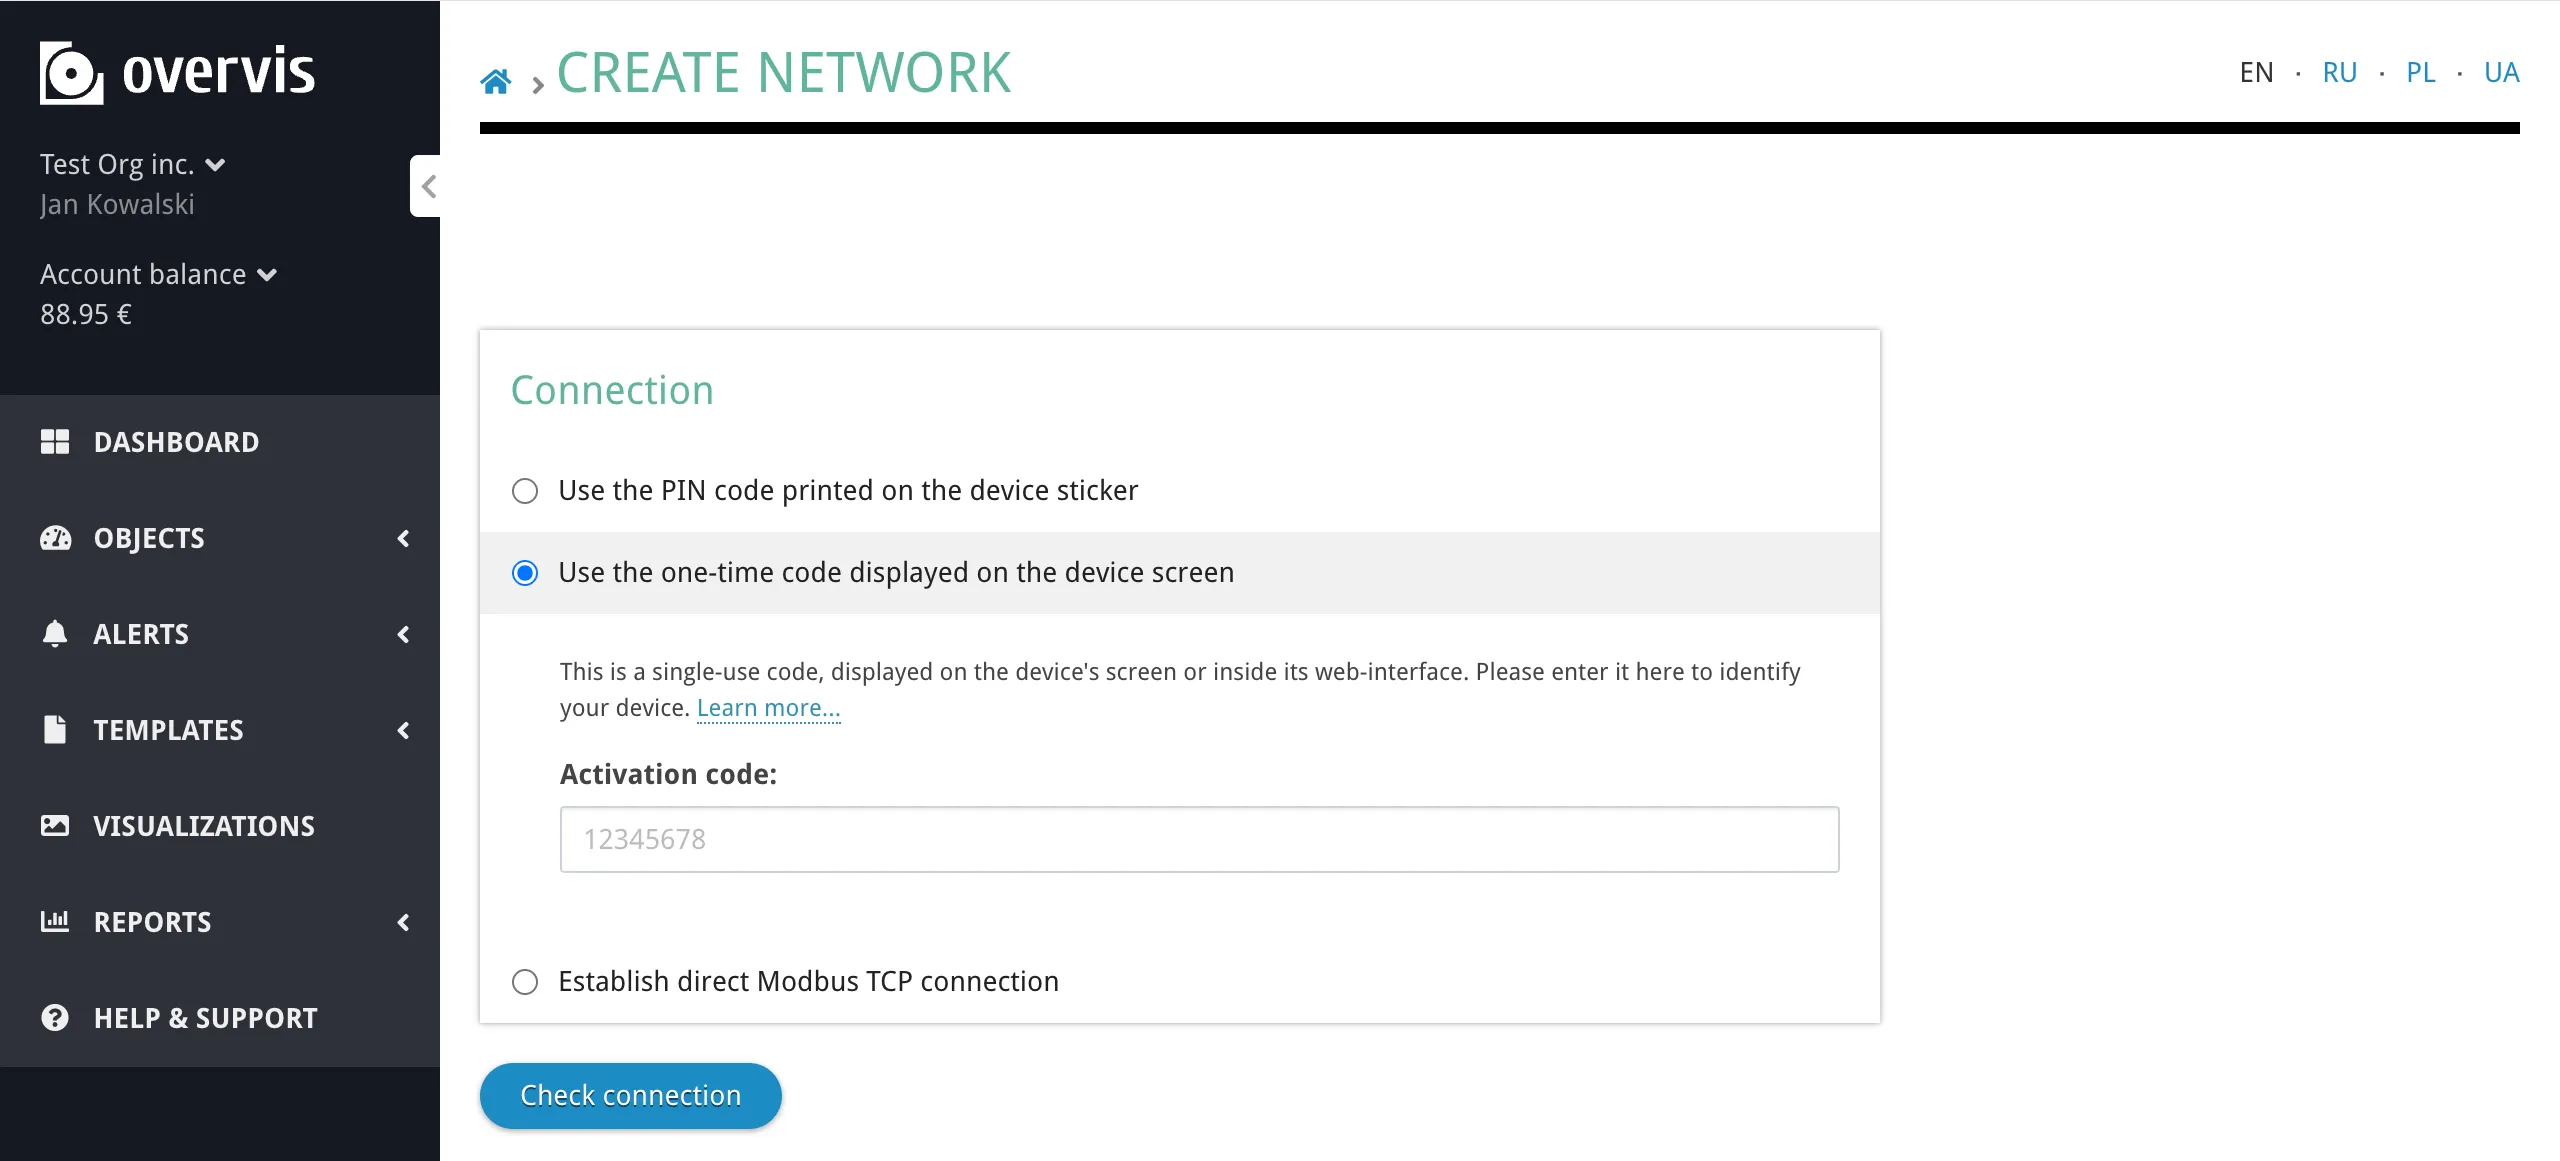
Activation CodeSection titled “Activation Code”The activation code is an 8-digit numeric code (e.g. This method is used when the PIN code sticker is unavailable, or when you need to take over a controller that is already registered under another Overvis account. Since reading the activation code requires physical or local network access to the device, it serves as proof of ownership. How it works: The controller connects outbound to Overvis and receives a unique activation code, which it displays on its screen or web interface. The user reads this code and enters it in Overvis to bind the device to their account. The code changes every time the controller re-establishes a connection to the server (until it is bound). sequenceDiagram
participant Controller
participant Overvis
participant User
Controller->>Overvis: Connect & send handshake (MAC address)
Overvis->>Overvis: Generate 8-digit activation code
Overvis->>Controller: Send activation code
Controller->>Controller: Display code on screen / web interface
Note over Controller,Overvis: Reverse connection established, waiting for binding
User->>Controller: Read activation code from display or web interface
User->>Overvis: Enter activation code on Create Network page
Overvis->>Overvis: Verify code, look up MAC address
Overvis->>Overvis: Bind connection to user's network
Overvis->>Controller: Confirm binding
Controller->>Controller: Display "active"
Overvis->>User: Network created
loop Polling
Overvis->>Controller: Read registers (Modbus TCP)
Controller->>Overvis: Return data
end
Steps:
Important characteristics:
Where to find the activation code by device:
Direct Modbus TCP ConnectionSection titled “Direct Modbus TCP Connection”With a direct connection, Overvis initiates the TCP connection to your controller by its public IP address and port. This method works with any standard Modbus TCP device — it does not require Overvis-specific firmware or integration. However, it is more complex to set up and less secure than the reverse connection methods.
How it works: Overvis establishes a TCP connection to the specified IP address and port, then communicates using standard Modbus TCP protocol. The connection is initiated by the Overvis server, so the target device must be reachable from the internet. sequenceDiagram
participant User
participant Overvis
participant Router
participant Controller
User->>Overvis: Create network with direct connection<br/>(IP, port, gateway Modbus ID)
Overvis->>Router: TCP connect to public IP:port
Router->>Controller: Forward to controller (port forwarding)
Controller->>Router: Modbus TCP response
Router->>Overvis: Forward response
Overvis->>User: Connection verified, network created
loop Polling
Overvis->>Router: Read registers request
Router->>Controller: Forward to controller
Controller->>Router: Return data
Router->>Overvis: Forward response
end
Prerequisites:
Steps:
When to use direct connection:
RS-485: Connecting Modbus RTU DevicesSection titled “RS-485: Connecting Modbus RTU Devices”Once a communication controller is registered in Overvis, the next step is connecting the actual field devices — temperature controllers, energy meters, PLCs, sensors, VFDs, and other Modbus RTU equipment — to the controller’s RS-485 port. WiringSection titled “Wiring”RS-485 uses a differential signaling pair — two wires carrying the same signal with opposite polarity. Connect the controller and device terminals as follows:
Use shielded twisted-pair cable (Category 1 or better). Connect the shield to ground at one end of the bus according to ANSI/TIA/EIA-485-A-1998. Bus topology: RS-485 is a bus topology — all devices are connected in a daisy-chain (device to device), not in a star pattern. Avoid stub cables (T-shaped branches) longer than a few centimeters, as they cause signal reflections. graph LR
A["Controller<br/>(master)"] --- B["Device 1<br/>ID: 1"]
B --- C["Device 2<br/>ID: 2"]
C --- D["Device 3<br/>ID: 3"]
D --- E["..."]
Termination: Long RS-485 buses or buses operating at high baud rates may need termination resistors (typically 120 Ω) at both ends of the bus to reduce signal reflections. Some controllers have built-in termination (e.g. EM-482 has a 1000 Ω internal terminator). If you experience intermittent communication errors on a long bus, adding termination resistors is the first thing to try. Serial Communication SettingsSection titled “Serial Communication Settings”All devices on the RS-485 bus must use the same serial communication settings. A mismatch in any of these parameters will prevent communication. Baud rate — the speed of data transmission in bits per second. Common values:
The baud rate must match between the controller and all connected devices. Higher baud rates allow faster polling but may be unreliable on long cable runs or in electrically noisy environments. Byte format (parity and stop bits): Each byte transmitted on the RS-485 bus includes optional parity and stop bits for error detection. The byte format must match across all devices. Common options:
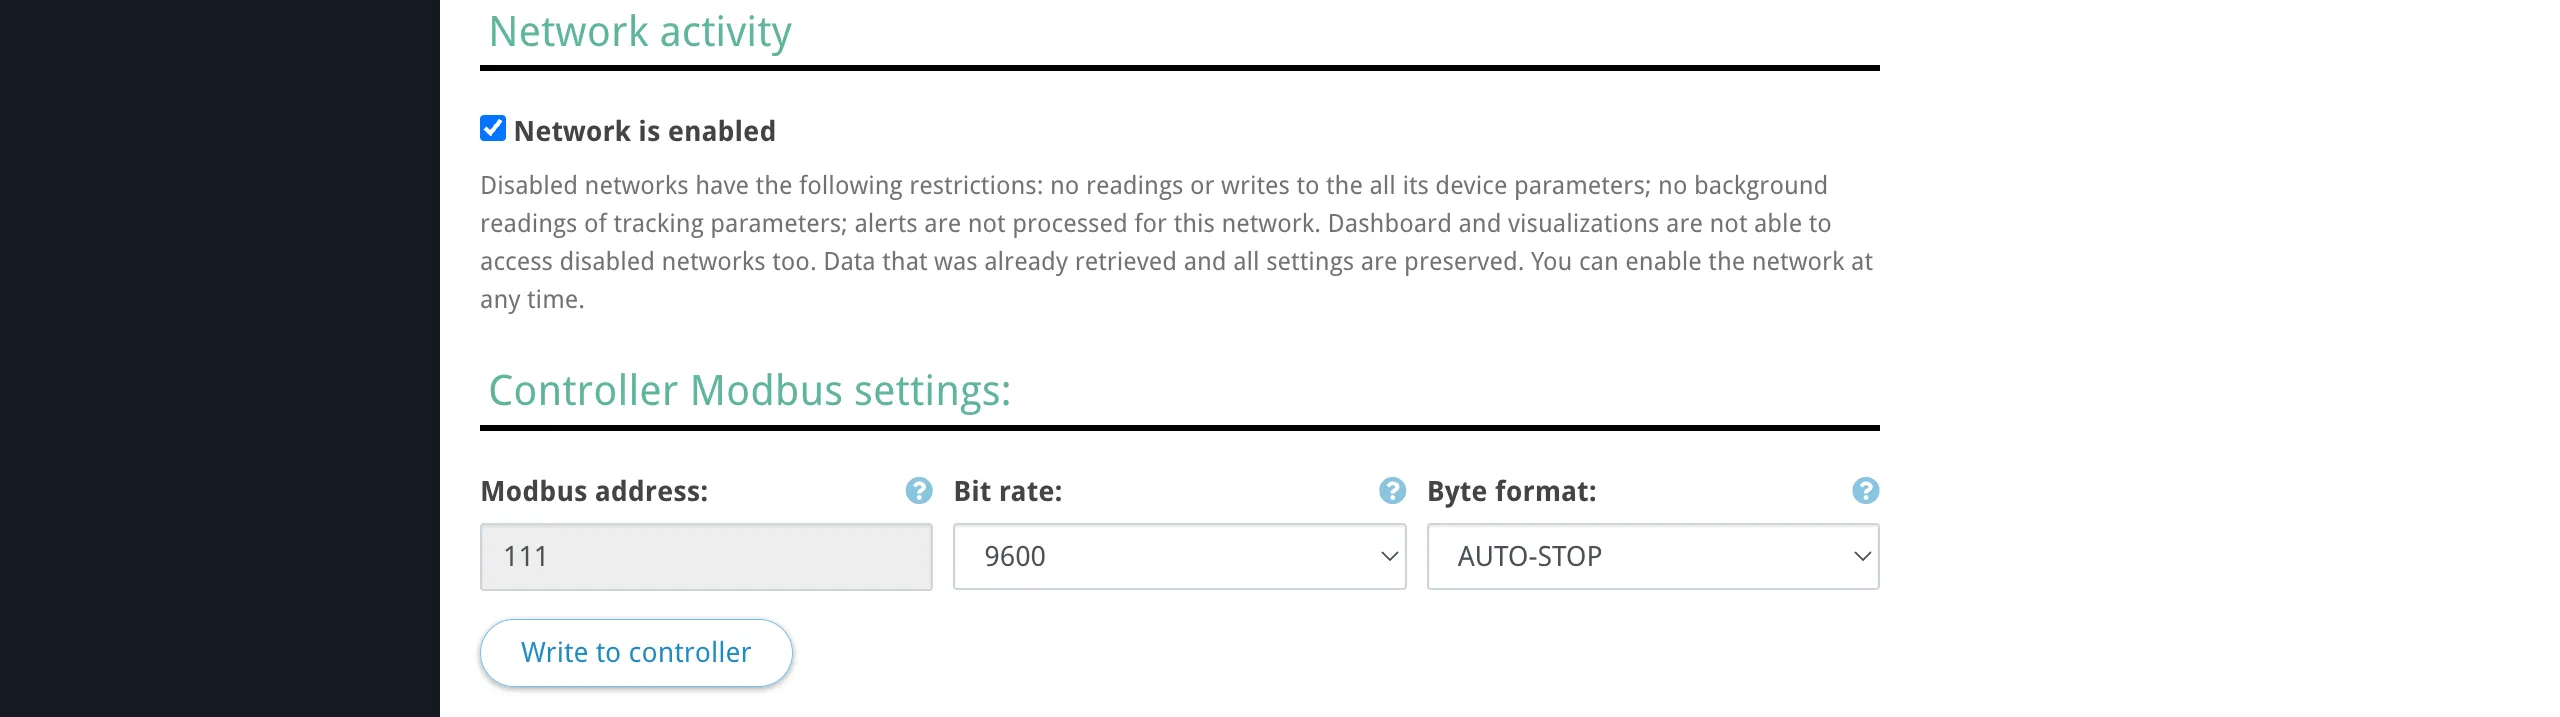
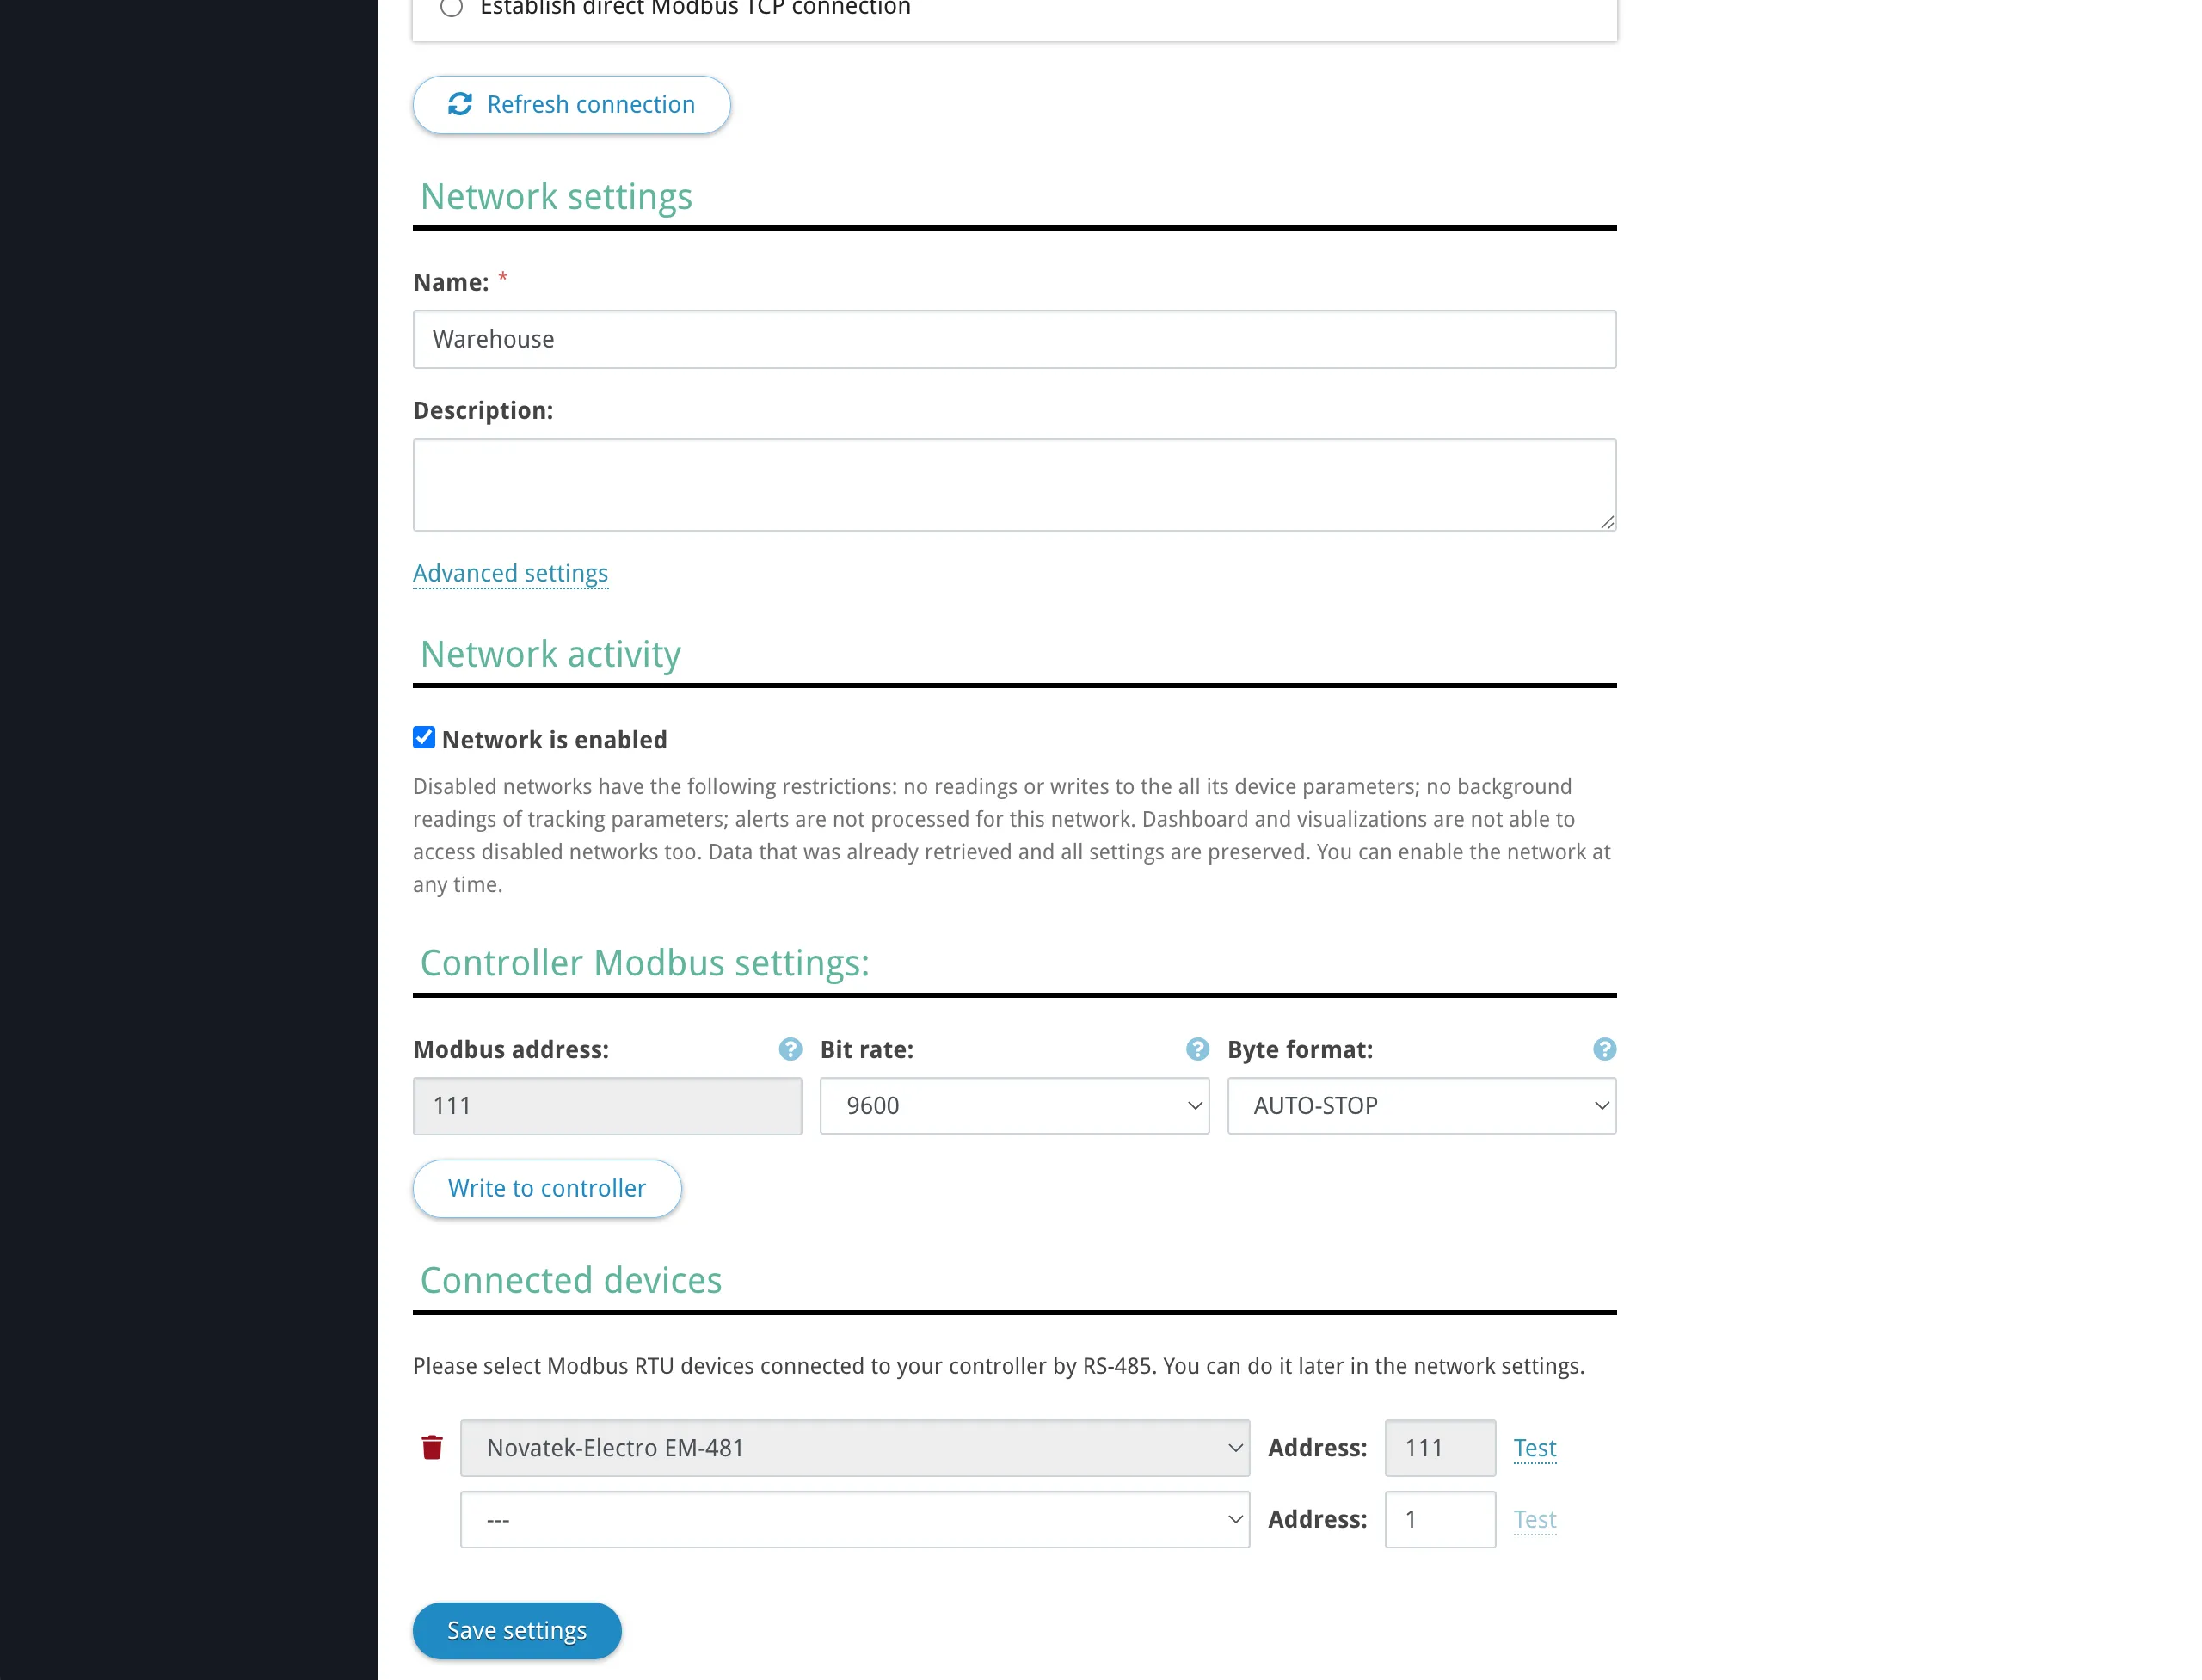
The most common configurations are 9600 baud, 8N1 or 9600 baud, 8E1. Check your device’s documentation for the required settings. Configuring serial settings on Overvis-compatible controllers: For controllers connected via reverse connection (PIN or activation code), Overvis can read and write the RS-485 serial settings remotely. After creating the network, the network settings page shows the current Bit rate and Byte format of the controller, and allows you to change them.
For third-party controllers connected via direct connection, configure the serial settings through the controller’s own interface (web interface, front panel, DIP switches, etc.). Bus Length and Device CountSection titled “Bus Length and Device Count”Maximum cable length: The RS-485 standard (ANSI/TIA/EIA-485-A) specifies a maximum bus length of 1200 meters (4000 feet). In practice, the achievable distance depends on the baud rate, cable quality, and electrical noise environment:
These are approximate values. Use shorter runs in electrically noisy environments (near VFDs, high-voltage lines, welding equipment). If you need to extend beyond 1200 m, use RS-485 repeaters or a second communication controller with its own Overvis network. Maximum device count: The number of devices on a single RS-485 bus depends on the receiver input impedance of the devices:
Most modern Modbus RTU devices use 1/4 or 1/8 unit load receivers, allowing 128–256 devices on a single bus. Check the RS-485 transceiver specifications in your devices’ datasheets. Each device must have a unique Modbus address (unit ID) in the range 0–255. Address 0 is reserved for broadcast in the Modbus protocol (writes to all devices, no response expected). Modbus RTU and ASCIISection titled “Modbus RTU and ASCII”Modbus over RS-485 supports two framing modes:
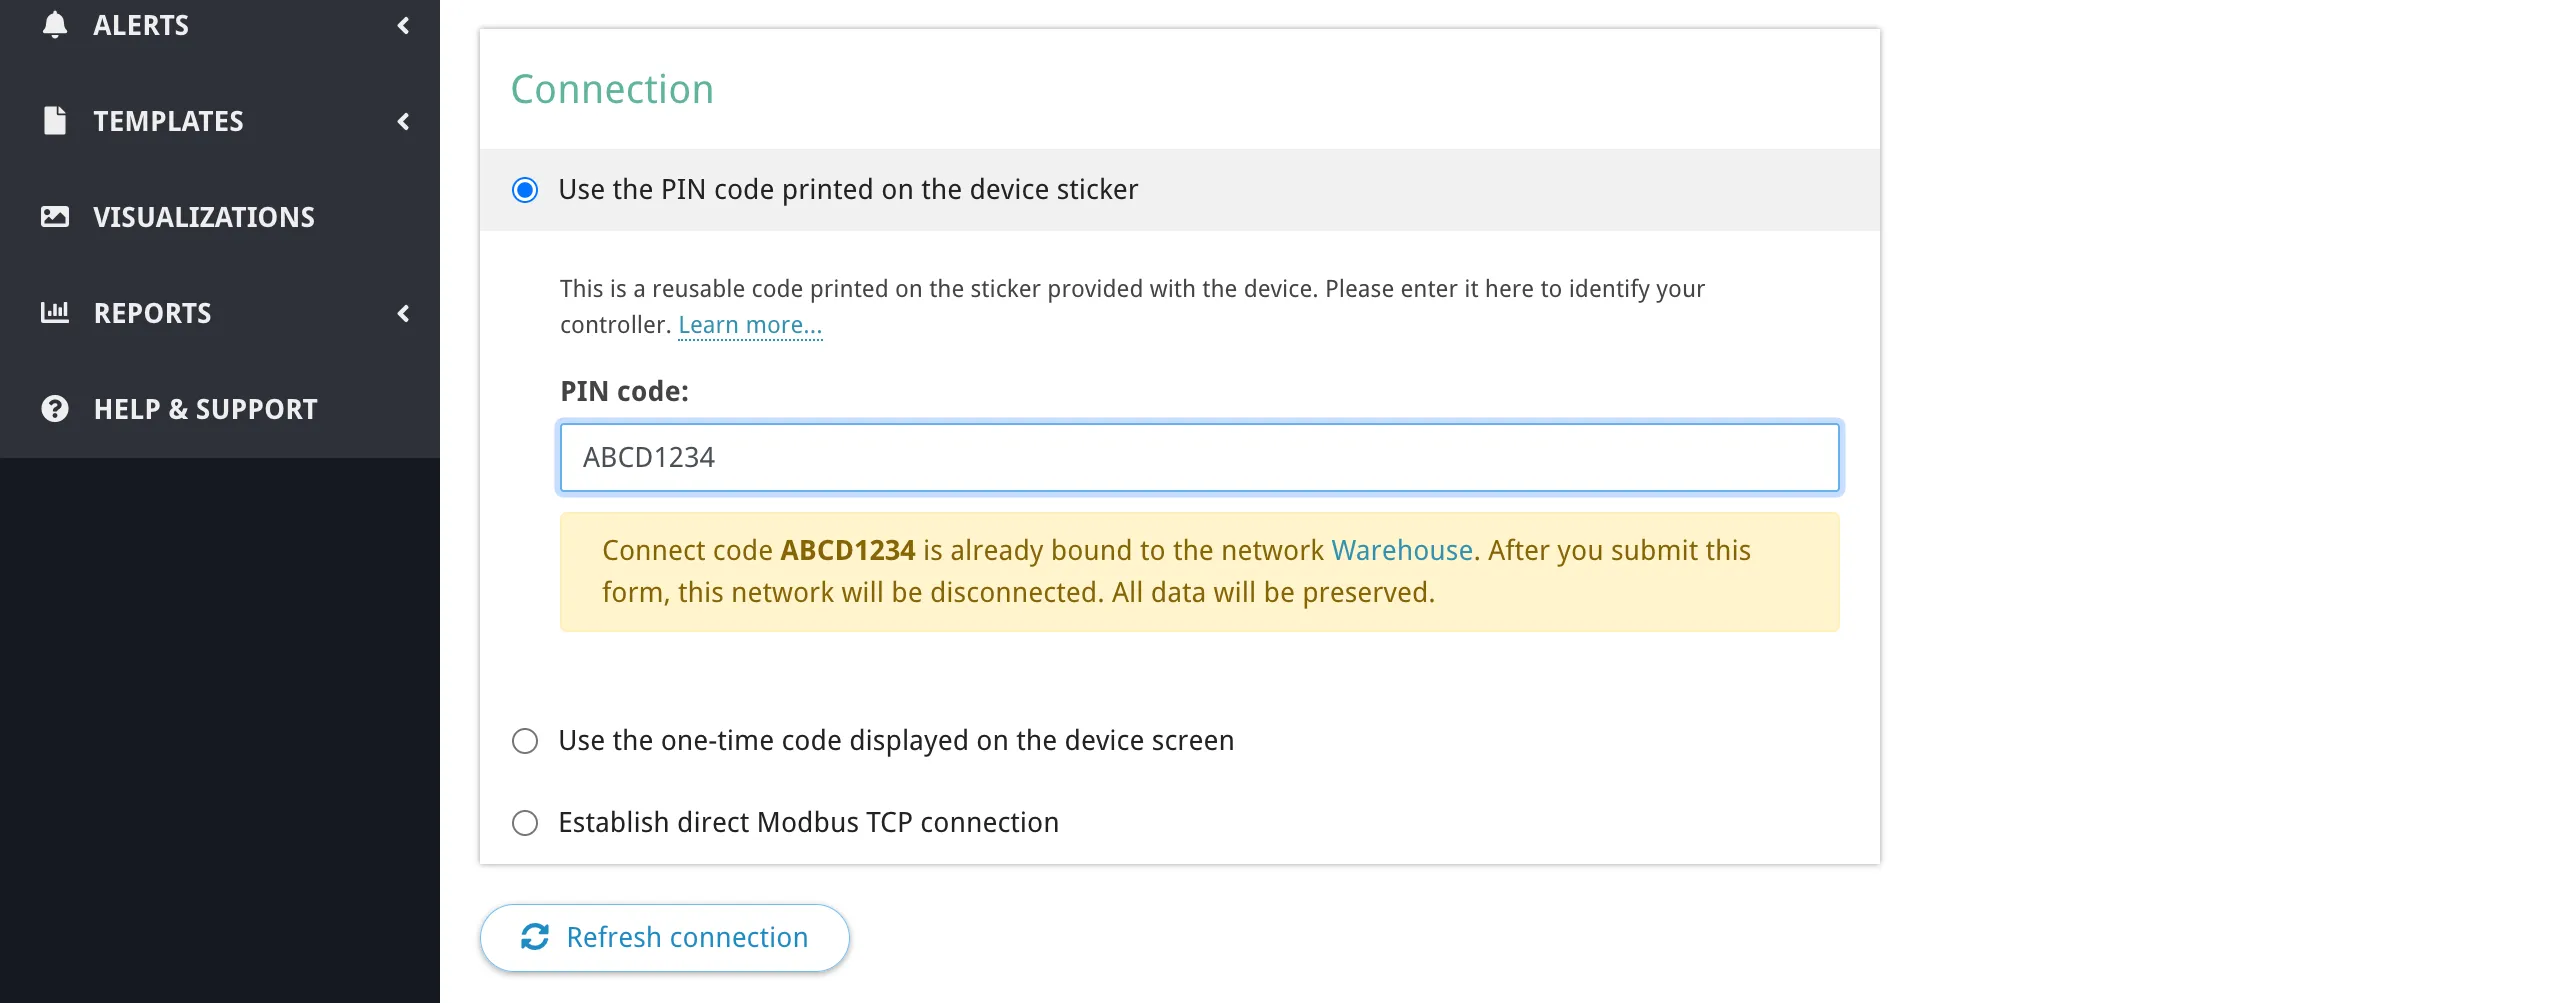
Both modes use the same register model and function codes — the difference is only in how bytes are encoded on the wire. Most Overvis-compatible controllers default to Modbus RTU. If your connected device requires Modbus ASCII, configure this in the controller’s serial port settings (web interface or via Modbus registers). Overvis itself communicates with the controller using Modbus TCP, which is mode-agnostic — the controller handles the RTU/ASCII translation on the RS-485 side. Devices in OvervisSection titled “Devices in Overvis”Each physical Modbus RTU device connected to the controller’s RS-485 port is represented as a device in Overvis, identified by its Modbus unit ID within the network. To add a device, open the network page in Overvis and click Add Device. Specify the device name, Modbus ID, and optionally select a device template to pre-configure all parameters. If no template is available, you can add parameters manually by specifying register addresses, data types, and names. Information about your device’s Modbus register map, supported function codes, and data types is typically found in the device’s documentation or datasheet, usually in a section titled “Modbus registers”, “Communication protocol”, or “Register map”. For full details on adding and configuring devices and parameters, see Networks, Devices & Parameters. Device Conflicts and TakeoverSection titled “Device Conflicts and Takeover”When you try to create a network using a controller that is already registered in Overvis, the behavior depends on which connection method you use and whether the controller belongs to your account or another account. PIN code: same accountSection titled “PIN code: same account”If the PIN code is already bound to a network in your account, Overvis shows a warning:
You can proceed — the old network will be disconnected and the controller will be bound to the new network. The old network and its data (device parameters, readings history) remain accessible. PIN code: another accountSection titled “PIN code: another account”If the controller is already bound to a network in another Overvis account, the PIN code cannot rebind it. The PIN code has lower priority — it proves that you have the sticker, but not necessarily physical access to the device. To take over the controller, use the activation code method instead. Activation code: takeoverSection titled “Activation code: takeover”The activation code has higher priority than the PIN code because it requires reading a code from the device’s display or web interface, which proves physical access. An activation code can take over a controller from any account — after binding, the device is removed from the previous owner’s network. Unbinding a controllerSection titled “Unbinding a controller”To unbind a controller from its current network (so it can be registered again, either by you or another user), use any of the following methods:
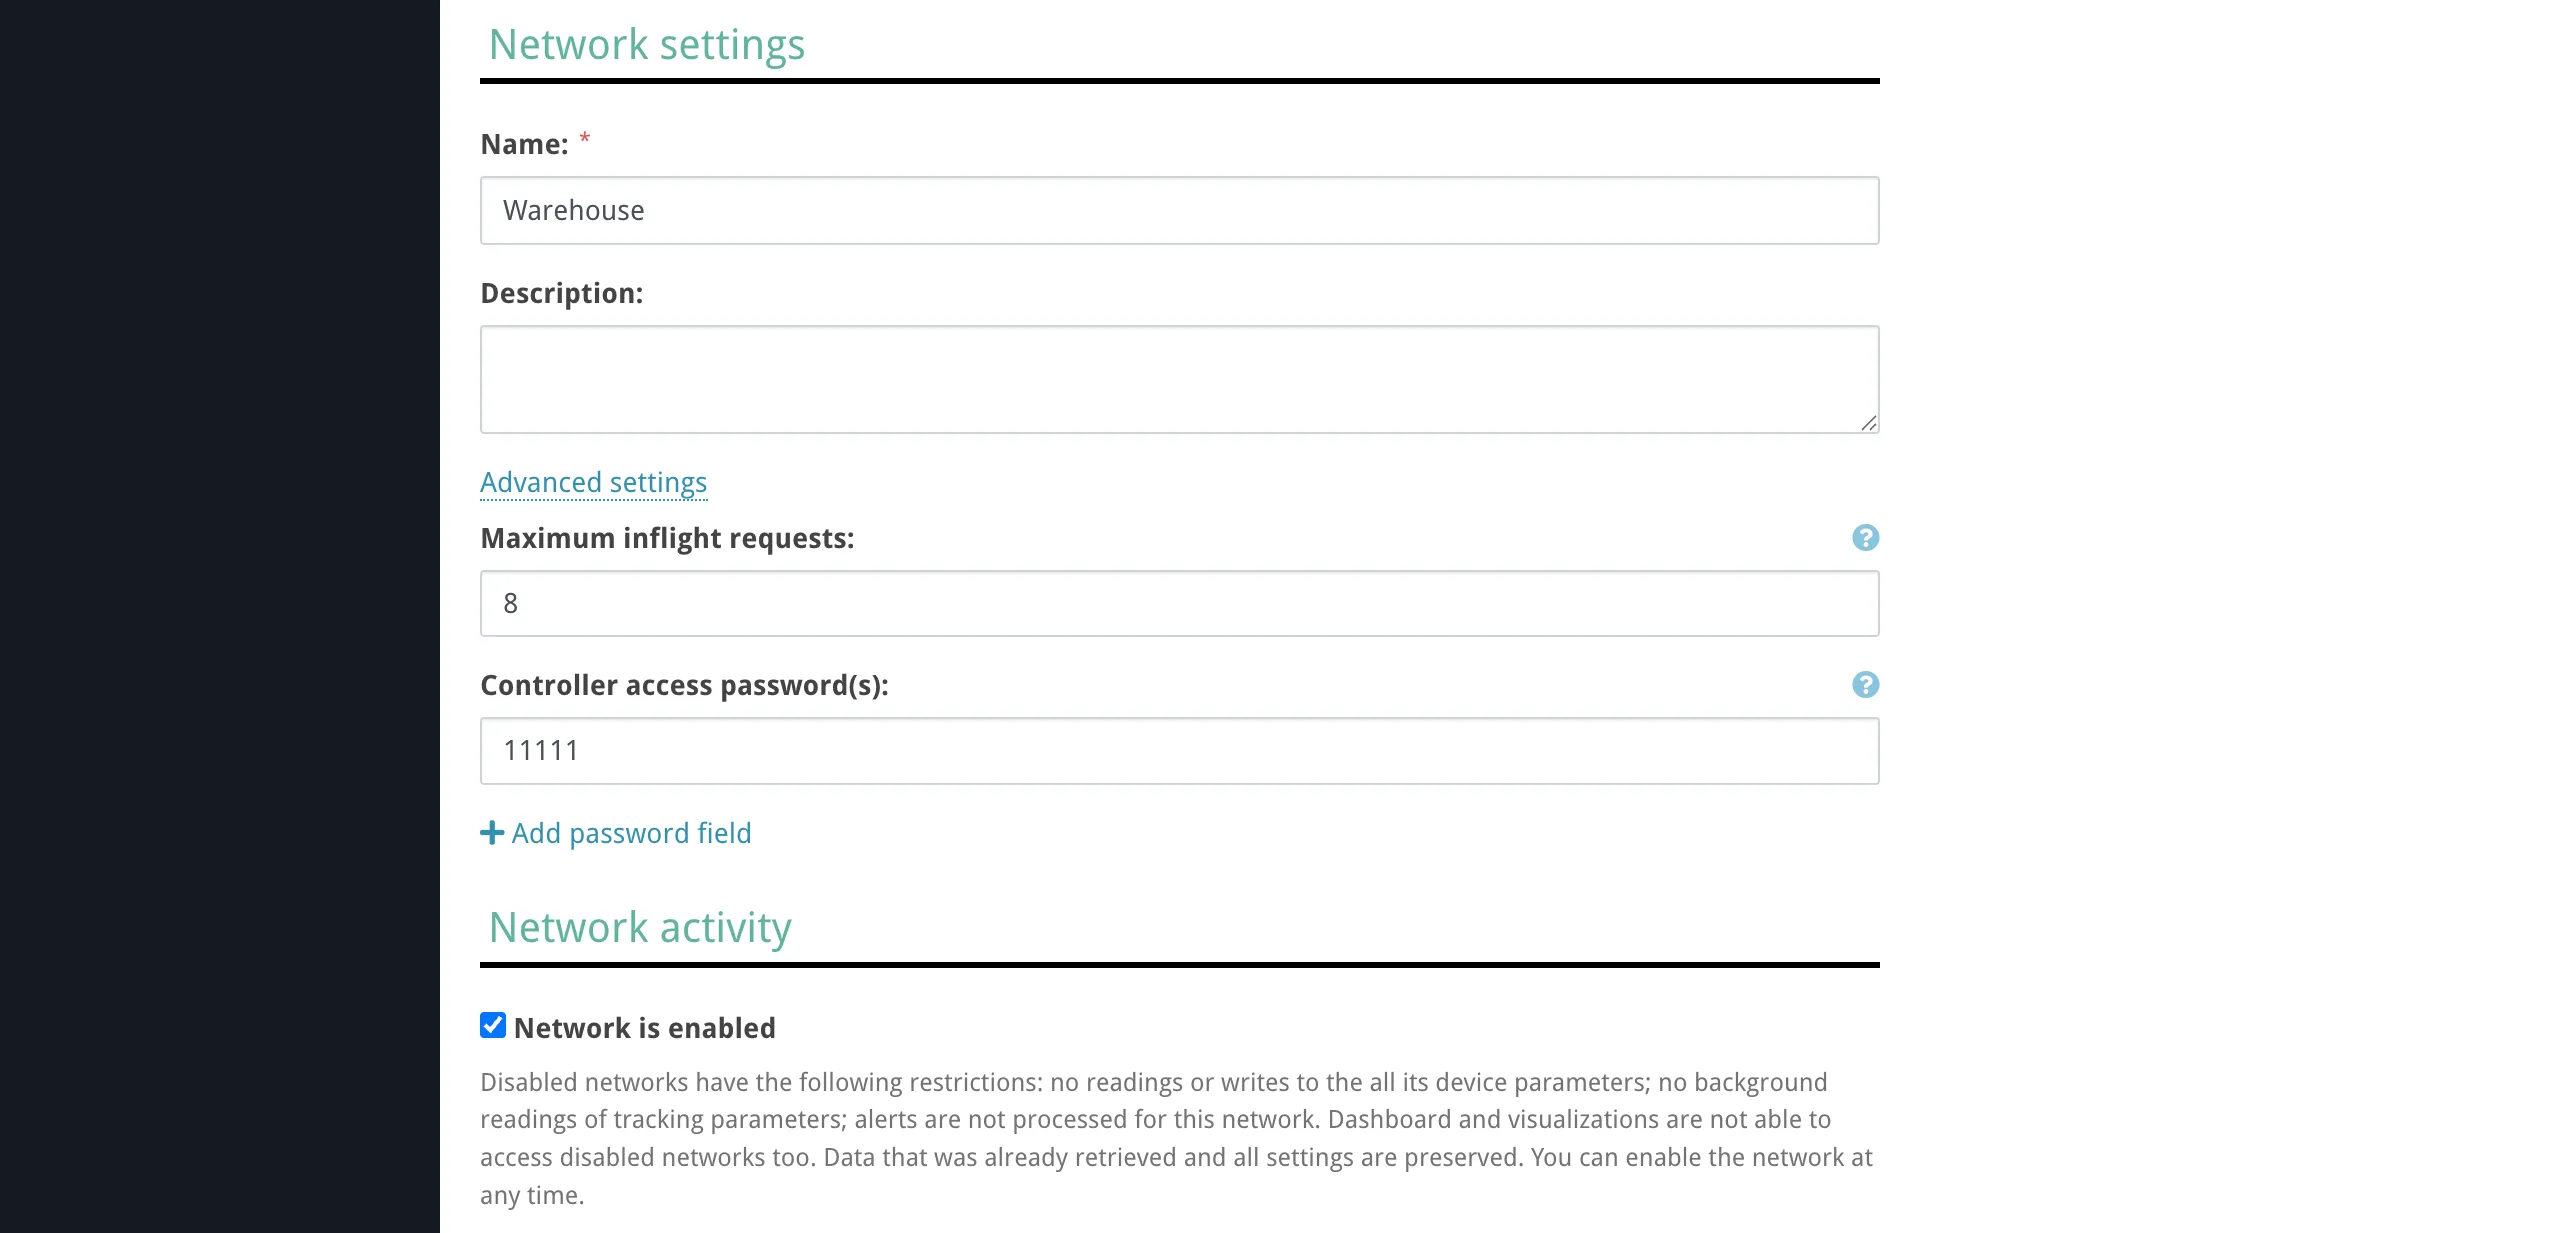
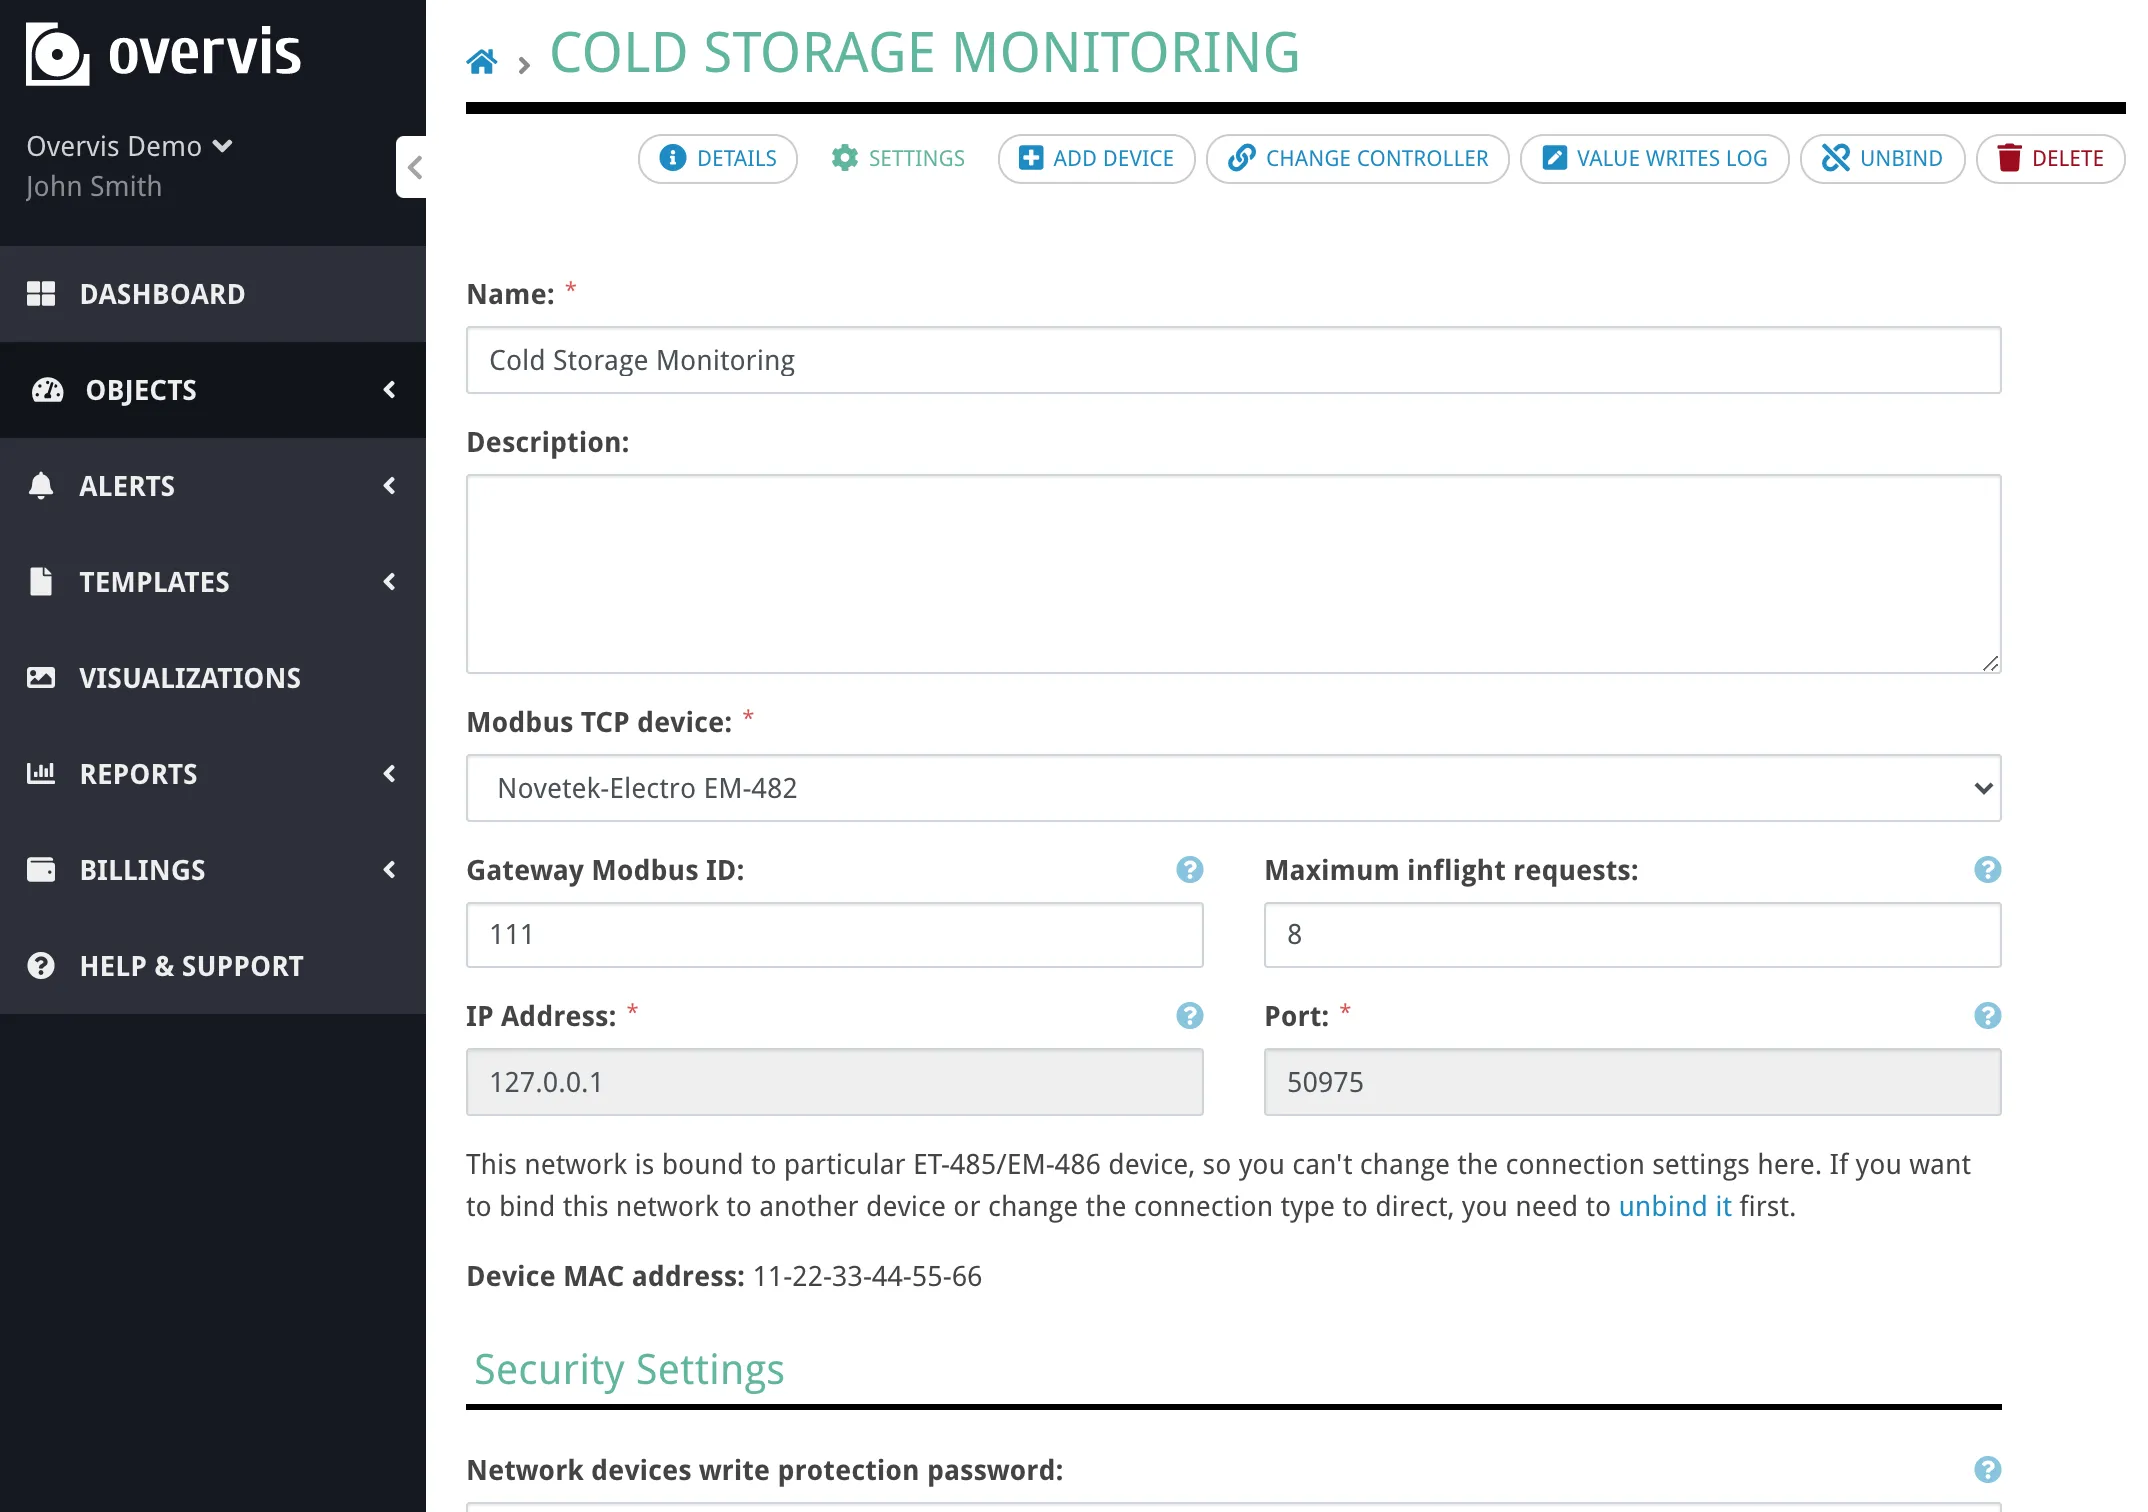
After unbinding, the controller re-connects to Overvis and receives a new activation code, ready for re-registration. Advanced Network SettingsSection titled “Advanced Network Settings”The network creation and settings page includes an Advanced settings section with options that affect how Overvis communicates with the controller.
Controller access passwordsSection titled “Controller access passwords”Some controllers support password-based access protection for reading and/or writing registers. If your controller has passwords configured, add them in the Controller access password(s) section. Overvis sends these passwords to the controller after connecting, exactly as entered. You can add multiple passwords — for example, separate read and write passwords. The controller determines which level of access each password grants. Maximum inflight requestsSection titled “Maximum inflight requests”Controls how many Modbus requests Overvis sends to this network simultaneously (in parallel). The default is 1 — Overvis waits for each response before sending the next request (sequential mode). Increasing this value allows Overvis to send multiple requests at once, which can speed up polling when the controller supports it. However, many RS-485 controllers process requests sequentially on the serial bus regardless, so setting a high value may not improve performance and can cause timeouts if the controller’s request queue overflows. Use the default value of 1 unless you know your controller supports parallel request processing. Network enabled/disabledSection titled “Network enabled/disabled”Networks can be disabled to pause all communication without deleting the network or losing data. A disabled network stops all readings, writes, background tracking, and alert processing. Dashboard and visualizations cannot access disabled networks. All existing data and settings are preserved, and the network can be re-enabled at any time. For more details on network management, see Networks, Devices & Parameters. Connection StatusSection titled “Connection Status”After creating a network, the network page shows the live connection status of the gateway controller. The status indicator shows one of the following states:
TroubleshootingSection titled “Troubleshooting”Connection problems fall into three tiers. Start at the top and work down — each tier builds on the previous one being resolved. graph TD
A["Data access issue"] --> B{"Is the gateway<br/>online in Overvis?"}
B -->|No| C["Tier 1:<br/>Gateway not reachable"]
B -->|Yes| D{"Does the device<br/>respond to reads?"}
D -->|No| E["Tier 2:<br/>Device not reachable"]
D -->|Yes| F{"Is the data<br/>correct?"}
F -->|No| G["Tier 3:<br/>Data is wrong"]
F -->|Yes| H["Out of scope <br/>of this guide"]
Tier 1: Gateway Not ReachableSection titled “Tier 1: Gateway Not Reachable”Symptom: The network shows as offline in Overvis. No data is being read from any device. The connection status shows “The device has not established a connection to the server” (reverse connections) or “Server can’t establish the connection (timeout)” (direct connections). This means Overvis cannot communicate with the communication controller. For reverse connections, it means the controller has not established or has lost its outbound connection to Overvis. For direct connections, it means Overvis cannot reach the controller’s IP and port. Reverse connections (PIN / activation code)Section titled “Reverse connections (PIN / activation code)”1. Power and basic indicators Verify the controller is powered on and running. Check the power indicator:
If the MC252 2. Network connection (Ethernet / Wi-Fi) The controller must have a working link to the local network before it can reach Overvis.
3. Internet access and Overvis server connection Even with a local network link, the controller must be able to reach the Overvis server over the internet.
4. Firewall and port requirements The controller initiates an outbound TCP connection to the Overvis server on port 20502. Corporate networks and firewalls may block this. Ask your network administrator to allow outbound TCP traffic to 5. DNS resolution The controller needs to resolve the Overvis server hostname. If DNS is not working on the local network, configure a public DNS server (e.g. 6. GSM/LTE connection (MC252) For controllers using cellular connectivity:
7. Cloud connection not enabled on the controller Some controllers ship with the cloud connection disabled by default:
Direct connectionsSection titled “Direct connections”
Tier 2: Device Not Reachable Through GatewaySection titled “Tier 2: Device Not Reachable Through Gateway”Symptom: The network is online (gateway is connected), but one or more devices show read errors, timeouts, or “no response” for all parameters. The controller can talk to Overvis, but cannot communicate with the end device on the RS-485 bus. 1. Verify Modbus address Check that the device’s Modbus address (unit ID) in Overvis matches the address configured on the physical device. The address is typically set via DIP switches, front panel, or device configuration software. Common default addresses vary by manufacturer — check the device manual. 2. Check RS-485 wiring polarity Swap the A and B wires at the controller or at the device. Reversed polarity is the single most common RS-485 problem and does not cause equipment damage. Different manufacturers label terminals inconsistently — what one calls “A” another may call “B”. Look for 3. Match serial communication settings All devices on the RS-485 bus must share identical serial settings. A mismatch in any parameter causes complete silence (no responses at all) or CRC errors:
For Overvis-compatible controllers, these settings can be changed through:
4. Use the MC252 device search tool The MC252 web interface has a built-in Search Devices tool (Modbus tab → Search Devices button) that scans all Modbus addresses and optionally tries different baud rates, parity, and protocol settings. This can identify connected devices and their actual configuration. A thorough search takes 30–60 minutes; use the Fast search option if you know all devices use the same settings. 5. Use the MC252 Send Request tool The MC252 web interface has a Send Request tool (Modbus tab → Send Request button) that sends a single Modbus request and shows the raw response. Use it to test communication with a specific device address and verify the response. An exception code in the response does not necessarily indicate a device problem — it may just mean the device doesn’t have the requested register. 6. Check cable and bus topology
7. Verify device power and state Make sure the device is powered on and in normal operating mode (not in a configuration, firmware update, or error state). Some devices disable Modbus communication during certain modes. 8. Check for bus conflicts
9. Electrical noise RS-485 communication can be disrupted by nearby variable-frequency drives (VFDs), motors, high-voltage switching, or welding equipment. Route RS-485 cables away from power lines and use shielded twisted-pair cable. Connect the cable shield to ground at one end of the bus. Tier 3: Device Reachable but Data Is WrongSection titled “Tier 3: Device Reachable but Data Is Wrong”Symptom: The device responds, but the values shown in Overvis are incorrect — wrong numbers, always zero, negative values when positive are expected, etc. The communication path works, but the parameter configuration does not match the device’s register map. 1. Register address offset Modbus register addressing conventions vary between manufacturers. Some device manuals document addresses starting from 0, others from 1, and some from 40001 (the Modicon convention, where 40001 = holding register 0). If your value is off by one register or consistently shifted, try adjusting the register address by ±1. 2. Register type mismatch Modbus defines four register types. Using the wrong type reads from a different address space:
Verify the parameter in Overvis uses the same register type as specified in the device documentation. 3. Data type and byte order A temperature reading stored as a 32-bit float will appear as garbage if read as two independent 16-bit integers. Common data types:
For multi-register values, check both byte order (big-endian vs little-endian) and word order (AB CD vs CD AB). The MC252 Send Request tool in the web interface can help identify the correct interpretation by showing raw register values. 4. Scaling factor Many devices store values with an implicit decimal point. For example, a temperature of 23.5°C may be stored as the integer 235 (×10) or 2350 (×100). The EM-130, for instance, represents all decimal values as integers with a conversion factor determined by the number of decimal places (1 decimal place = ×10, 2 = ×100, 3 = ×1000). Check the device documentation for the scaling factor. 5. Consult the device documentation The device’s Modbus register map is the authoritative source for addresses, types, and scaling. It is usually found in the device manual, a separate “communication protocol” document, or on the manufacturer’s website. For Overvis-compatible devices, the register maps are available in the device documentation: Common Overvis Error MessagesSection titled “Common Overvis Error Messages”When creating a network or checking the connection, Overvis may display these error messages:
Controller-Specific IndicatorsSection titled “Controller-Specific Indicators”Use the controller’s LEDs and display to diagnose the connection state without accessing Overvis.
EM-482Section titled “EM-482”
EM-483Section titled “EM-483”
The EM-483 web interface status page shows the server connection state: the activation code (waiting for binding), “Active” (bound to Overvis), or “No Code” (registered via QR/PIN sticker). EM-130Section titled “EM-130”The EM-130 has a single |
| | ||||||||||||||||||||||||||||||||||||||||||||||||||||||||||||||||||||||||||||||||||||||||||||||||||||||||||||||||||||||||||||||||||||||||||||||||||||||||||||||||||||||||||||
|---|---|---|---|---|---|---|---|---|---|---|---|---|---|---|---|---|---|---|---|---|---|---|---|---|---|---|---|---|---|---|---|---|---|---|---|---|---|---|---|---|---|---|---|---|---|---|---|---|---|---|---|---|---|---|---|---|---|---|---|---|---|---|---|---|---|---|---|---|---|---|---|---|---|---|---|---|---|---|---|---|---|---|---|---|---|---|---|---|---|---|---|---|---|---|---|---|---|---|---|---|---|---|---|---|---|---|---|---|---|---|---|---|---|---|---|---|---|---|---|---|---|---|---|---|---|---|---|---|---|---|---|---|---|---|---|---|---|---|---|---|---|---|---|---|---|---|---|---|---|---|---|---|---|---|---|---|---|---|---|---|---|---|---|---|---|---|---|---|---|---|---|---|
Networks, Devices & ParametersOvervis organizes field data in a three-level hierarchy:
This page is the reference for all three levels — what they store, how they relate to each other, and how their settings affect communication and data handling. It follows the same order as the hierarchy: networks, then devices, then parameters. For a hands-on walkthrough, see Getting Started. For connection methods and troubleshooting, see Connecting Equipment. Hierarchy and RelationshipsSection titled “Hierarchy and Relationships”OwnershipSection titled “Ownership”
IdentifiersSection titled “Identifiers”Every network, device, and parameter has two identifiers:
DeletionSection titled “Deletion”Deleting a parent deletes all its children:
Stored readings and event history associated with deleted parameters are also removed. DisablingSection titled “Disabling”Networks and devices can be disabled without deleting them. Disabling preserves all configuration and stored data but stops communication:
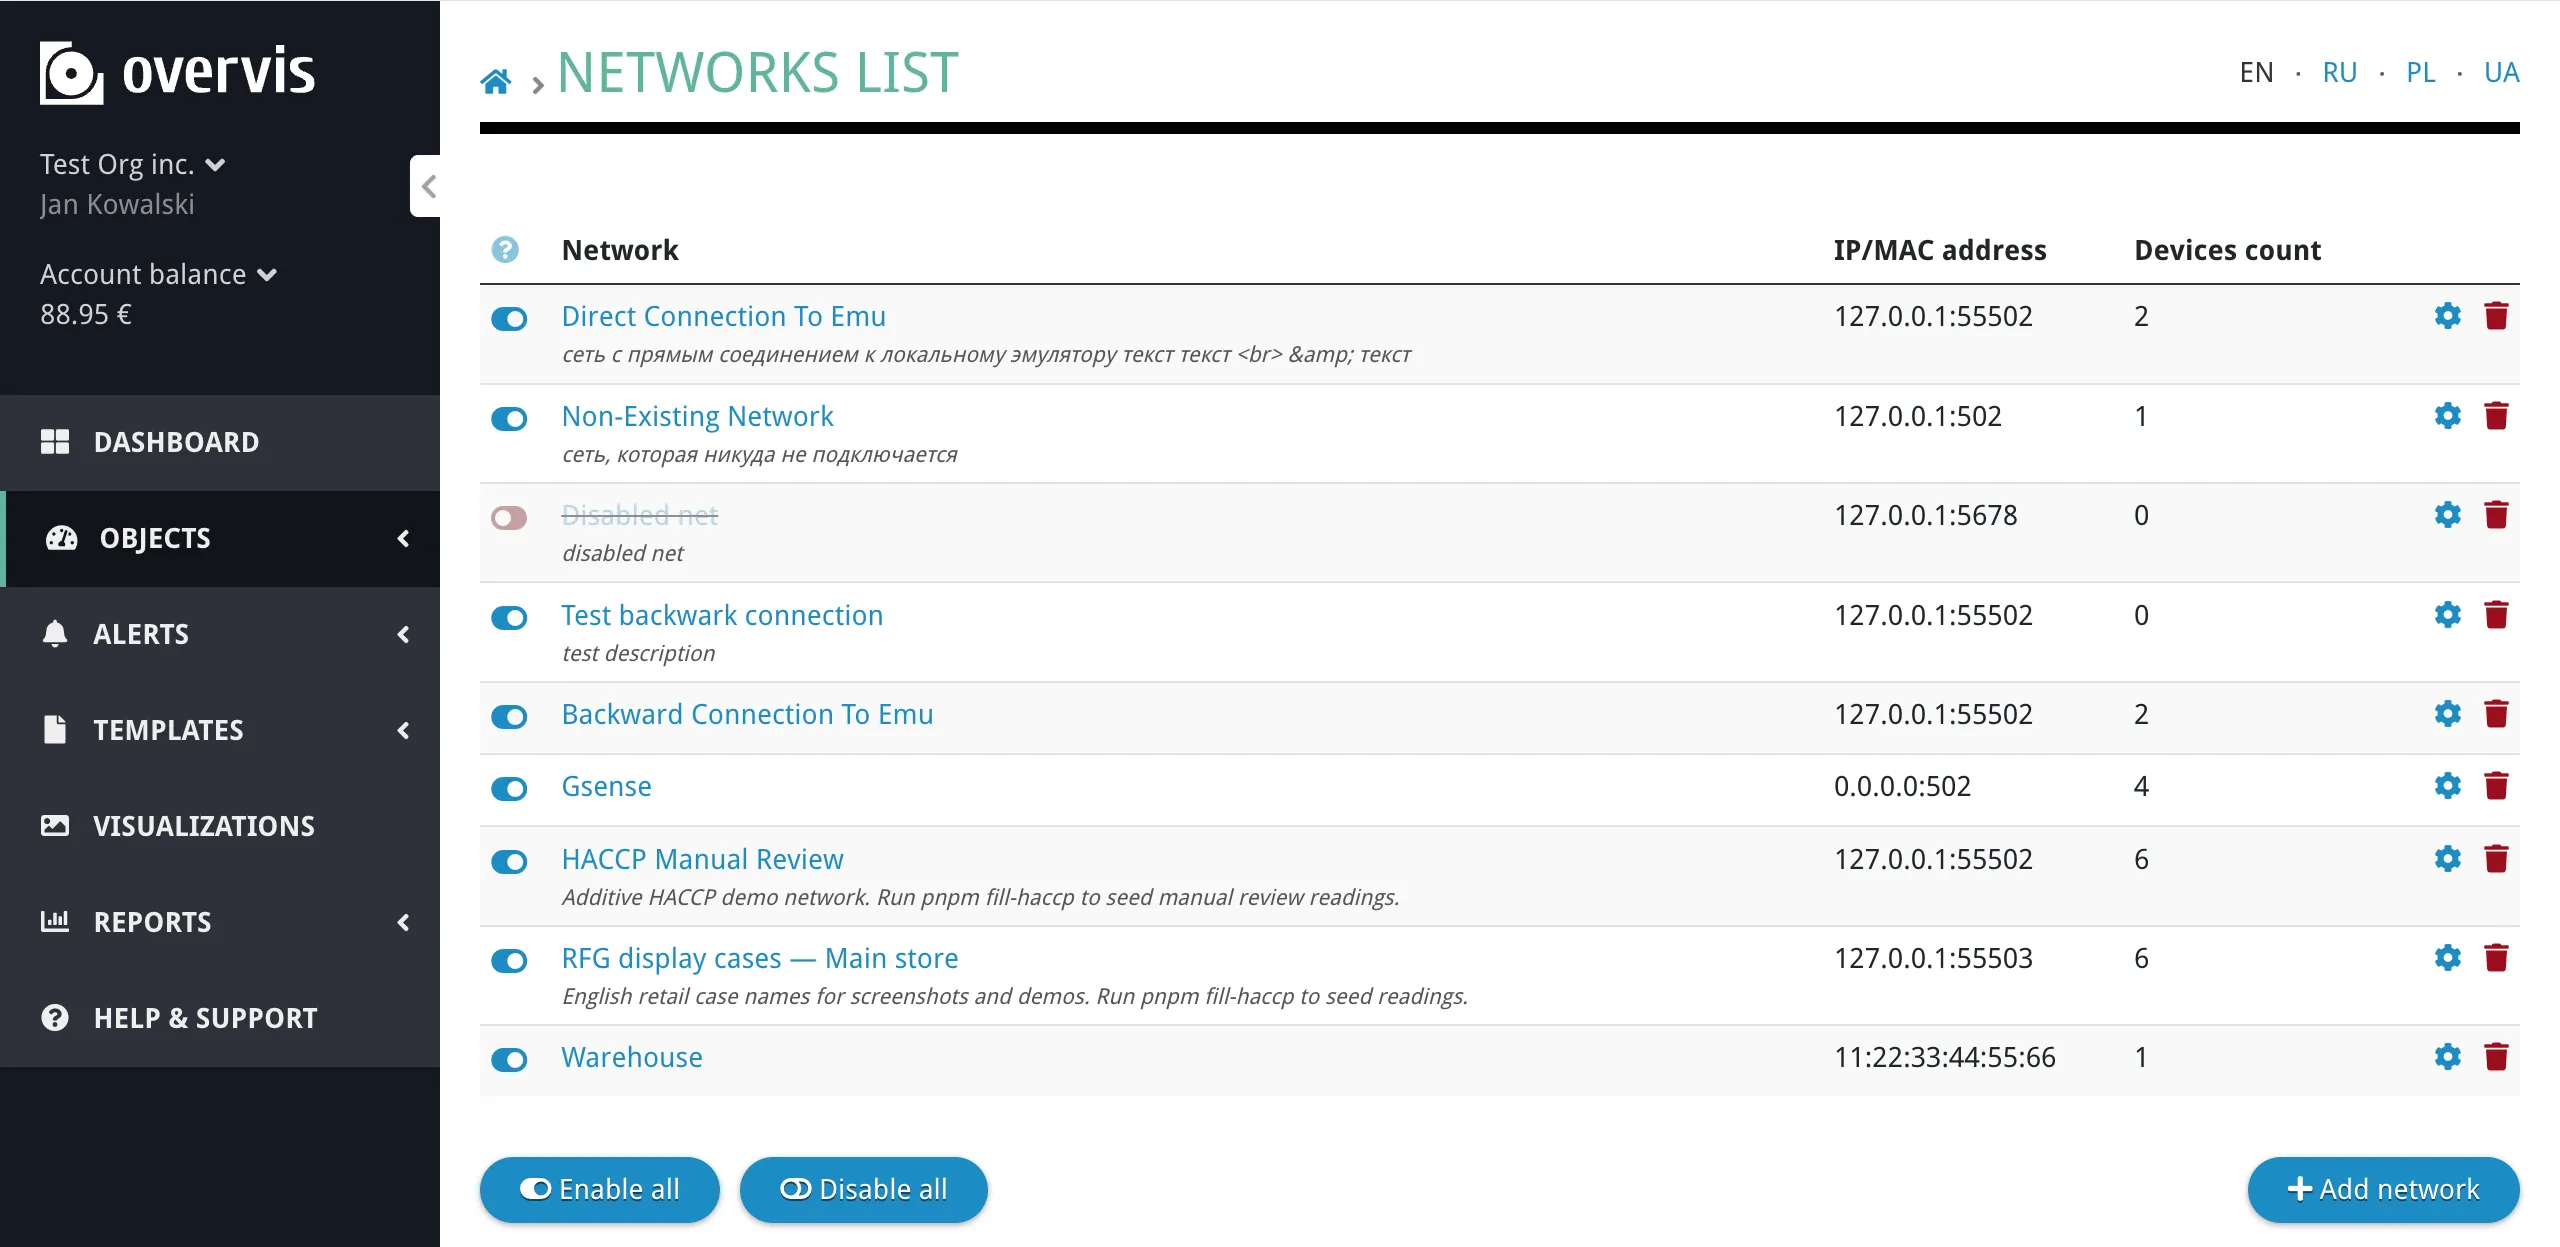
Networks and devices can be disabled by a user, by the billing system (when the organization’s balance runs out), or by a platform administrator. The disable timestamp and actor are recorded so the reason is always visible. Re-enabling restores normal operation immediately — no reconfiguration is needed. There is no separate enabled / disabled switch for individual parameters. Tracked and programmable control polling, history, and writes (see Behavior flags); a parameter with both flags off can still be read on demand. To stop all Modbus traffic for a device — including on-demand reads — disable the device or network. NetworksSection titled “Networks”A network represents one communication controller or gateway. Every device in the network is reached through that single connection. Creating a NetworkSection titled “Creating a Network”To create a network, go to the organization’s network list and click Add network. The create form guides you through selecting a connection method and entering connection details. For a step-by-step walkthrough of each connection method, see Connecting Equipment.
Network SettingsSection titled “Network Settings”
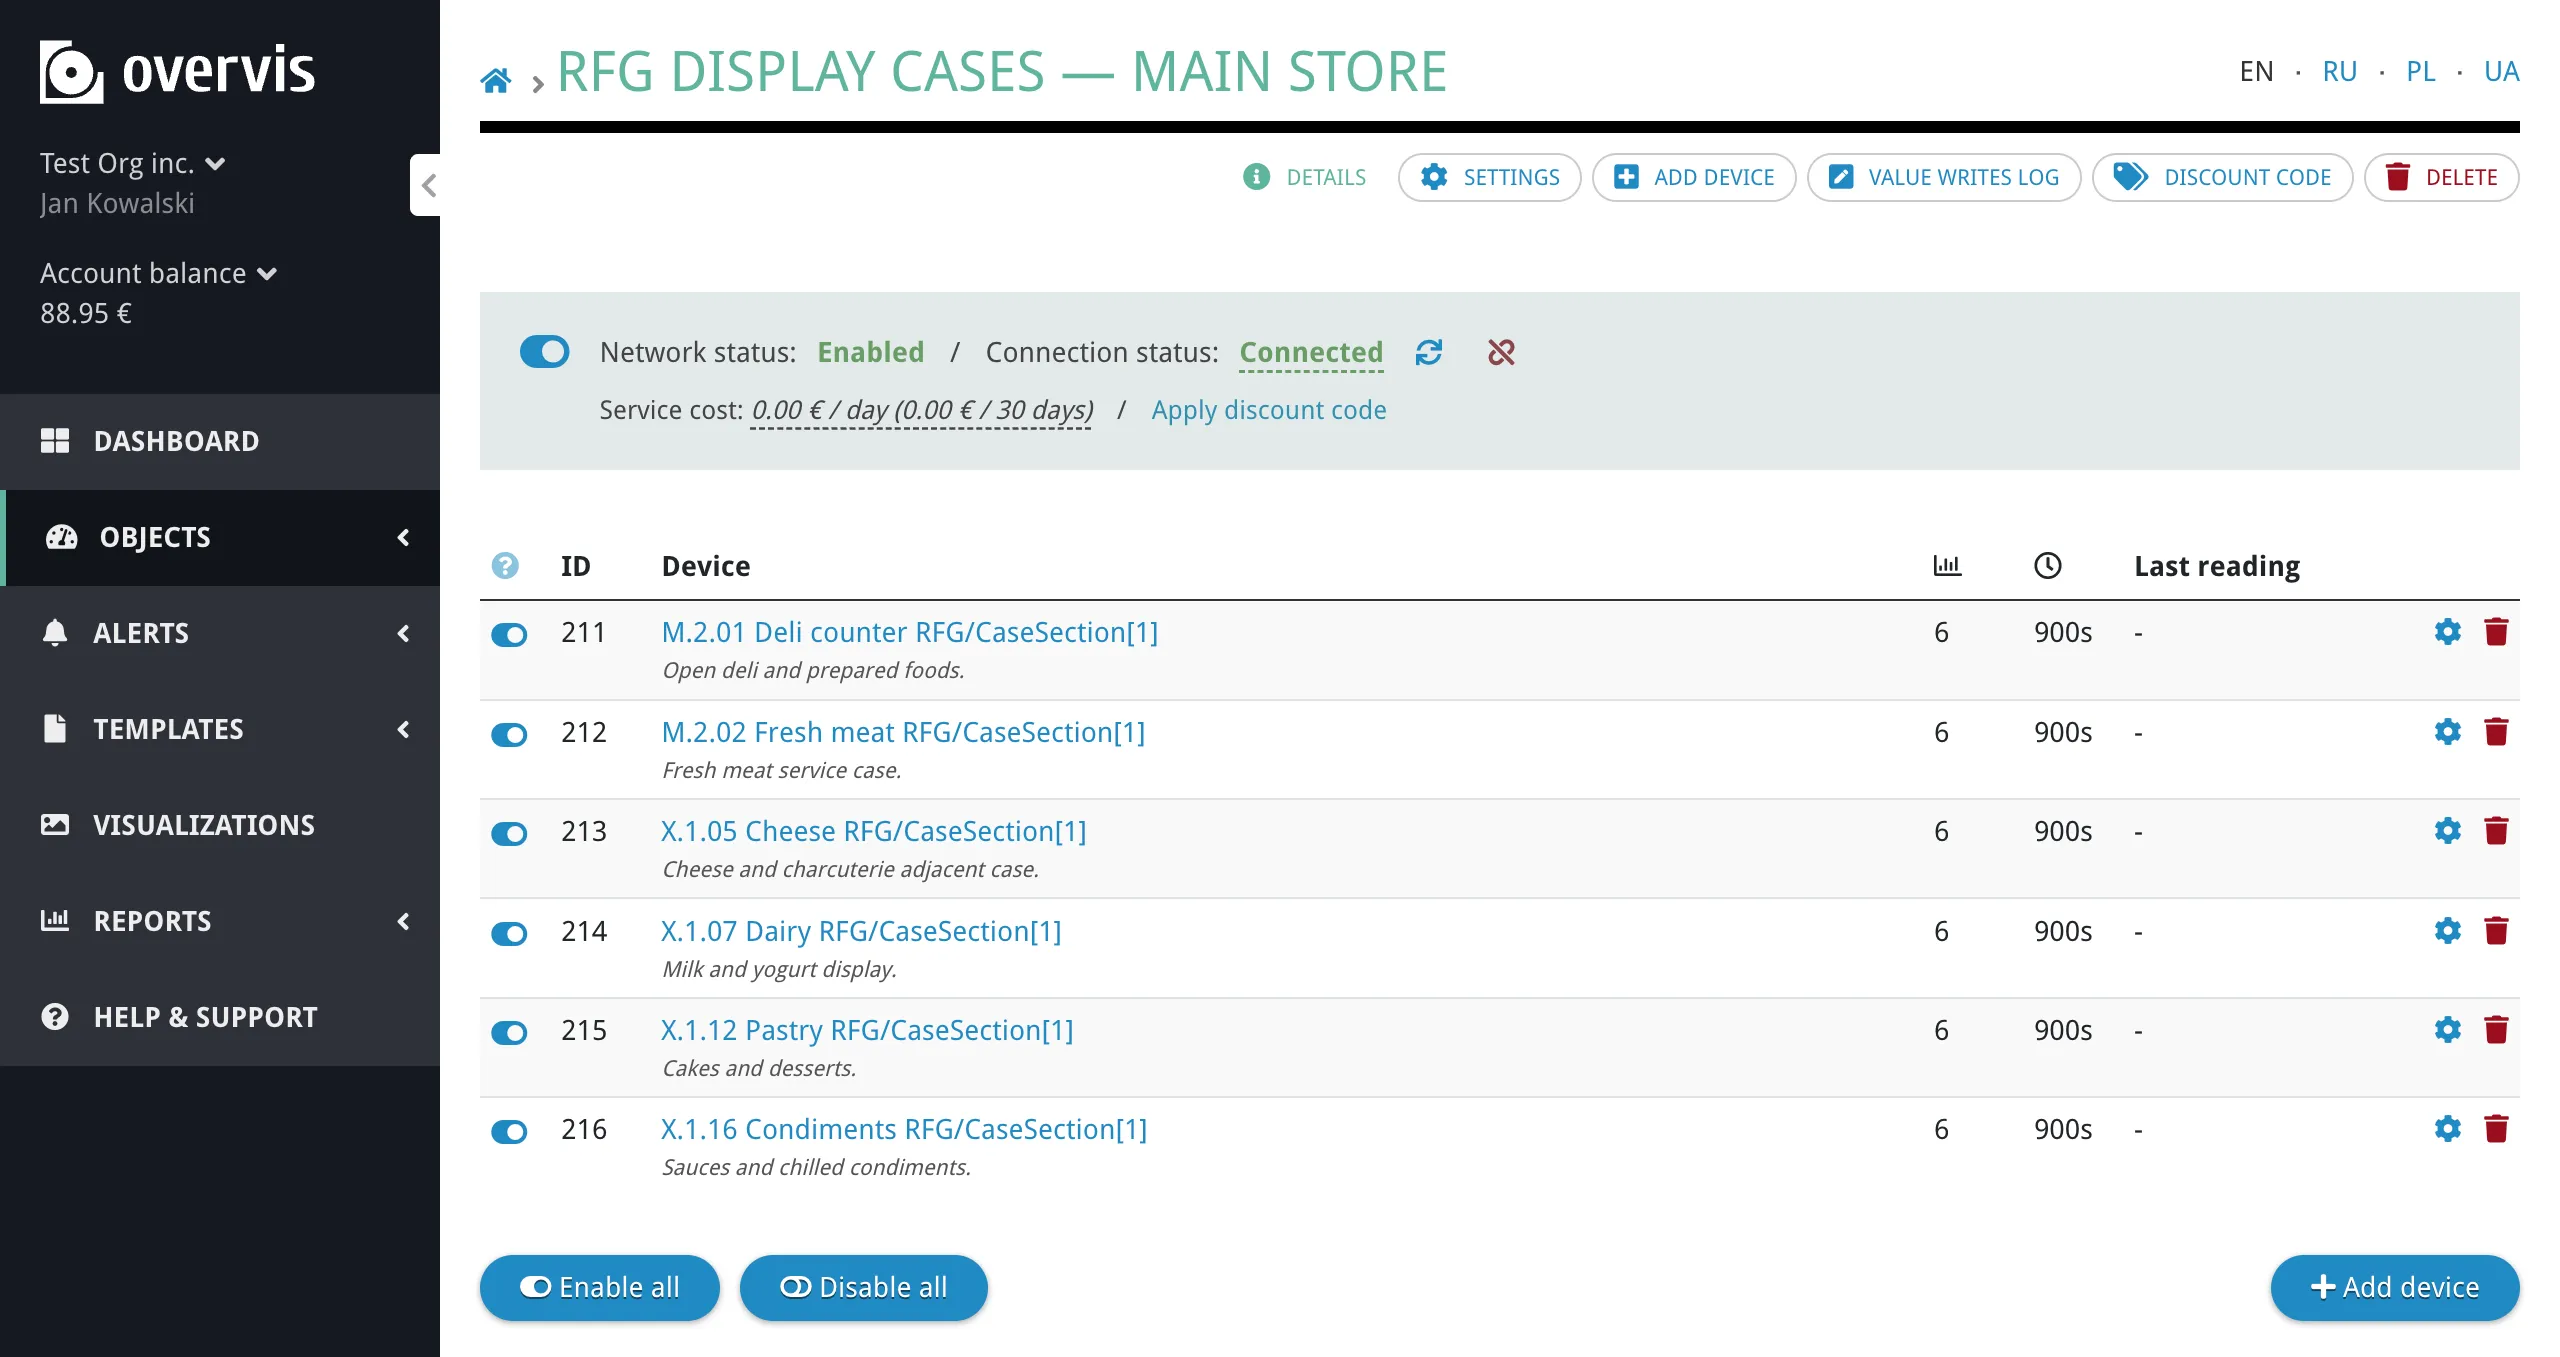
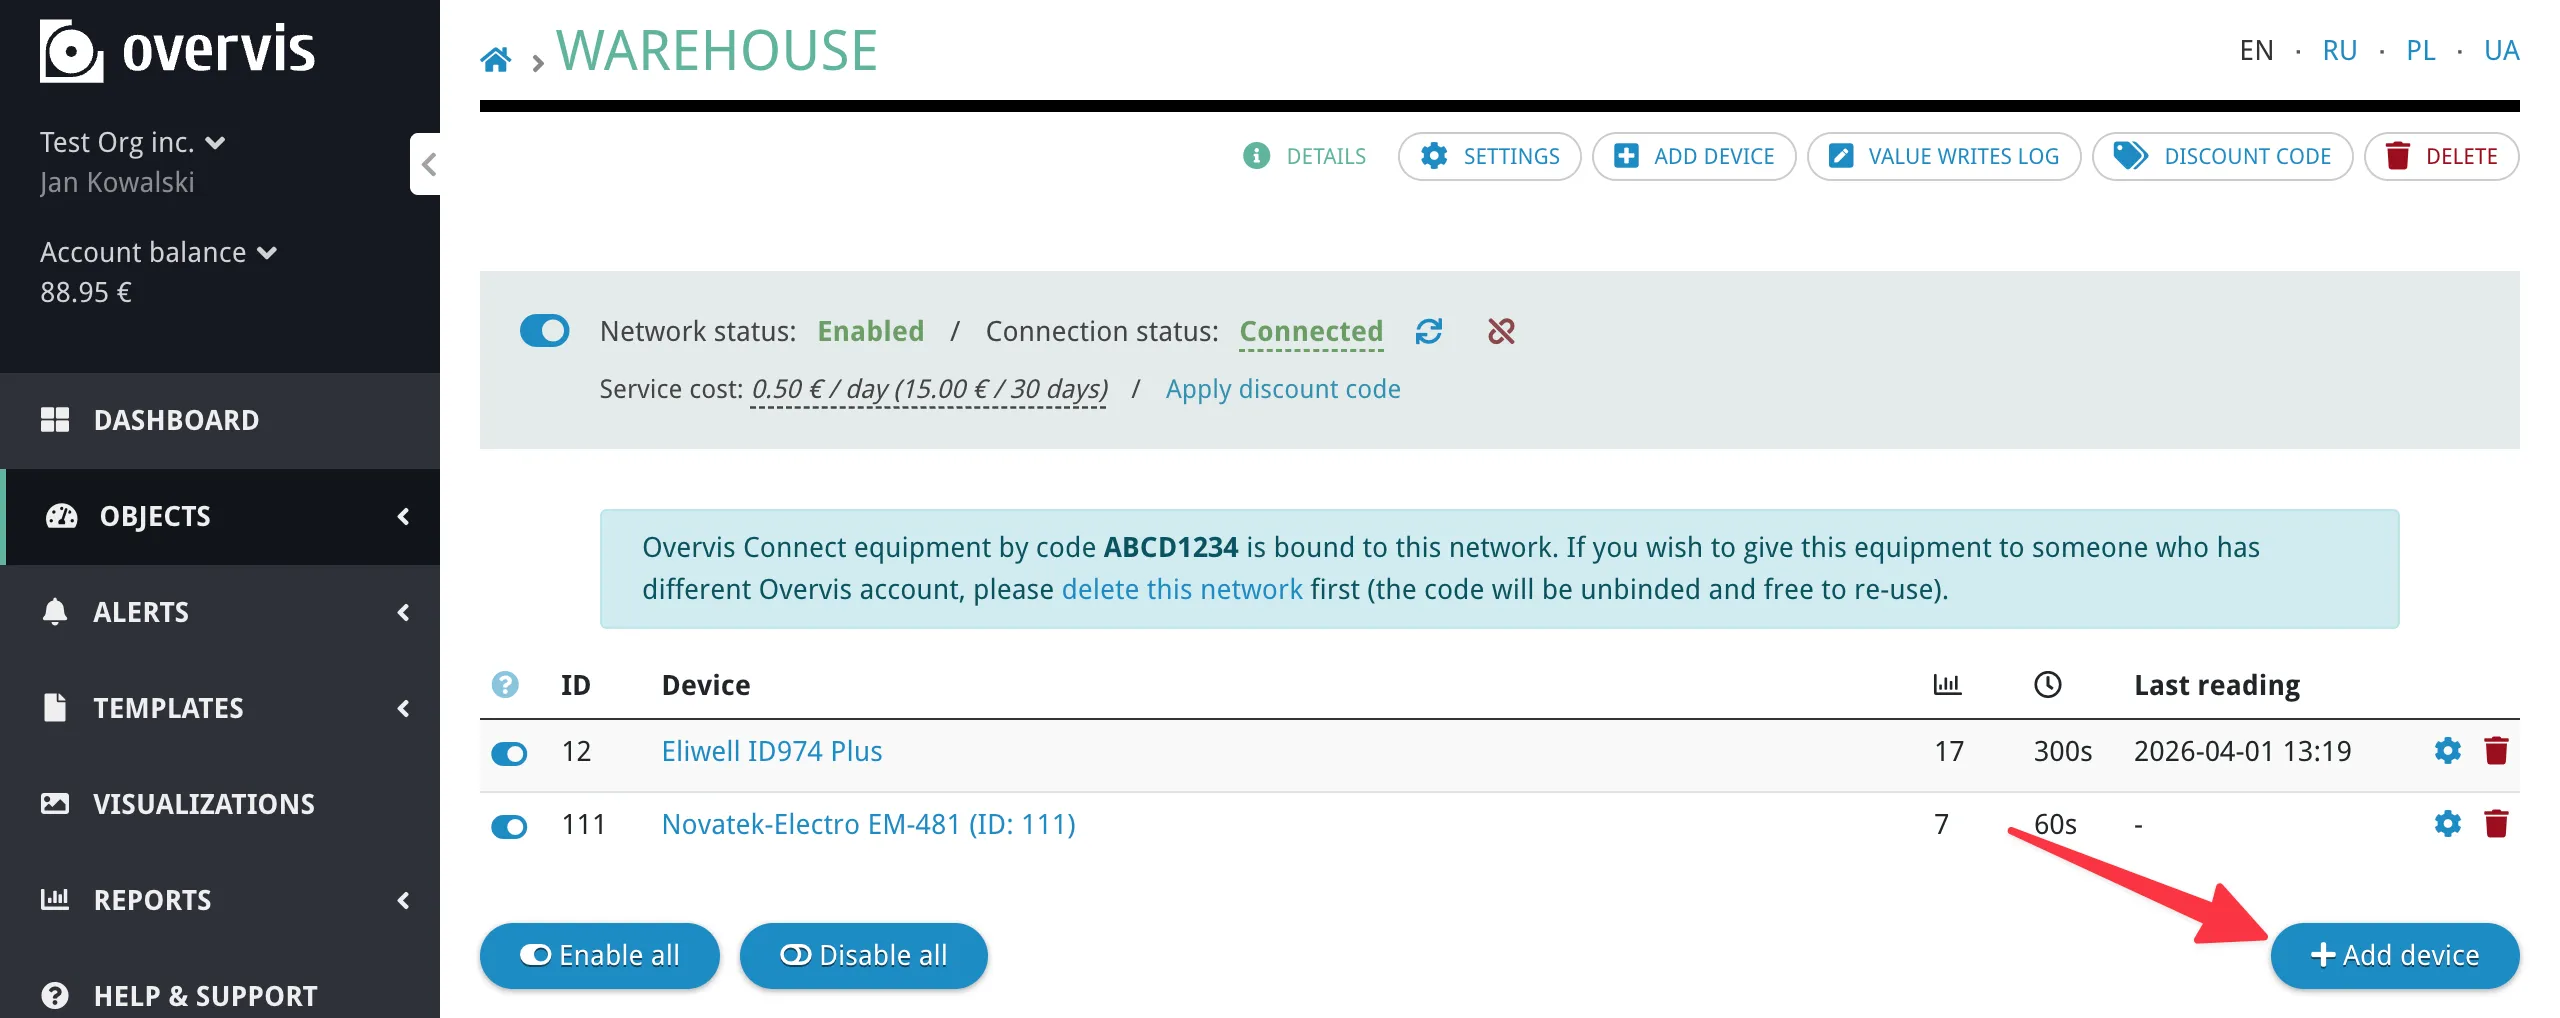
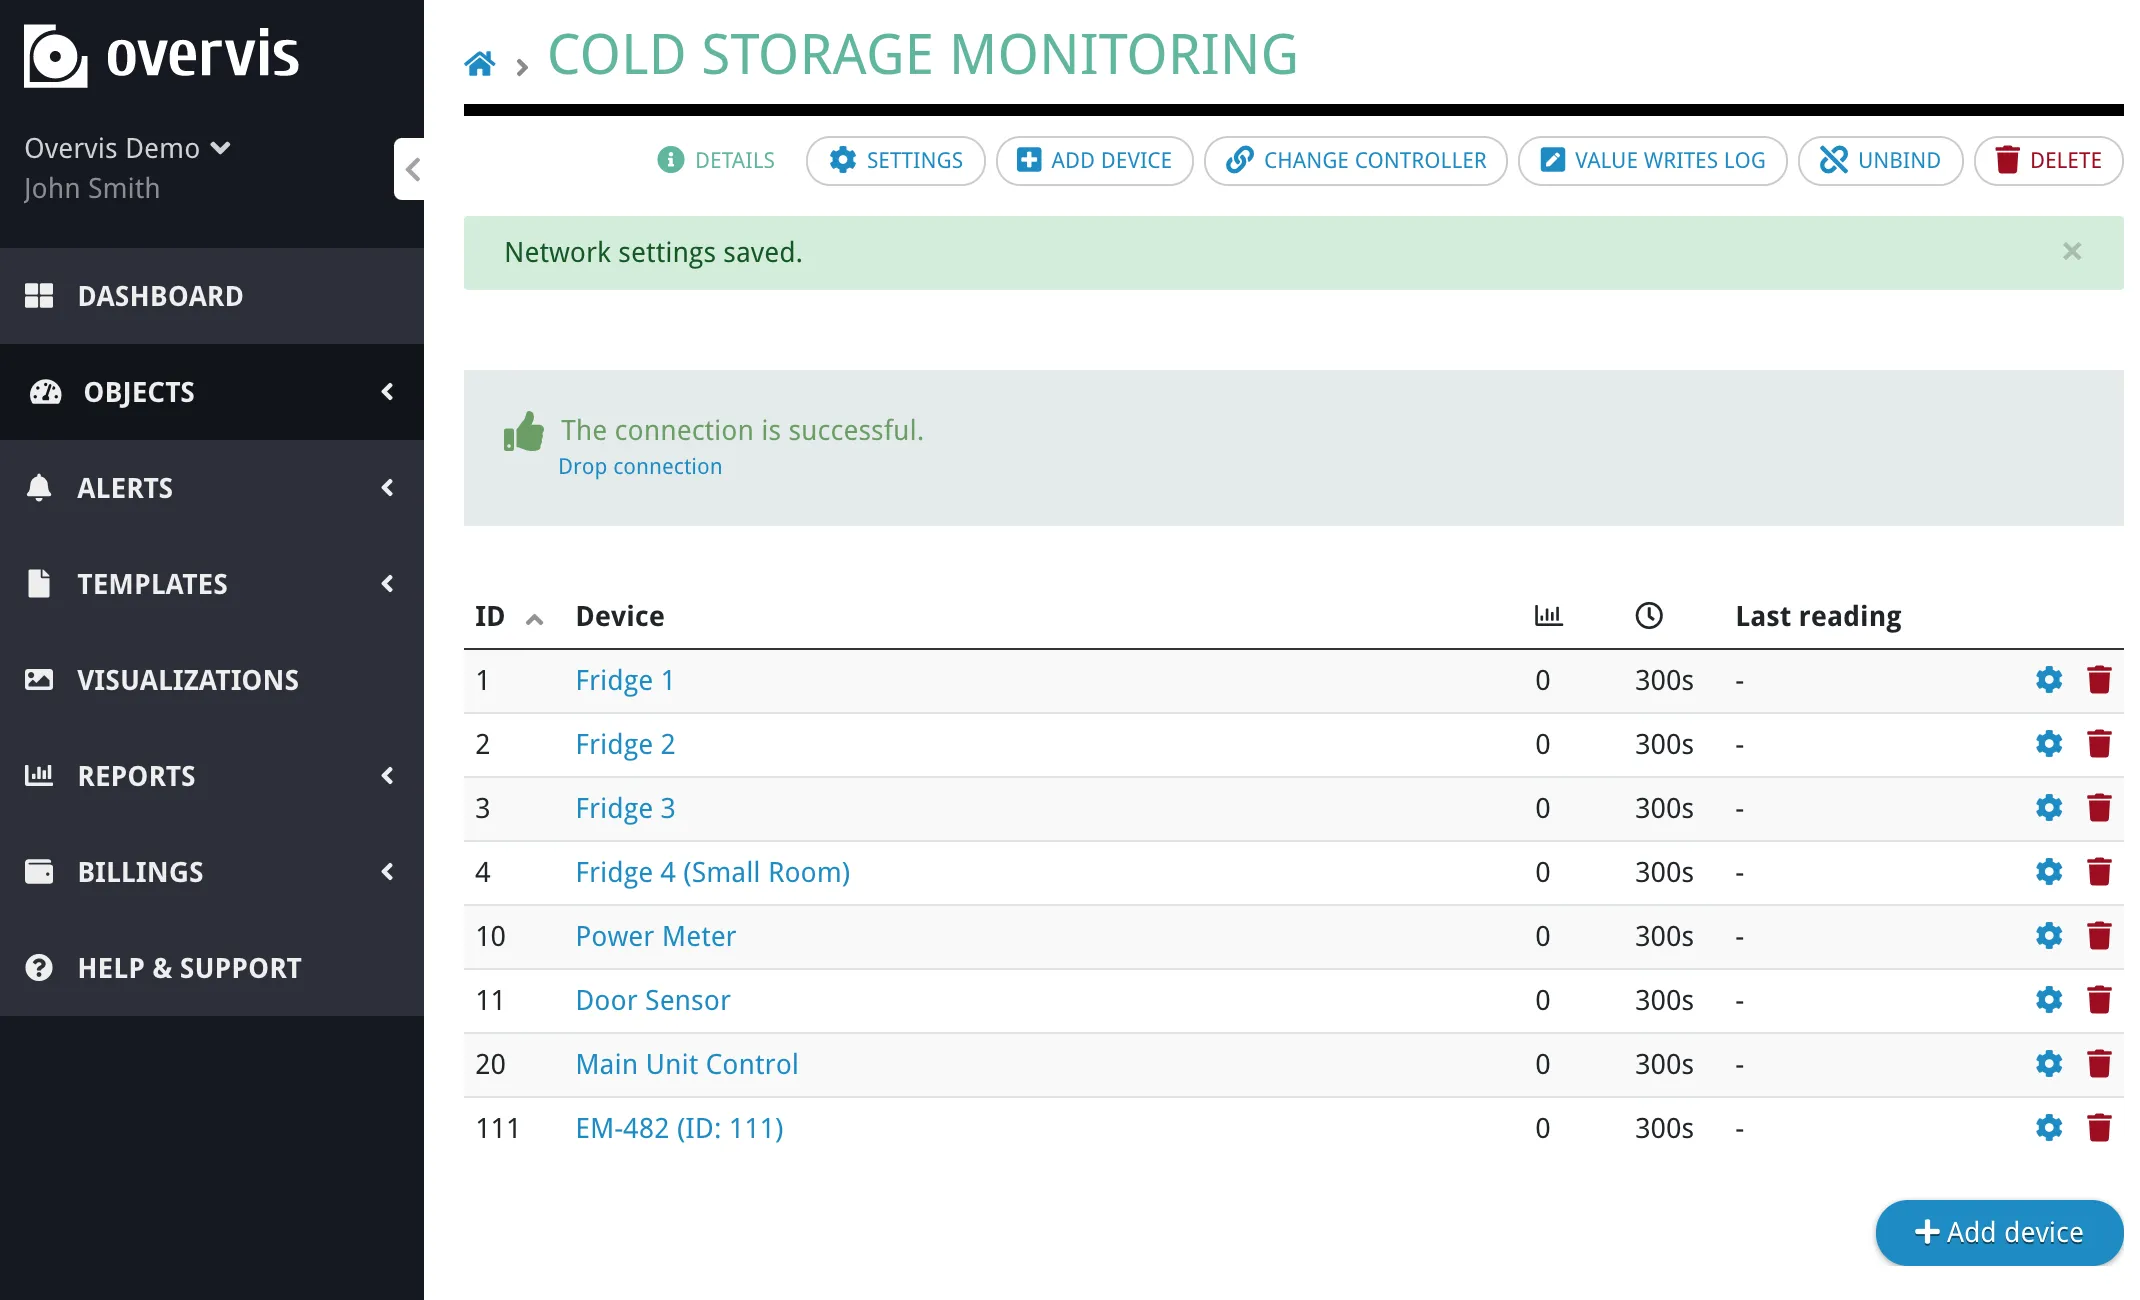
Network settings do not include the Modbus addresses of devices behind the controller, parameter register addresses, or data interpretation rules. Those belong to the device and parameter levels. Network PageSection titled “Network Page”The network page shows the gateway connection status and the list of all devices in the network.
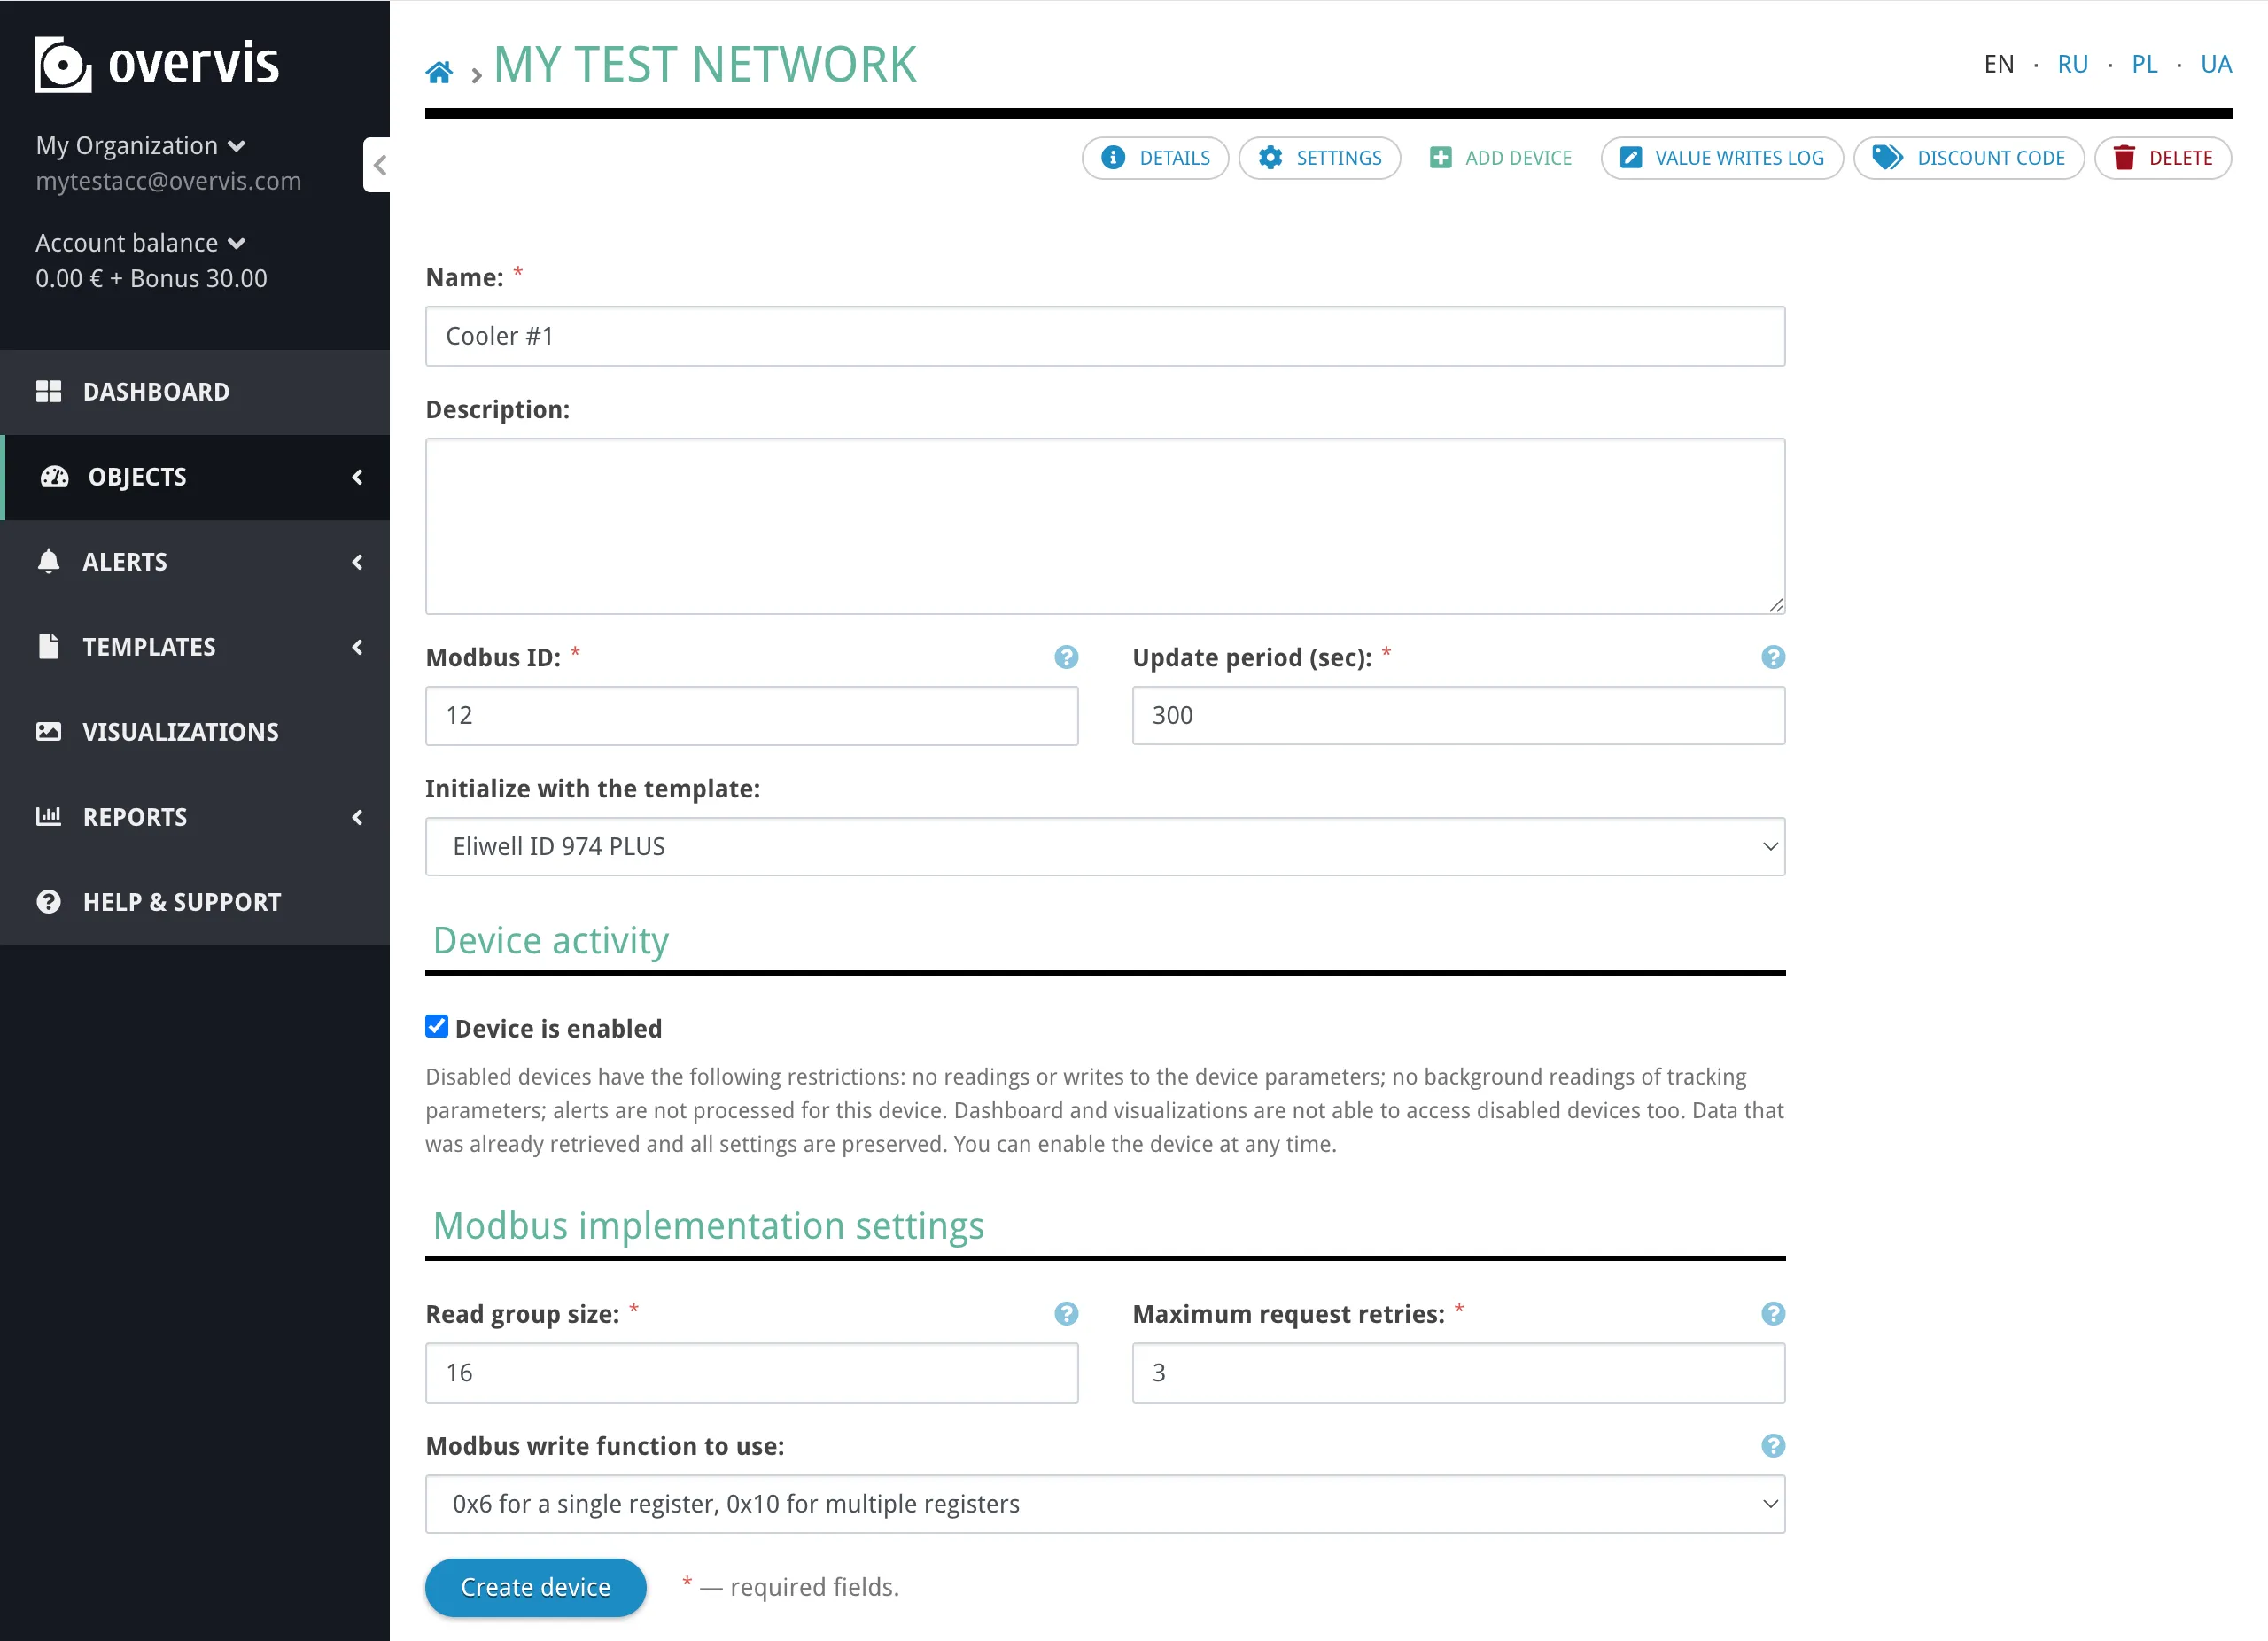
The device list shows each device’s Modbus ID, name, number of tracked parameters, update period, and the time of the last reading. From this page you can enable or disable individual devices, open device settings, or delete a device. For networks using a reverse connection (PIN code or activation code), the page also shows connection status and management actions such as dropping the connection. DevicesSection titled “Devices”A device represents one Modbus unit inside a network — one addressable endpoint behind the controller. All devices in a network share the same controller connection. The key identifier is the Modbus ID (unit ID, 0–255), which must be unique within the network and match the address configured on the physical device (DIP switches, front panel, or device configuration software). Creating a DeviceSection titled “Creating a Device”To create a device, open the network page and click Add device.
The create form asks for:
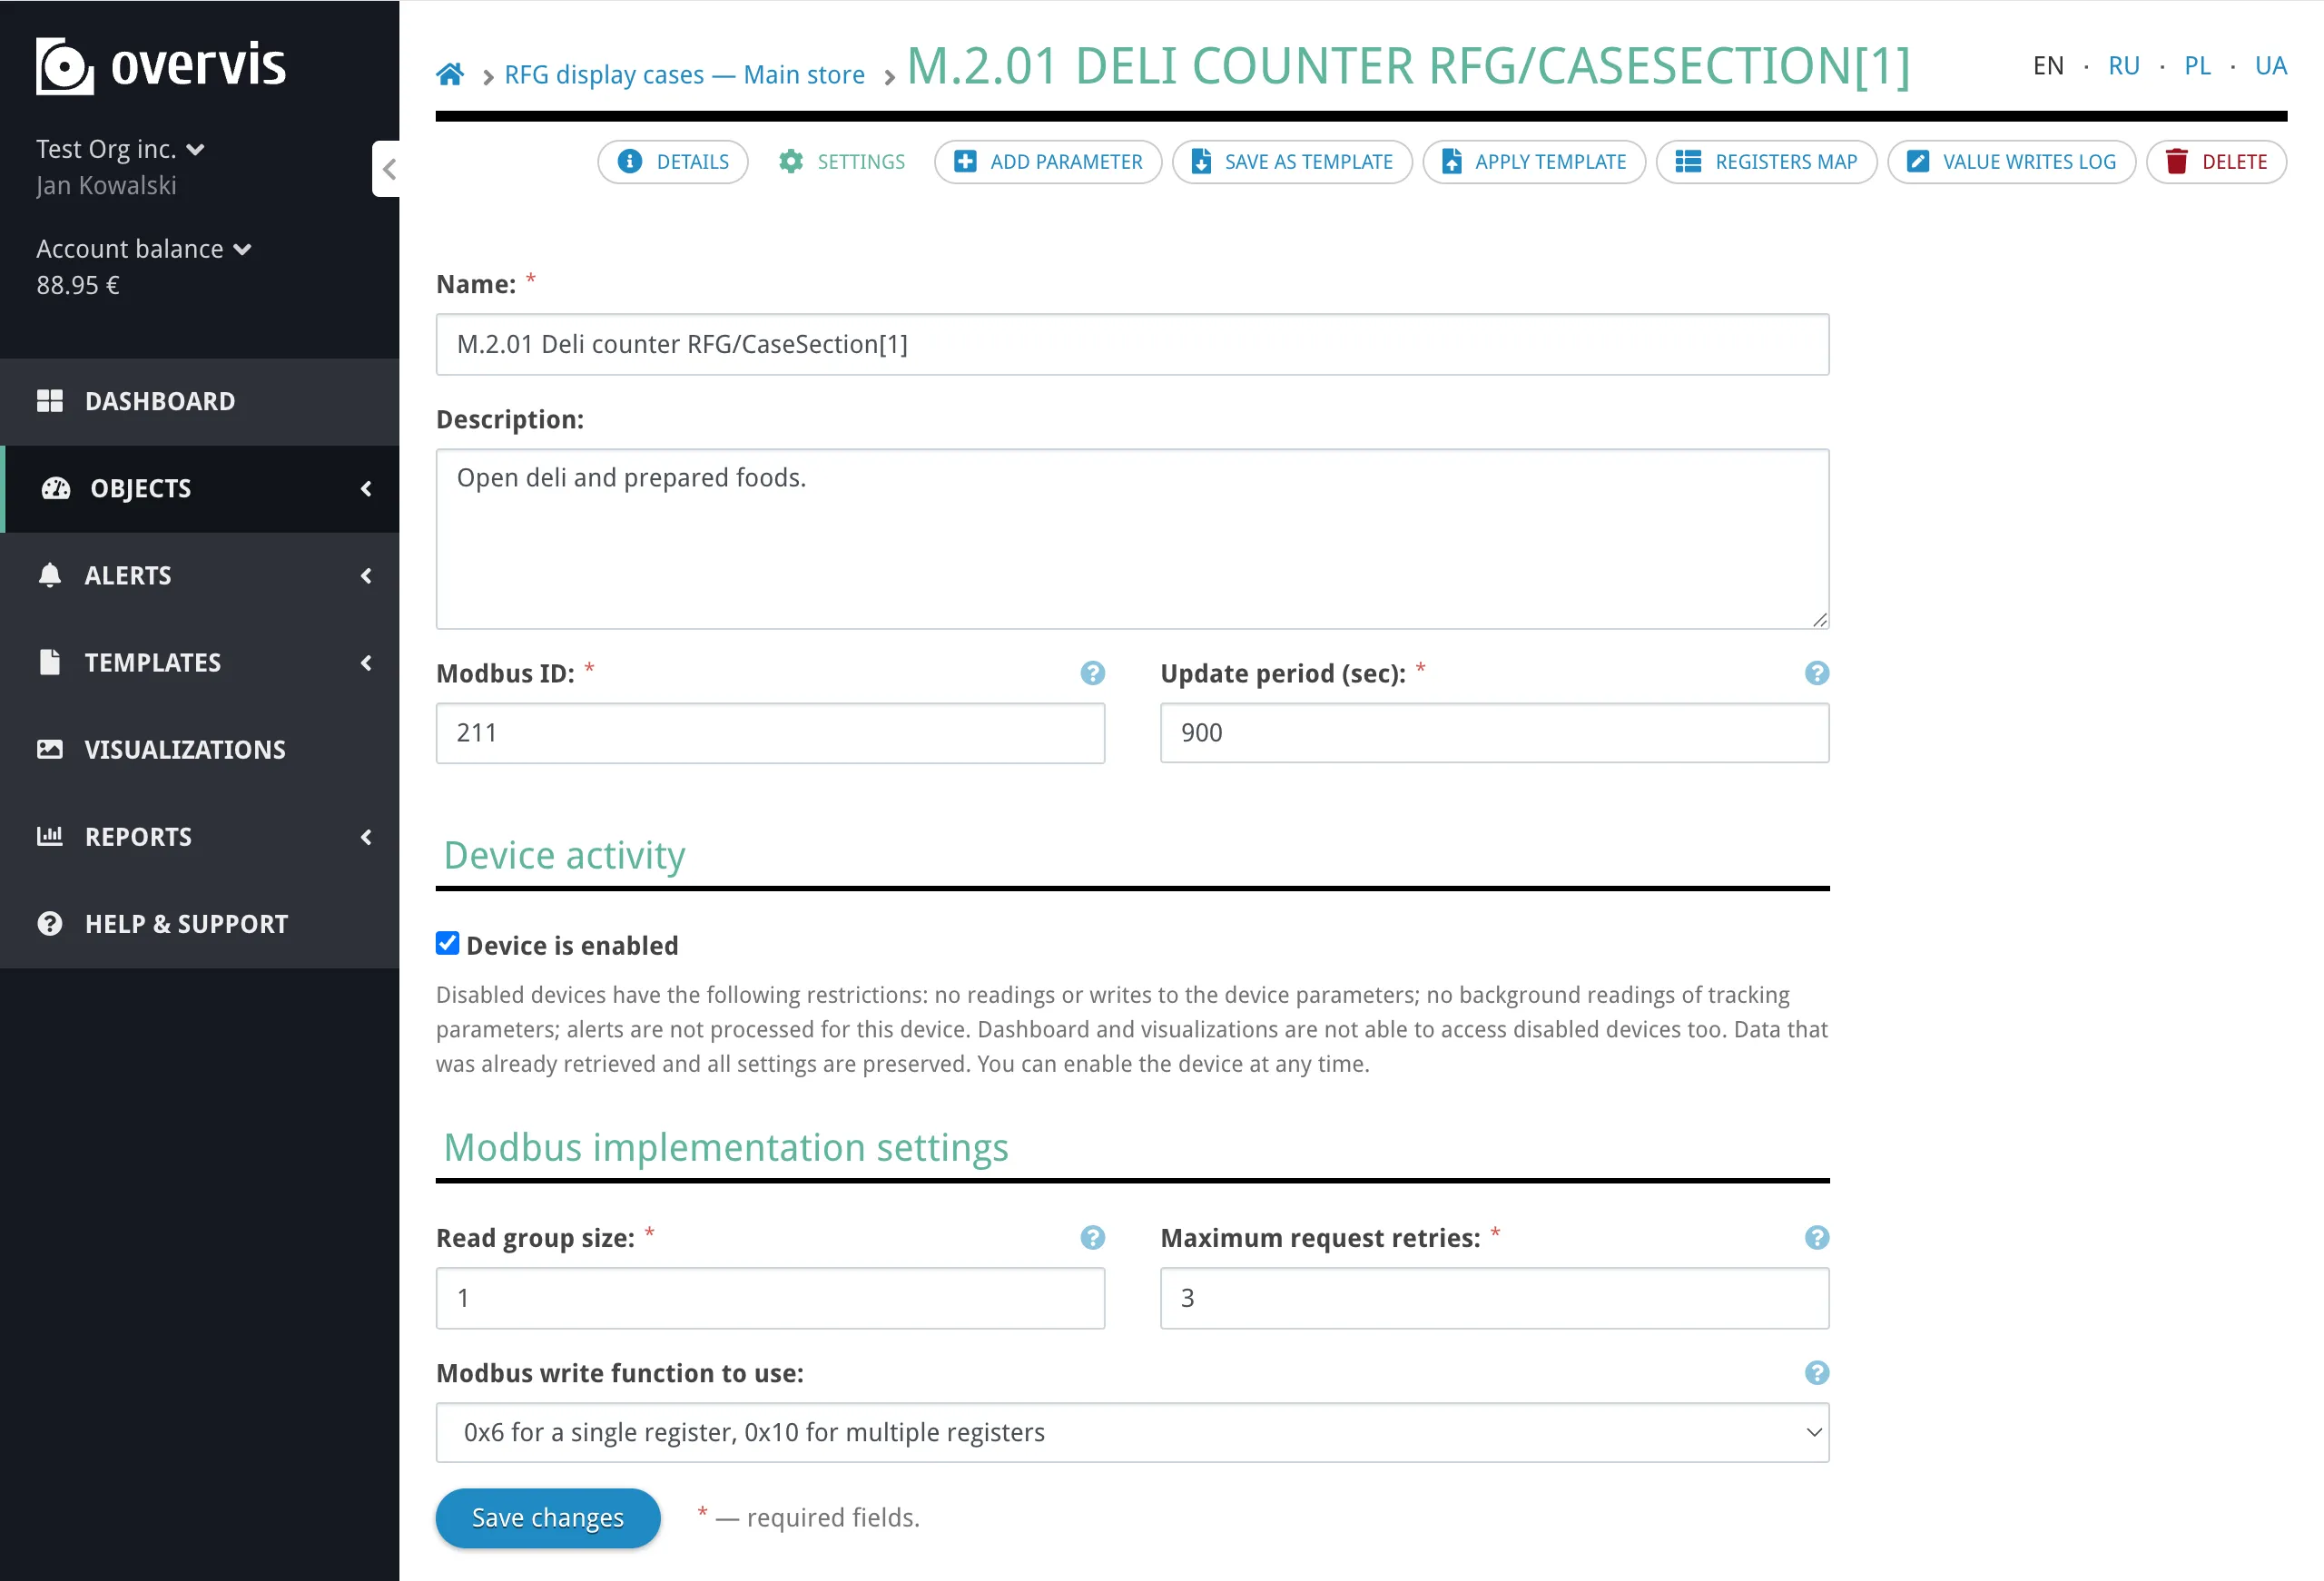
If no template is available for your device, you can add parameters manually after creating the device. After creating the device, Overvis begins communicating with it immediately (if the network is connected and the device is enabled). Device SettingsSection titled “Device Settings”
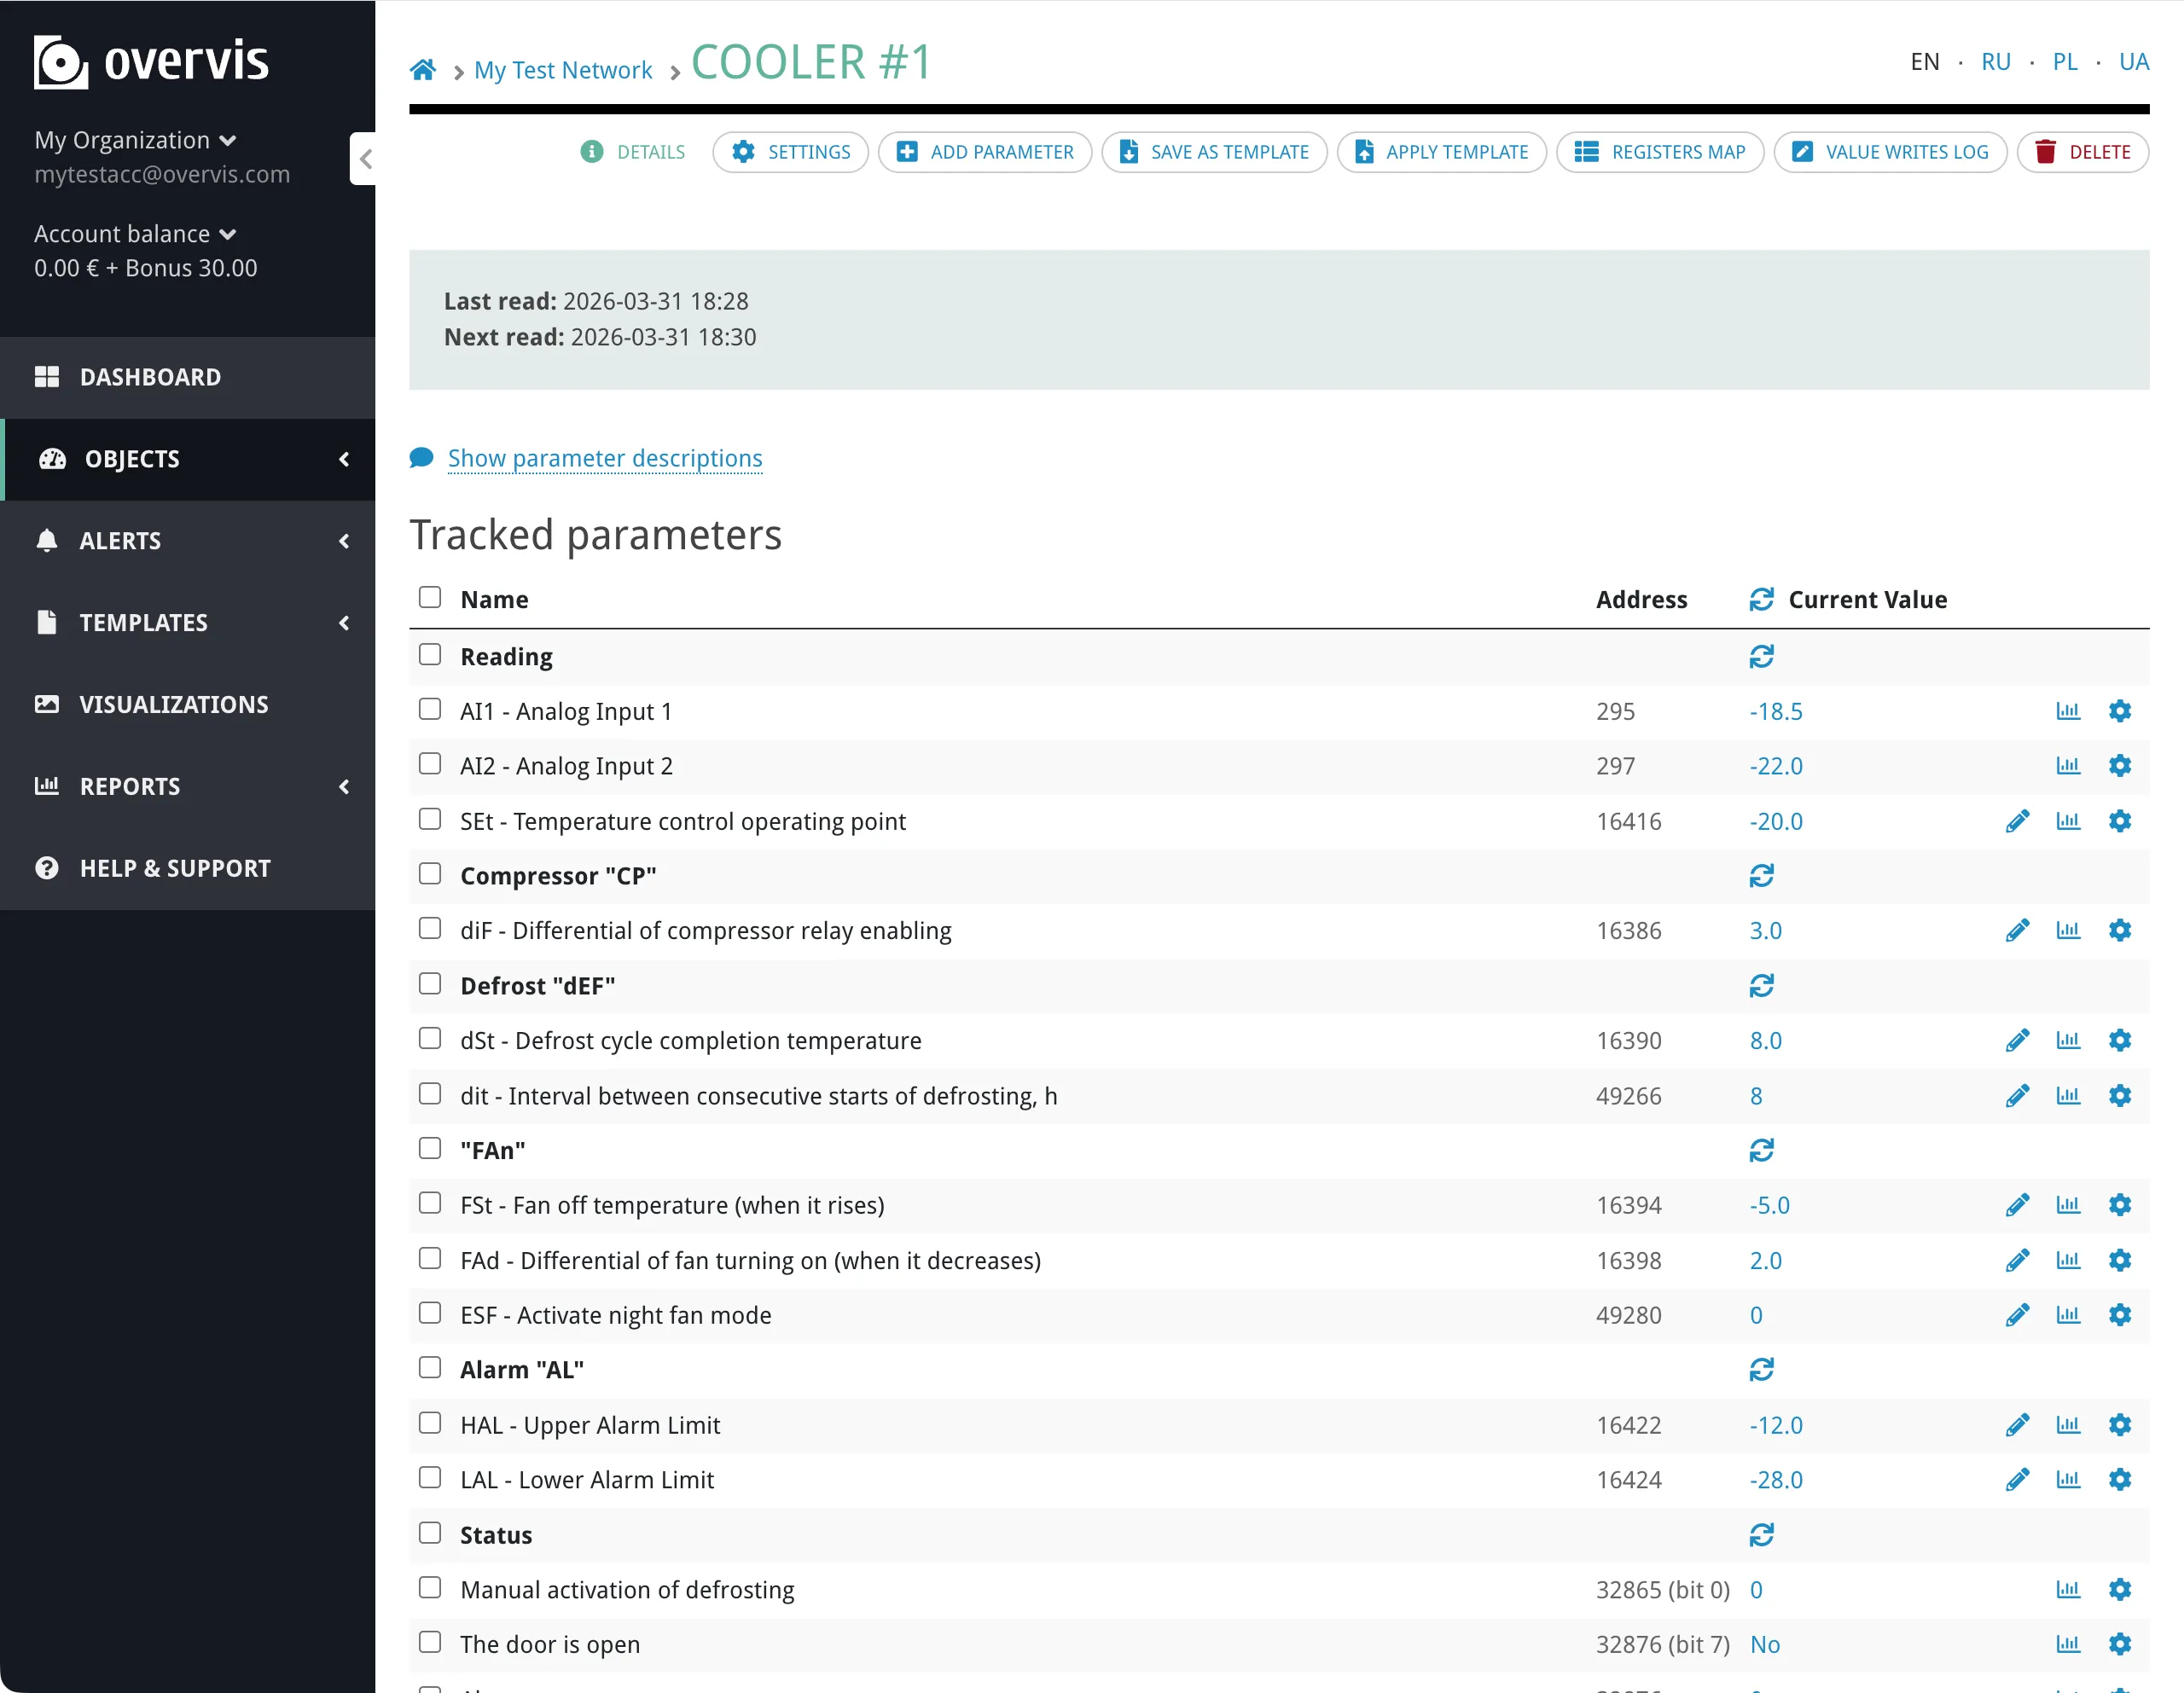
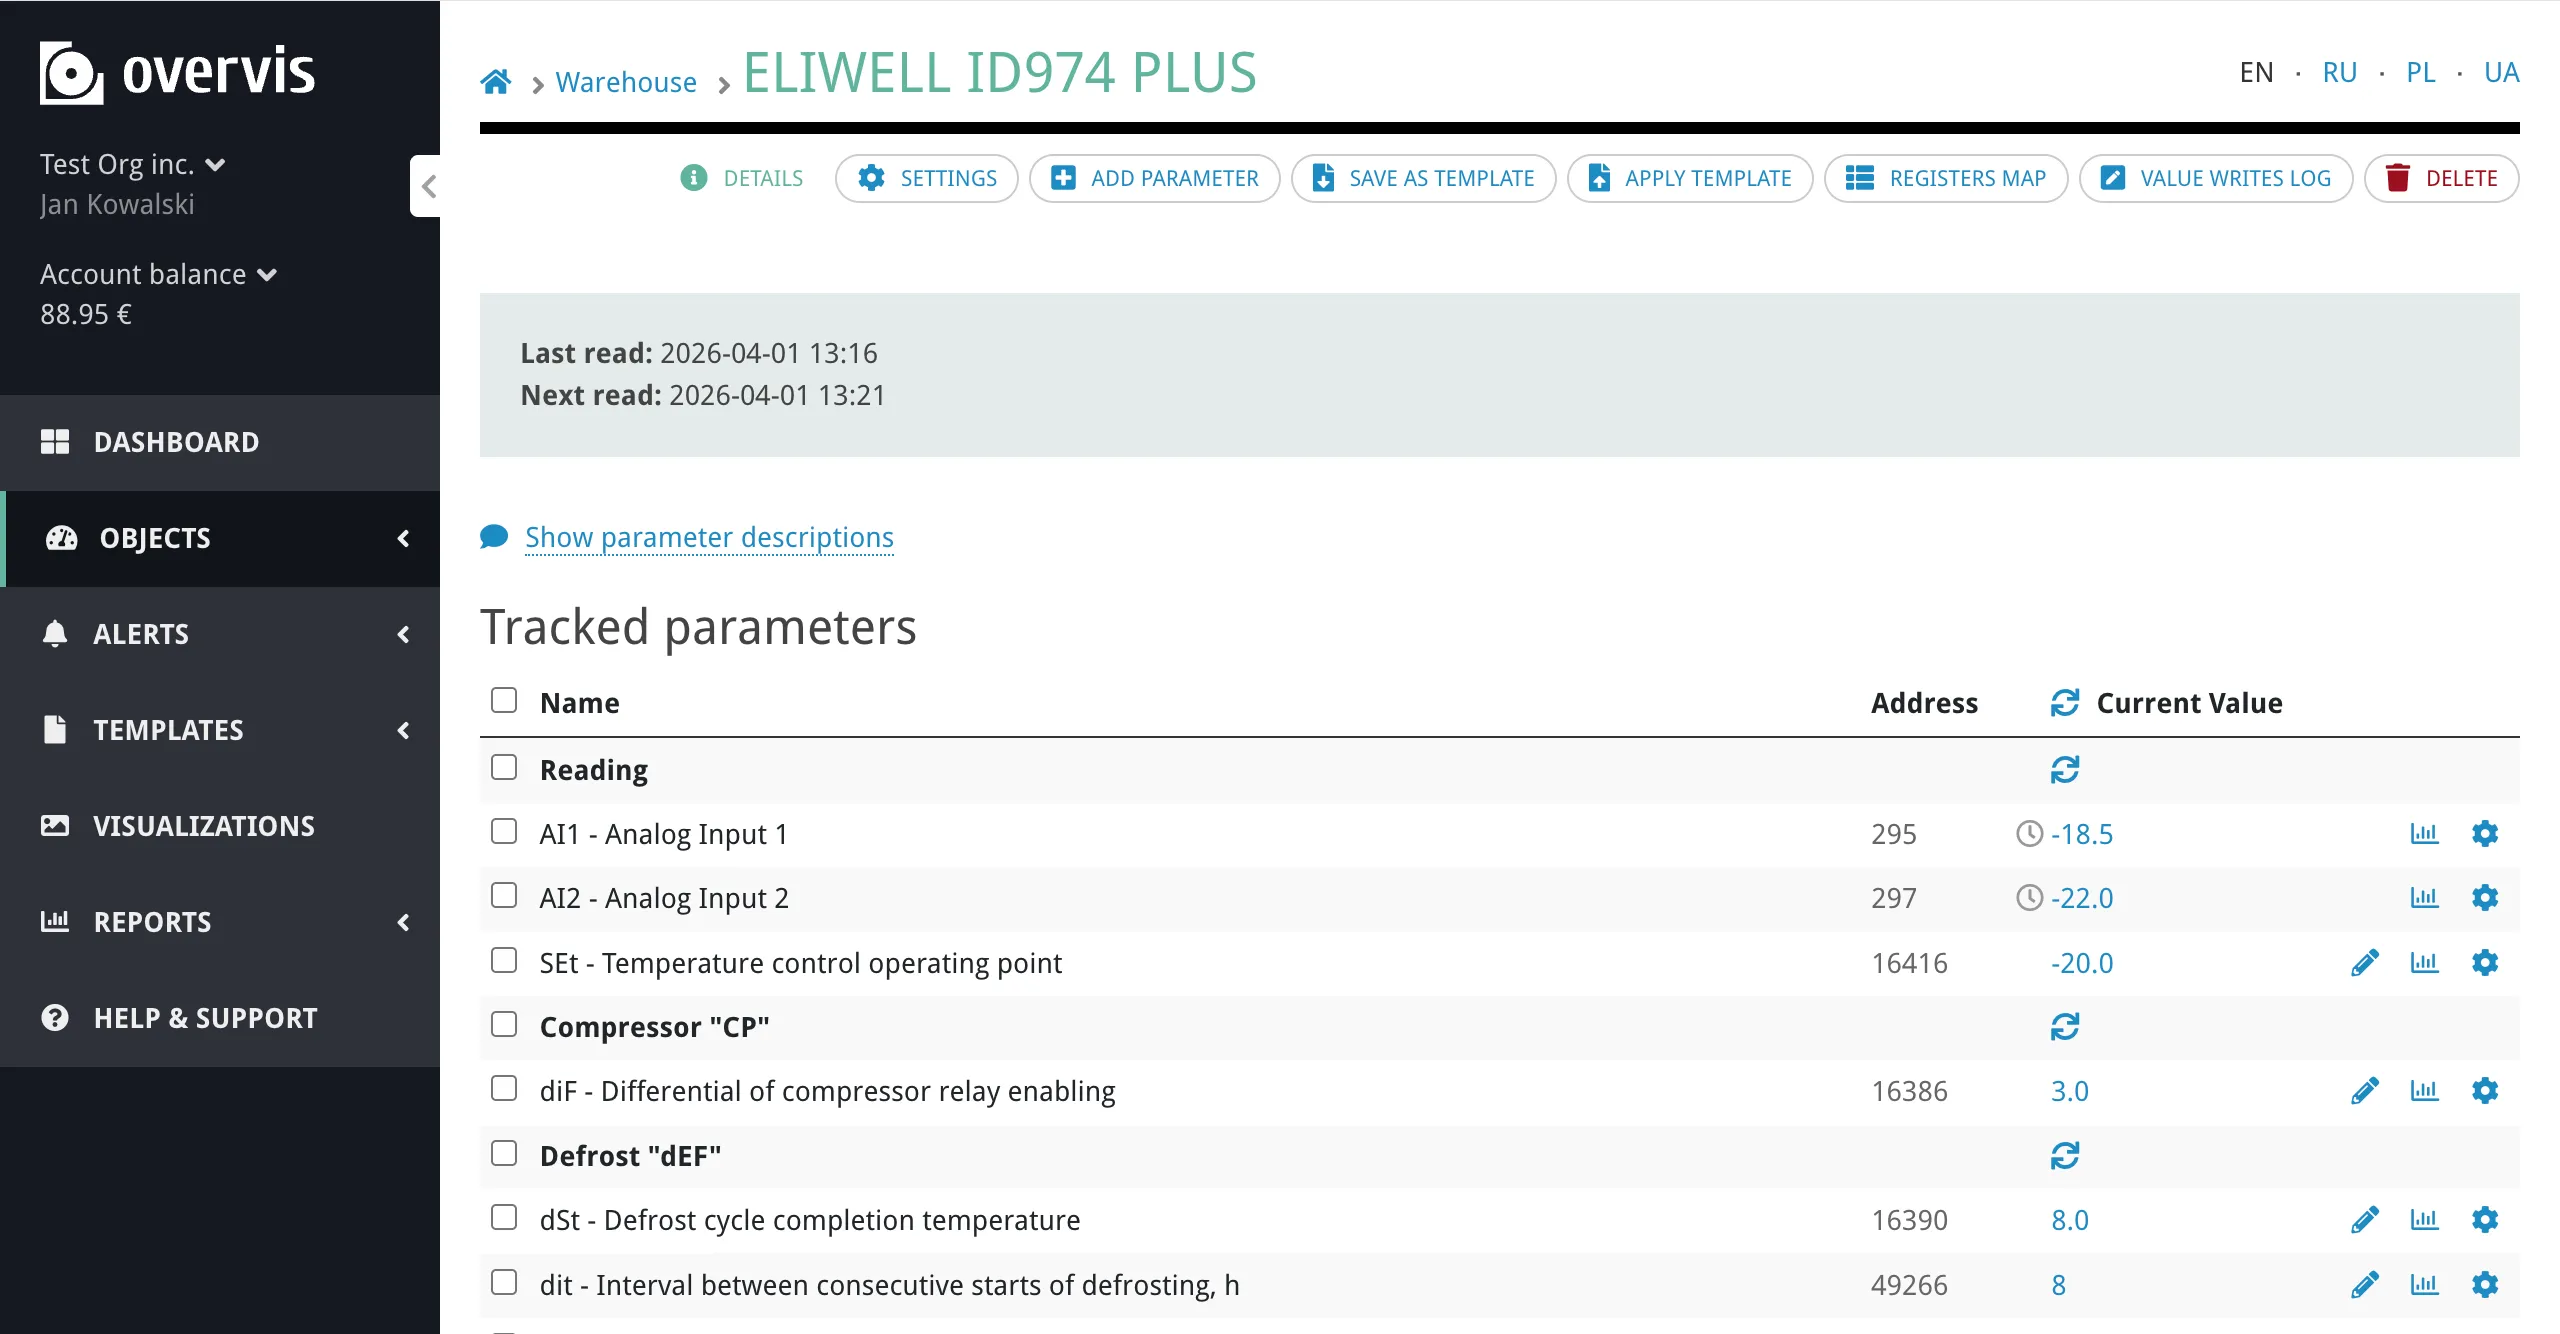
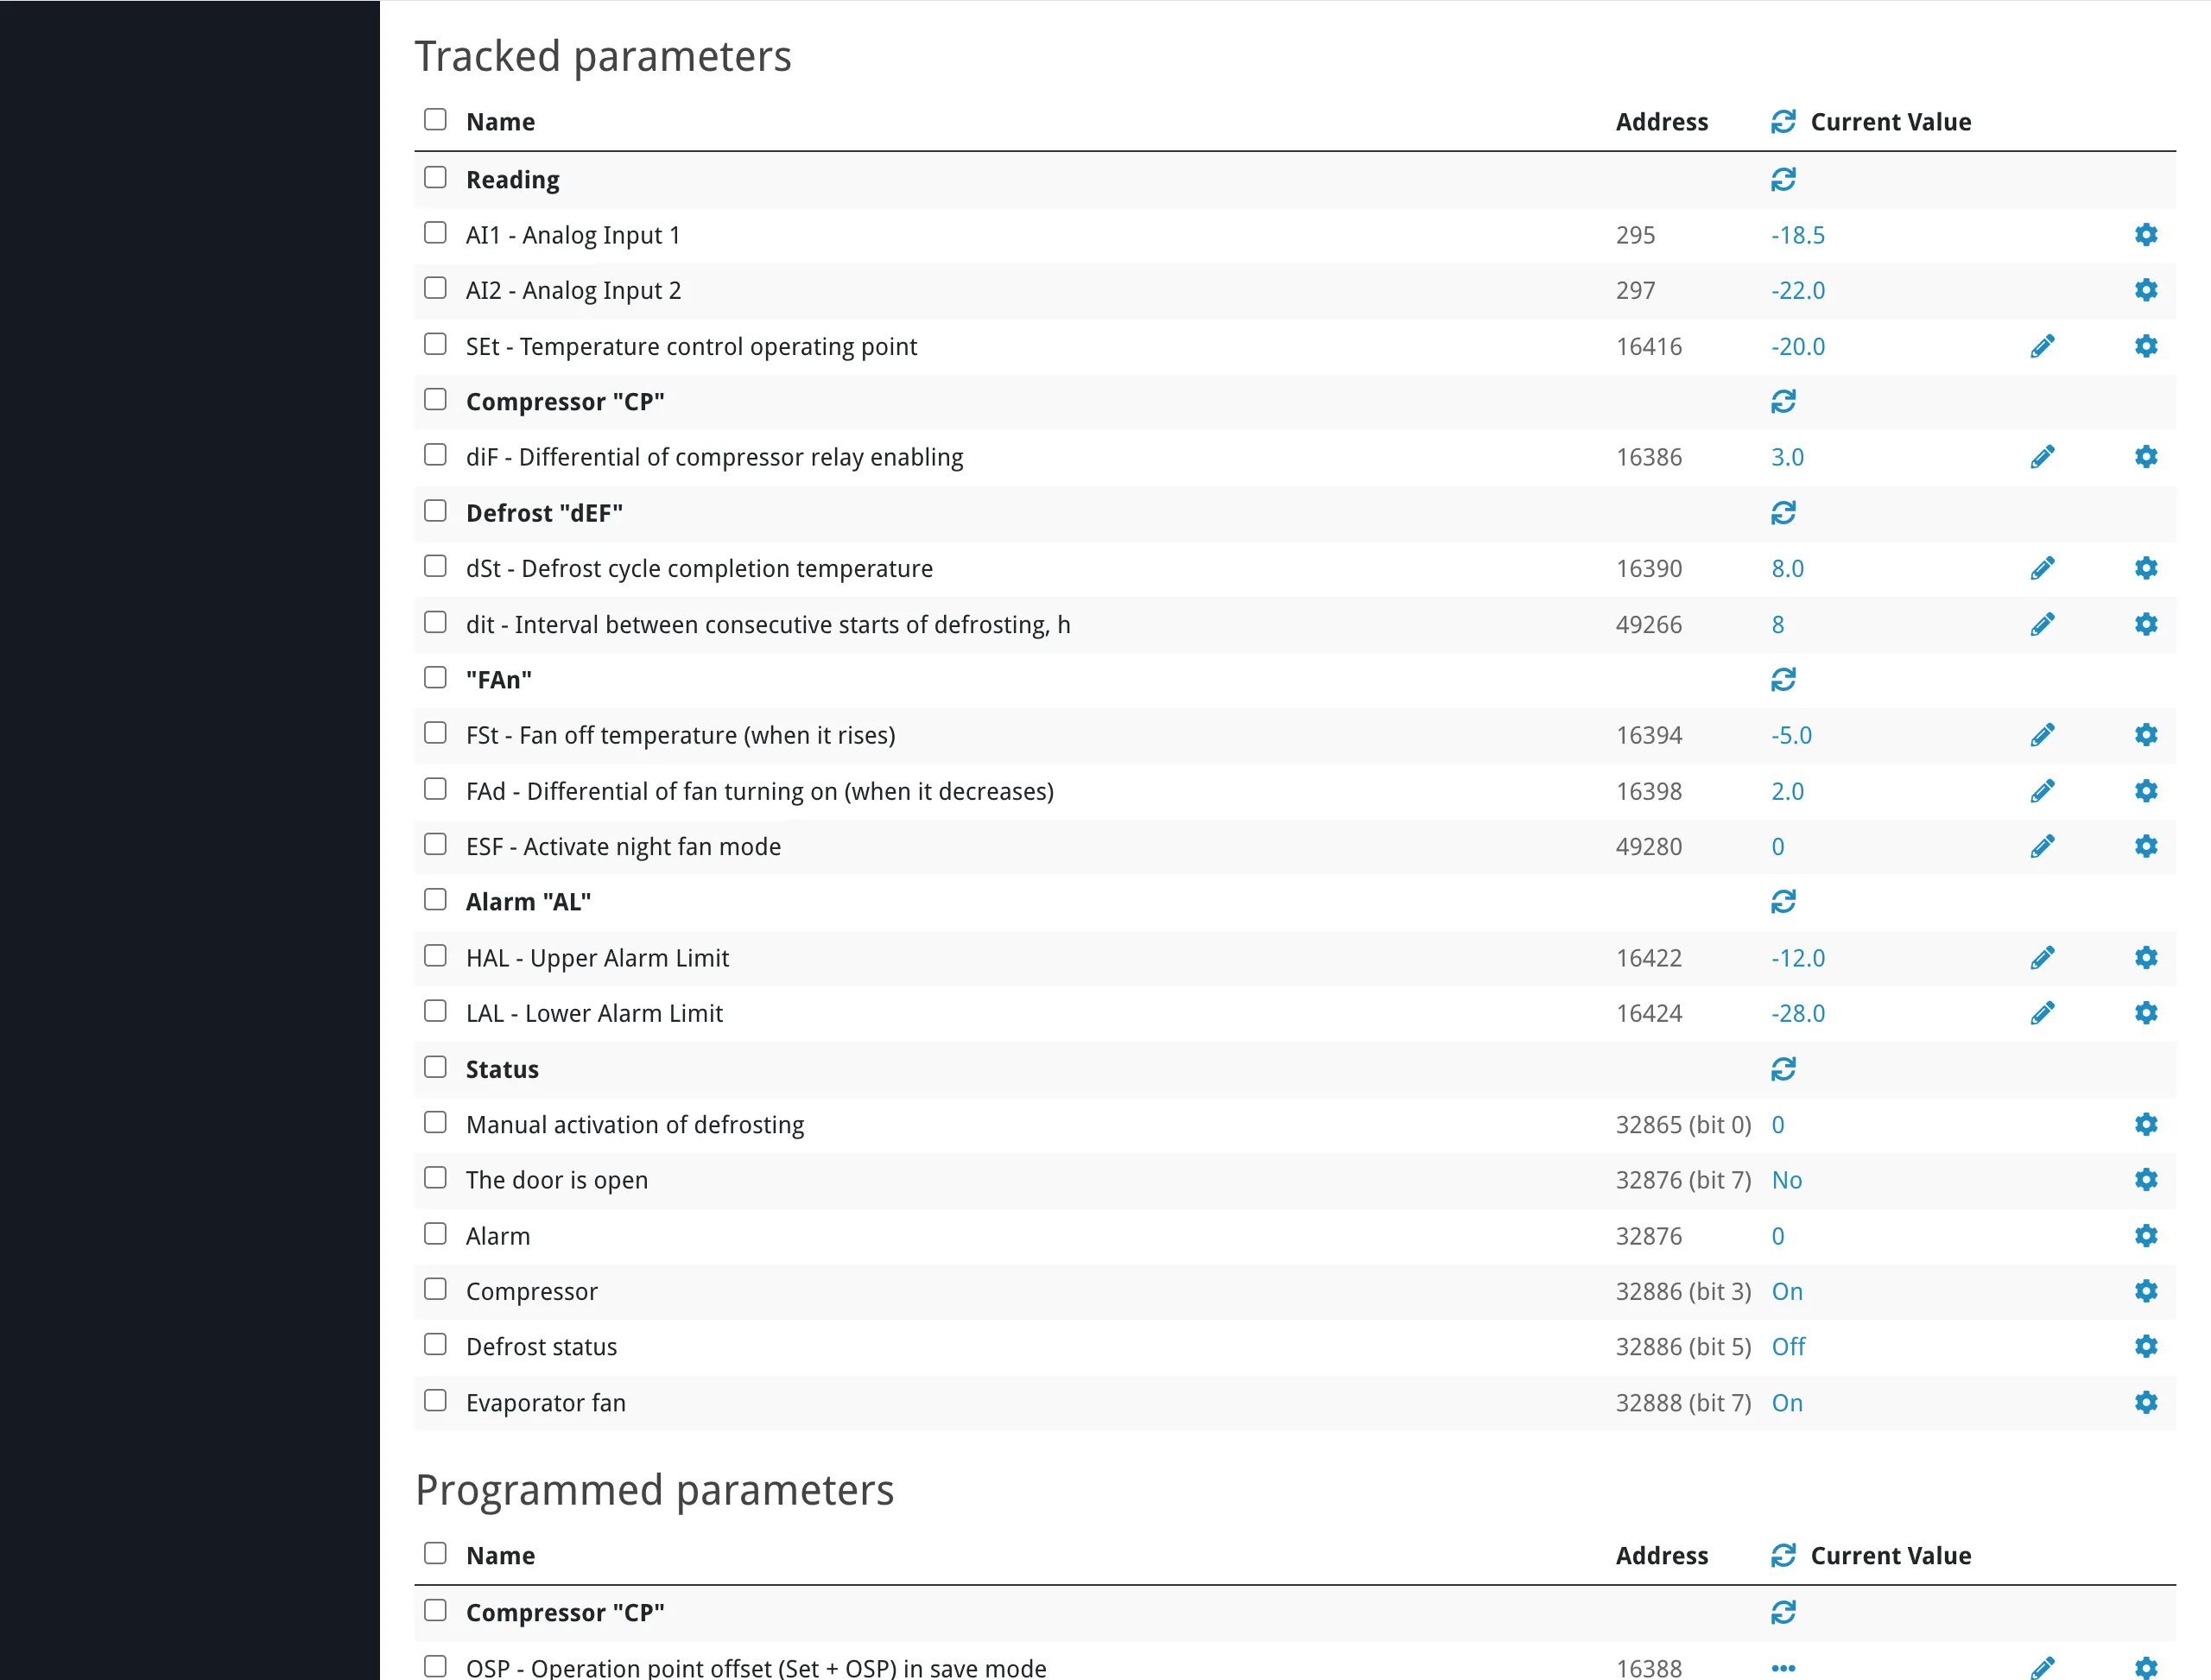
Device settings do not define the connection path to the controller (that is the network level) or how individual register values are decoded (that is the parameter level). Device PageSection titled “Device Page”The device page is where you view and interact with parameter values. Parameters are organized by their behavior flags (tracked, programmable) into sections — see Behavior Flags for definitions. The device page shows:
Reading ValuesSection titled “Reading Values”Tracked parameters display their last stored value by default. This value may be from the most recent background poll, not necessarily live.
To read a live value from the device:
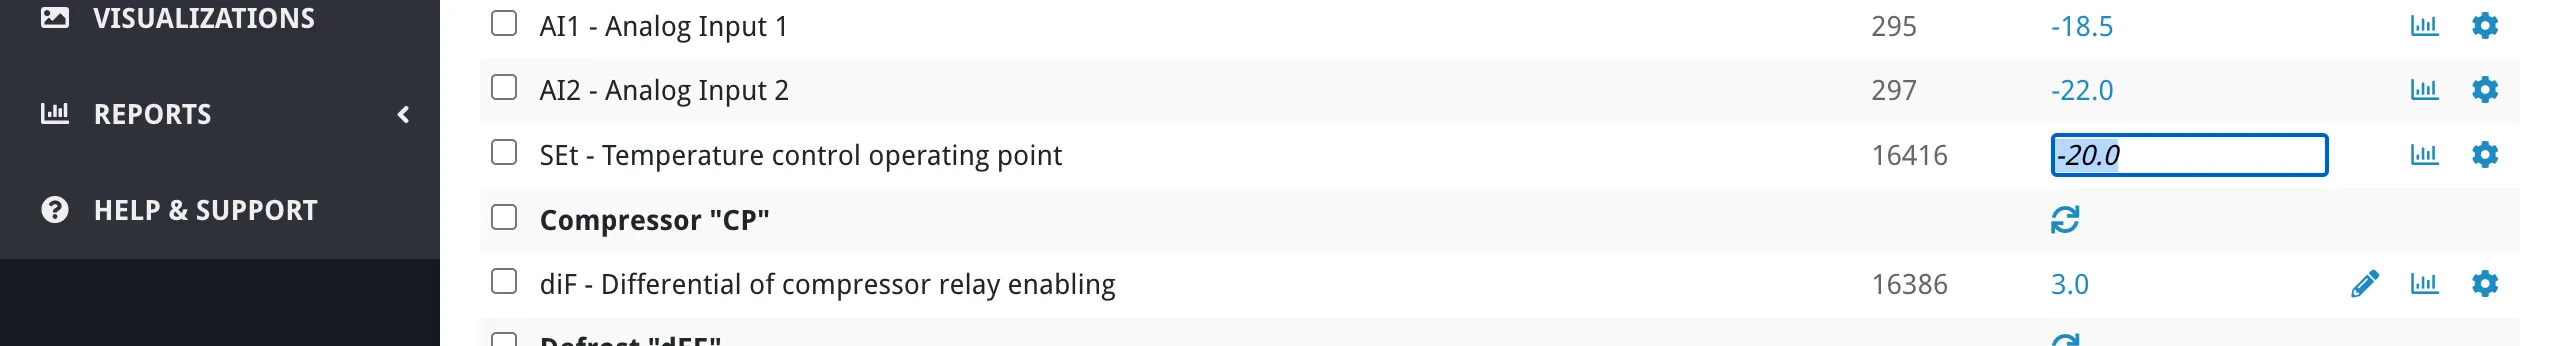
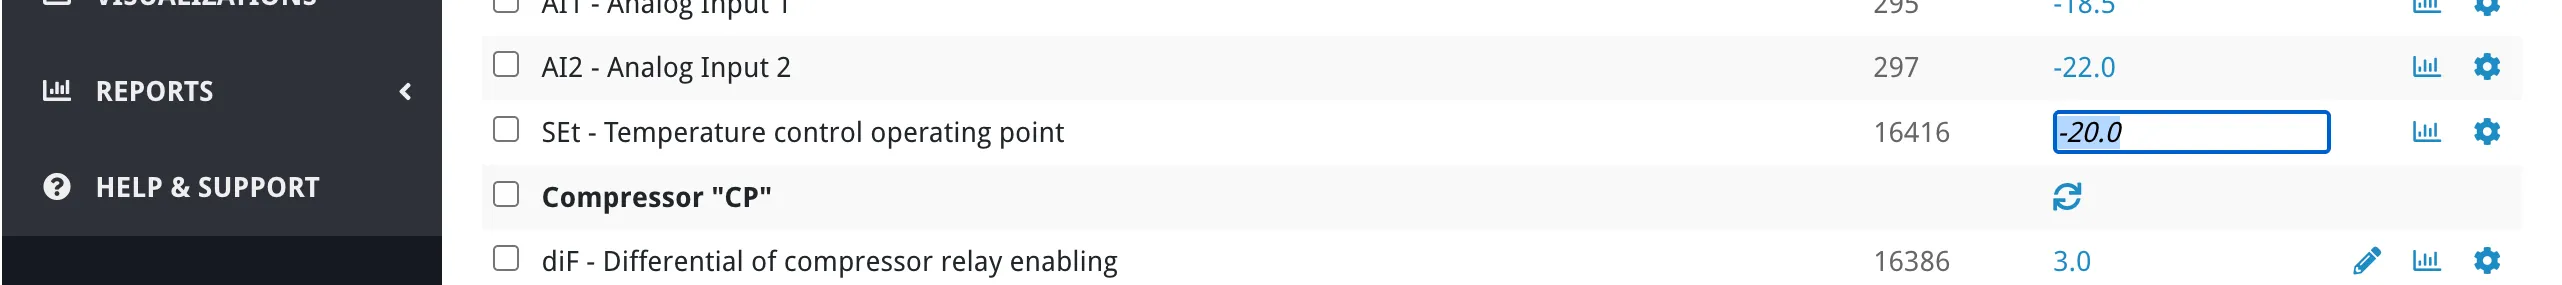
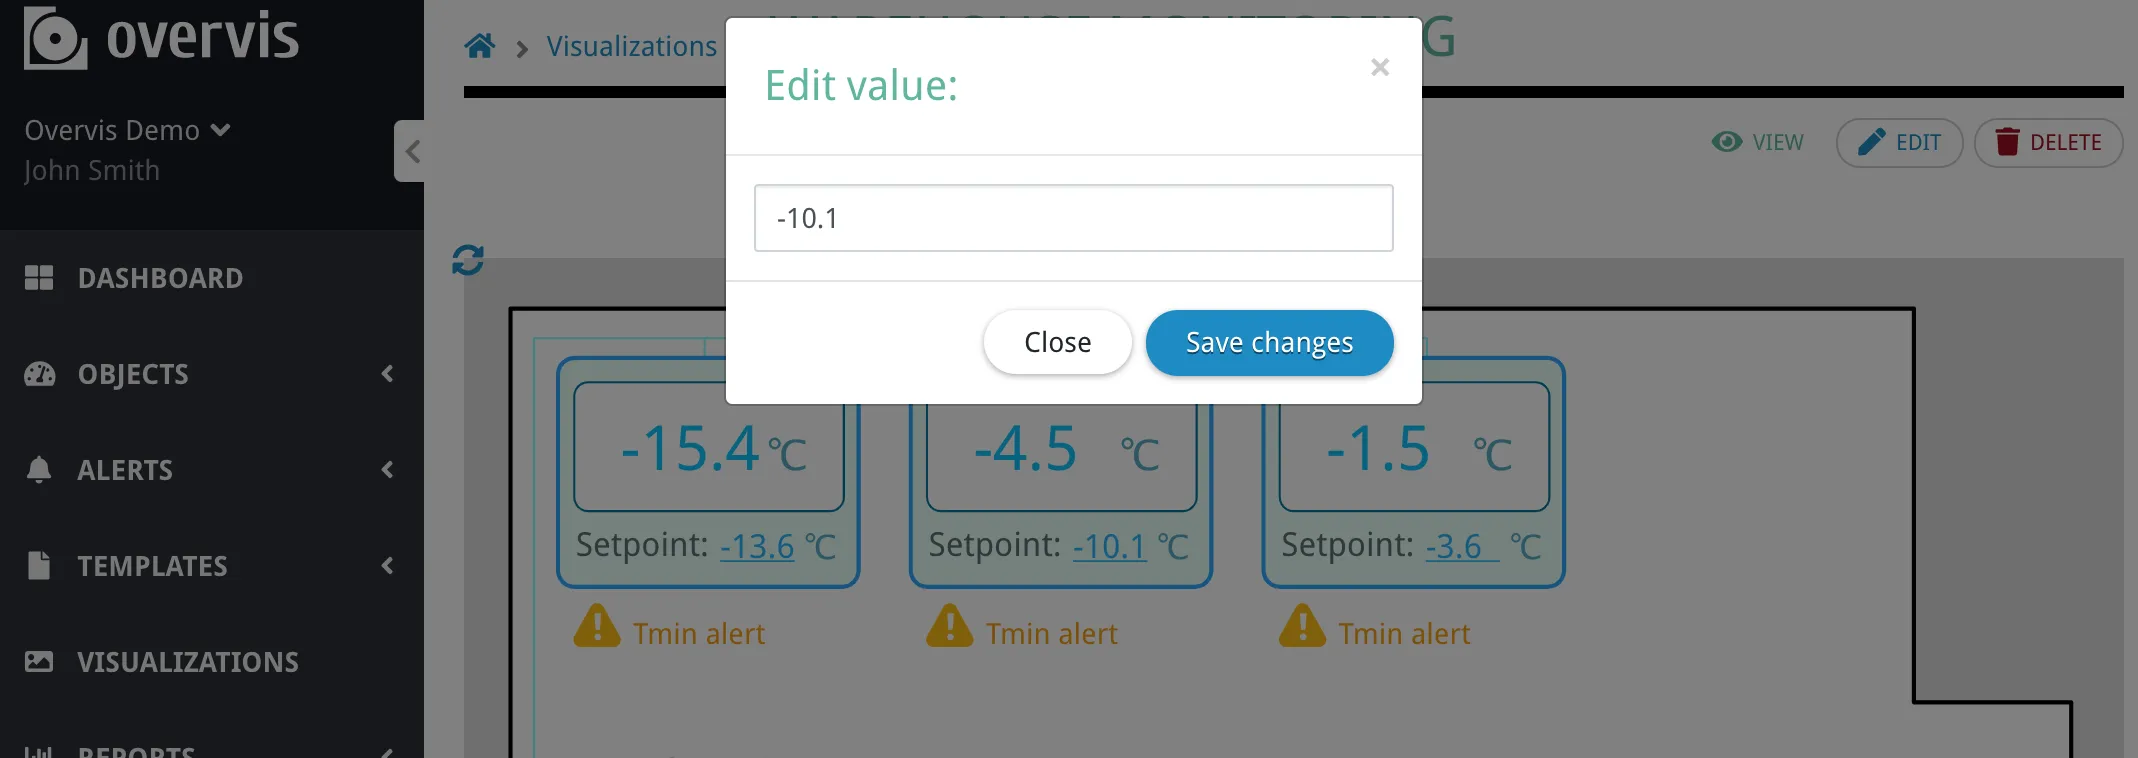
Untracked parameters show ”---” until you trigger an on-demand read. Writing ValuesSection titled “Writing Values”Programmable parameters have a pencil icon next to their value. Clicking it opens an inline editor:
The write is sent to the device immediately. If the write fails, Overvis shows an error message with the reason. ParametersSection titled “Parameters”A parameter is the smallest operational object in the hierarchy. It represents one value definition on a device — a single piece of data that Overvis can read from or write to. A parameter can represent:
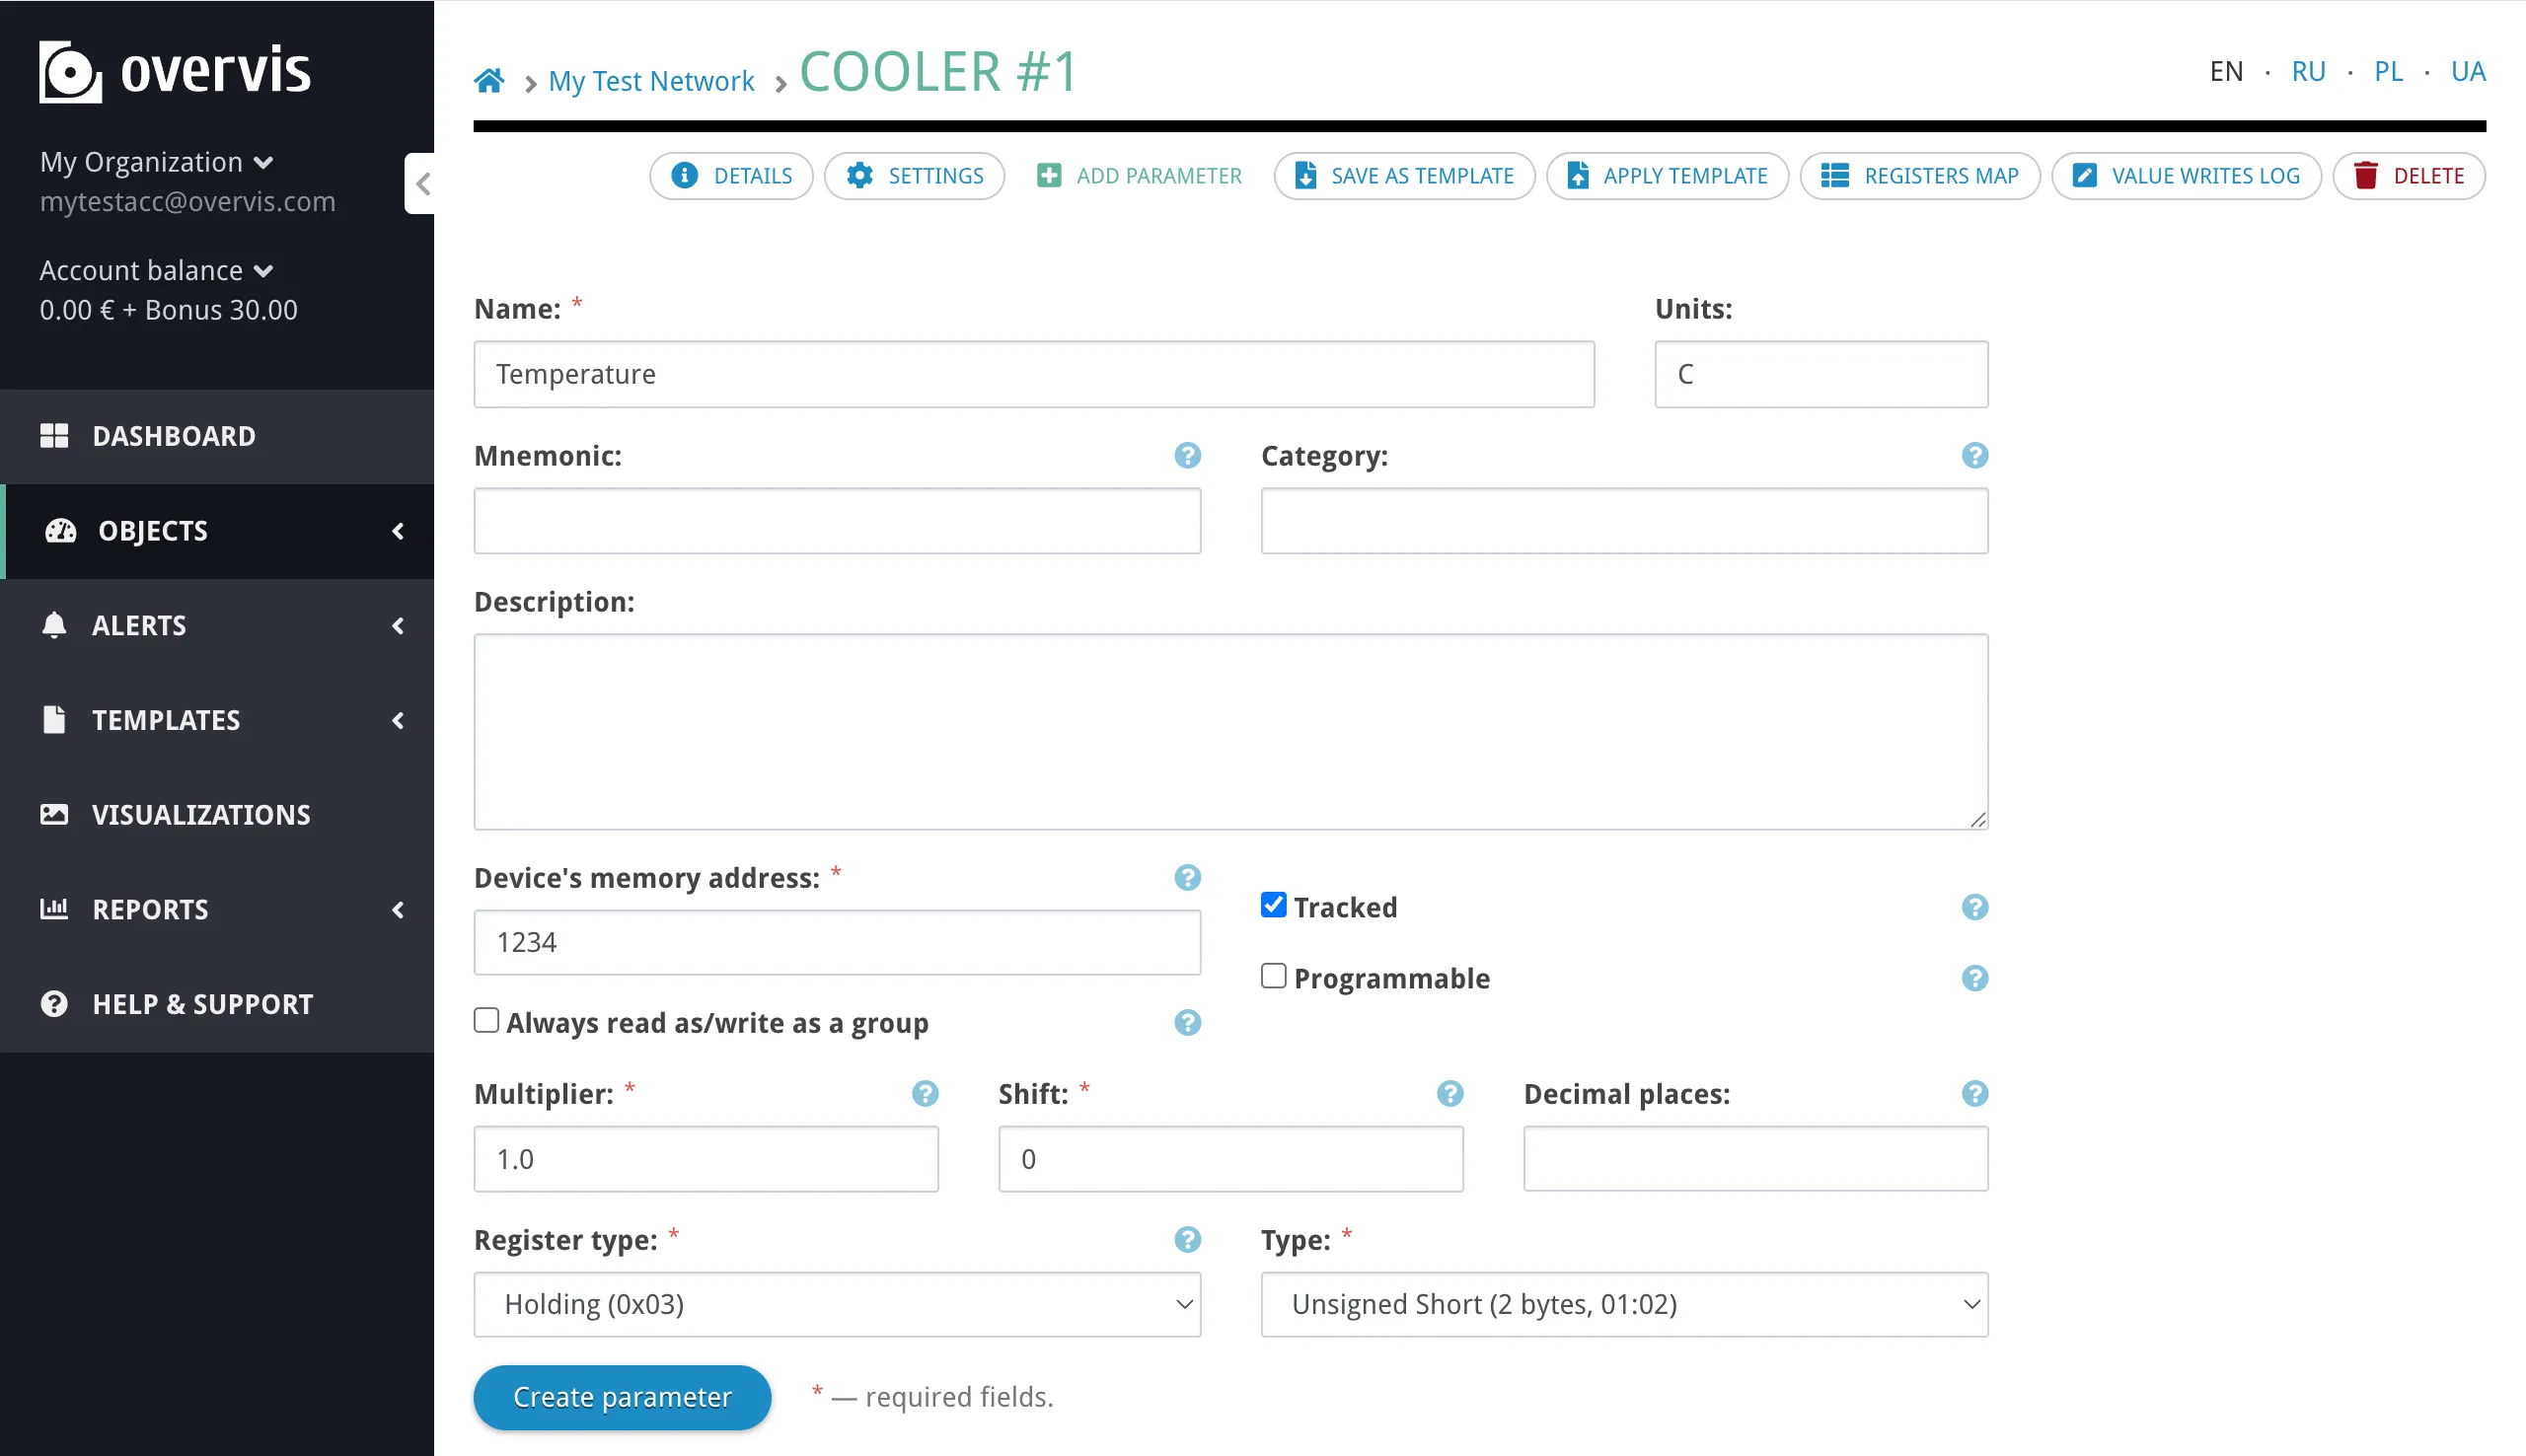
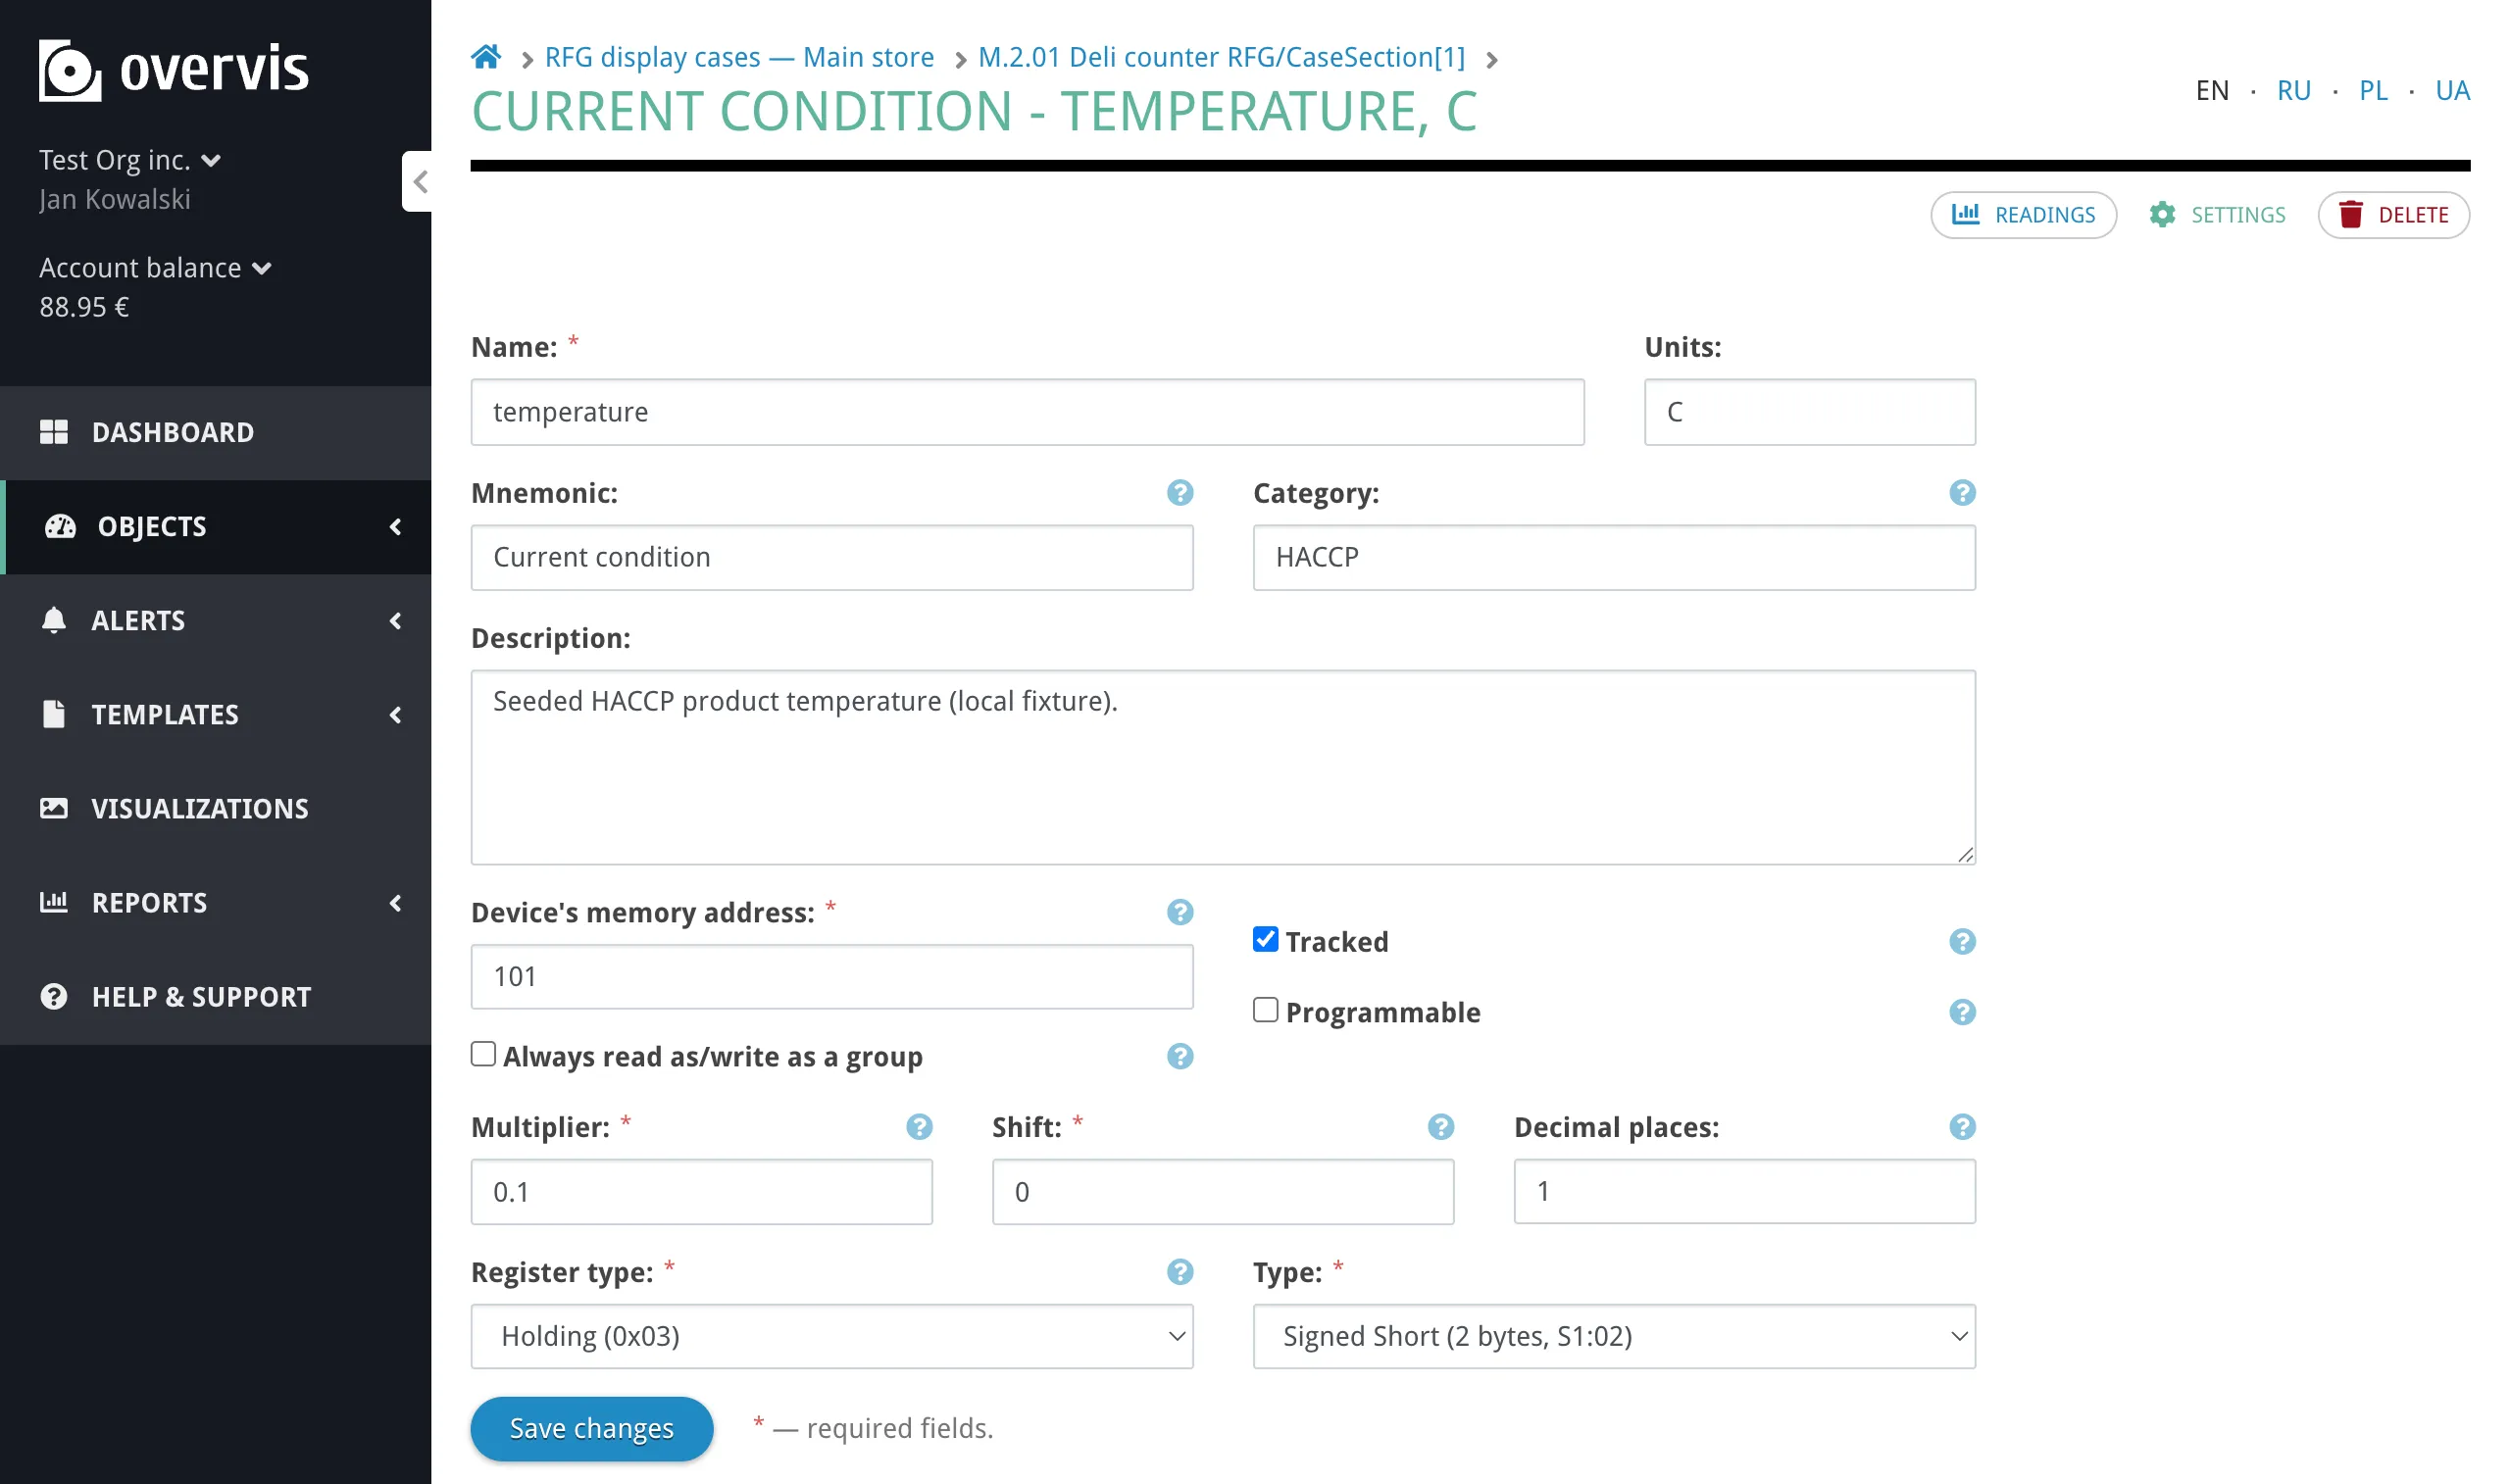
Creating and Editing ParametersSection titled “Creating and Editing Parameters”To add a parameter manually, open the device page and click Add parameter. The form includes all fields described below: name, address, register type, value type, behavior flags, conversion settings, and optional enumeration values.
To edit an existing parameter, click its name on the device page to open the parameter settings. The same form appears with the current values pre-filled. If your device has many parameters, using a device template is faster than adding them one by one. Parameter SettingsSection titled “Parameter Settings”
MetadataSection titled “Metadata”Each parameter stores the following identification and organizational fields:
AddressSection titled “Address”Each parameter maps to a location in the device’s Modbus memory map. The full address is defined by the combination of:
The same device memory address can legitimately appear in more than one parameter when the parameters represent different views of the same data — for example, a whole-register numeric value and a single bit flag inside that same register, or several independent bit flags from one status register. Register TypesSection titled “Register Types”Overvis supports all four Modbus register types:
Holding registers are the most common type in practice. Coils and discrete inputs are inherently single-bit and always use the Value TypesSection titled “Value Types”The value type defines how the raw register data is interpreted. It determines the binary layout, byte order, and number of registers a parameter occupies. Overvis supports a wide range of value types:
Byte order matters. Many devices store multi-byte values in big-endian order (most significant byte first), but some use byte-swapped or word-swapped layouts. If a value reads as garbage or an unreasonable number, the byte order is likely wrong — try the other variants for the same data width. Behavior FlagsSection titled “Behavior Flags”Three flags control how Overvis treats a parameter operationally: Tracked — a tracked parameter participates in background polling and persistent storage:
An untracked parameter is still part of the device model and can be read on demand, but it is not polled automatically and its values are not stored. Programmable — a programmable parameter can be written through Overvis. Non-programmable parameters are read-only in the Overvis UI regardless of whether the underlying register supports writes. Tracked and programmable are independent flags. A parameter can be:
Always read/write as a group — when enabled, Overvis keeps the entire multi-register value together in one Modbus request instead of allowing it to be split across separate requests. This is relevant for parameters that span more than one register (e.g. 32-bit floats, 64-bit integers, strings) where partial reads could produce corrupted values if the device does not update all registers at the same instant. Parameter Groups on the Device PageSection titled “Parameter Groups on the Device Page”On the device page, parameters are grouped into three sections based on these flags:
Within each section, parameters are further grouped by category.
Value ConversionSection titled “Value Conversion”After reading a raw value from the device, Overvis can transform it for display using three parameter-level settings:
The conversion formula is:
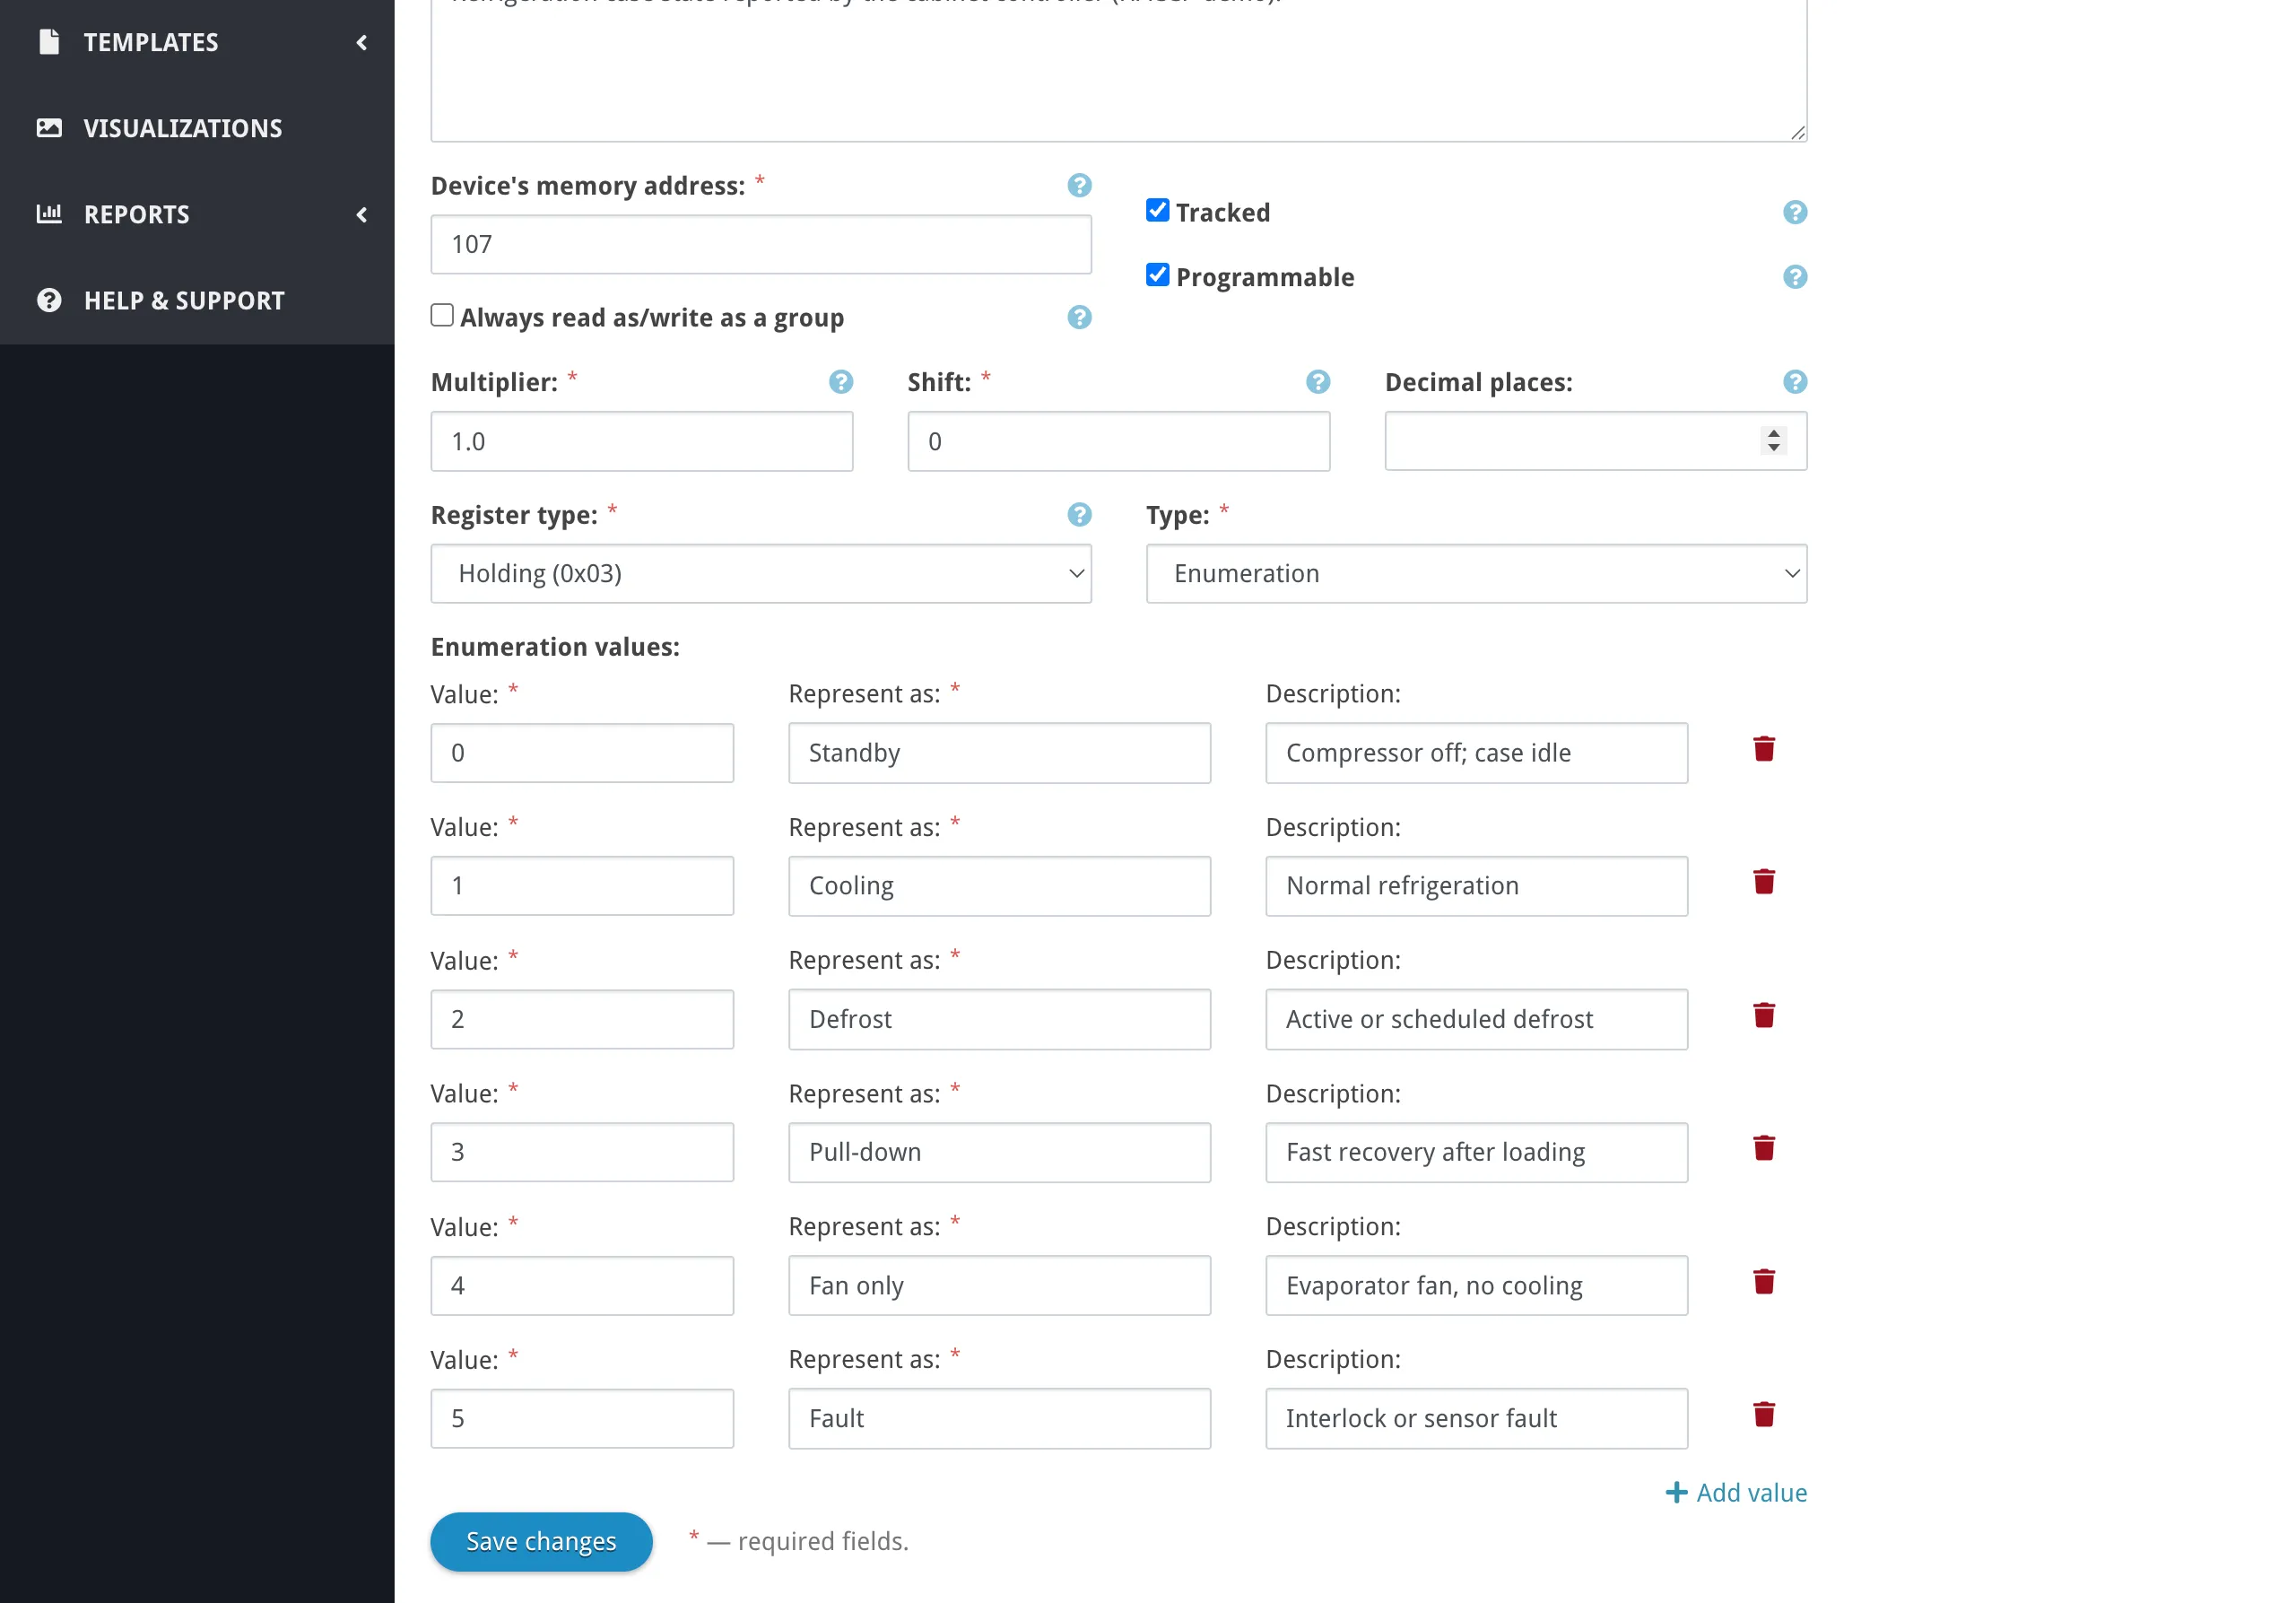
For example, if a temperature sensor stores values in tenths of a degree (raw value Overvis stores raw register values in the database and applies conversion at display time. This means multiplier and shift affect how all readings appear — both historical and new. Changing the multiplier retroactively changes how old data looks in charts and reports. Decimal places affects formatting only, not the stored value. When neither multiplier nor shift is set, Overvis treats the value as unscaled: the displayed value equals the raw register value (equivalent to multiplier 1 and shift 0). Enumeration ParametersSection titled “Enumeration Parameters”Enumeration is a value type for parameters where a numeric register encodes a discrete state or mode — for example, machine status, operating mode, or alarm type. At the Modbus level it works like any other numeric parameter, but Overvis maps the raw values to human-readable labels using a lookup table. Each entry in the enumeration table contains:
For example, a parameter “Operating Mode” might have the mapping:
When reading, Overvis shows “Heating” instead of
Enumeration tables can be shared across multiple parameters, which is useful when several parameters on different devices use the same set of states. Min/Max Value LimitsSection titled “Min/Max Value Limits”Parameters can optionally define minimum and maximum values. These are informational boundaries — they help constrain write inputs in the UI and provide context for expected value ranges. They do not affect how values are read from the device. TroubleshootingSection titled “Troubleshooting”Parameter value looks wrong (garbage, implausibly large, or zero)Section titled “Parameter value looks wrong (garbage, implausibly large, or zero)”This usually means the value type or byte order does not match what the device actually sends. For example, reading a 32-bit float as a 16-bit unsigned integer, or using big-endian byte order when the device uses word-swapped order. How to fix:
Device shows as unreachableSection titled “Device shows as unreachable”The device is not responding to Modbus requests within the timeout. Common causes and fixes:
On-demand read shows ”---”Section titled “On-demand read shows ”---””A ”---” value means Overvis has no stored reading for that parameter. This is normal for untracked parameters that have never been read manually. How to fix:
Write to a parameter failsSection titled “Write to a parameter fails”When Overvis cannot write a value to a parameter, common causes include:
Polling is slower than expectedSection titled “Polling is slower than expected”If tracked parameters update less frequently than the configured update period:
Common QuestionsSection titled “Common Questions”How do I change which parameters are tracked?Section titled “How do I change which parameters are tracked?”On the device page, you can bulk-change behavior flags. Select parameters using the checkboxes and use the buttons below the parameter list to mark them as tracked or untracked. You can also change tracking in individual parameter settings. Enabling tracking starts background polling and data storage for that parameter. Disabling tracking stops polling and storage, but existing historical data is preserved. Can I use the same register address for multiple parameters?Section titled “Can I use the same register address for multiple parameters?”Yes. This is common when one register contains multiple independent bit flags — you can create separate bit-type parameters for each flag, all pointing to the same register address but with different bit positions. Similarly, you might have one parameter reading the full register as a numeric value and another parameter reading a single status bit from it. What happens to historical data if I change parameter settings?Section titled “What happens to historical data if I change parameter settings?”Changing value type, multiplier, or shift retroactively changes how all stored readings appear — see Value Conversion. Changing the register address or register type makes the parameter read from a different location going forward; old data still shows the values from the previous address. Related FeaturesSection titled “Related Features”Networks, devices, and parameters are the foundation for other Overvis features:
|
| | |||||||||||||||||||||||||||
|---|---|---|---|---|---|---|---|---|---|---|---|---|---|---|---|---|---|---|---|---|---|---|---|---|---|---|---|
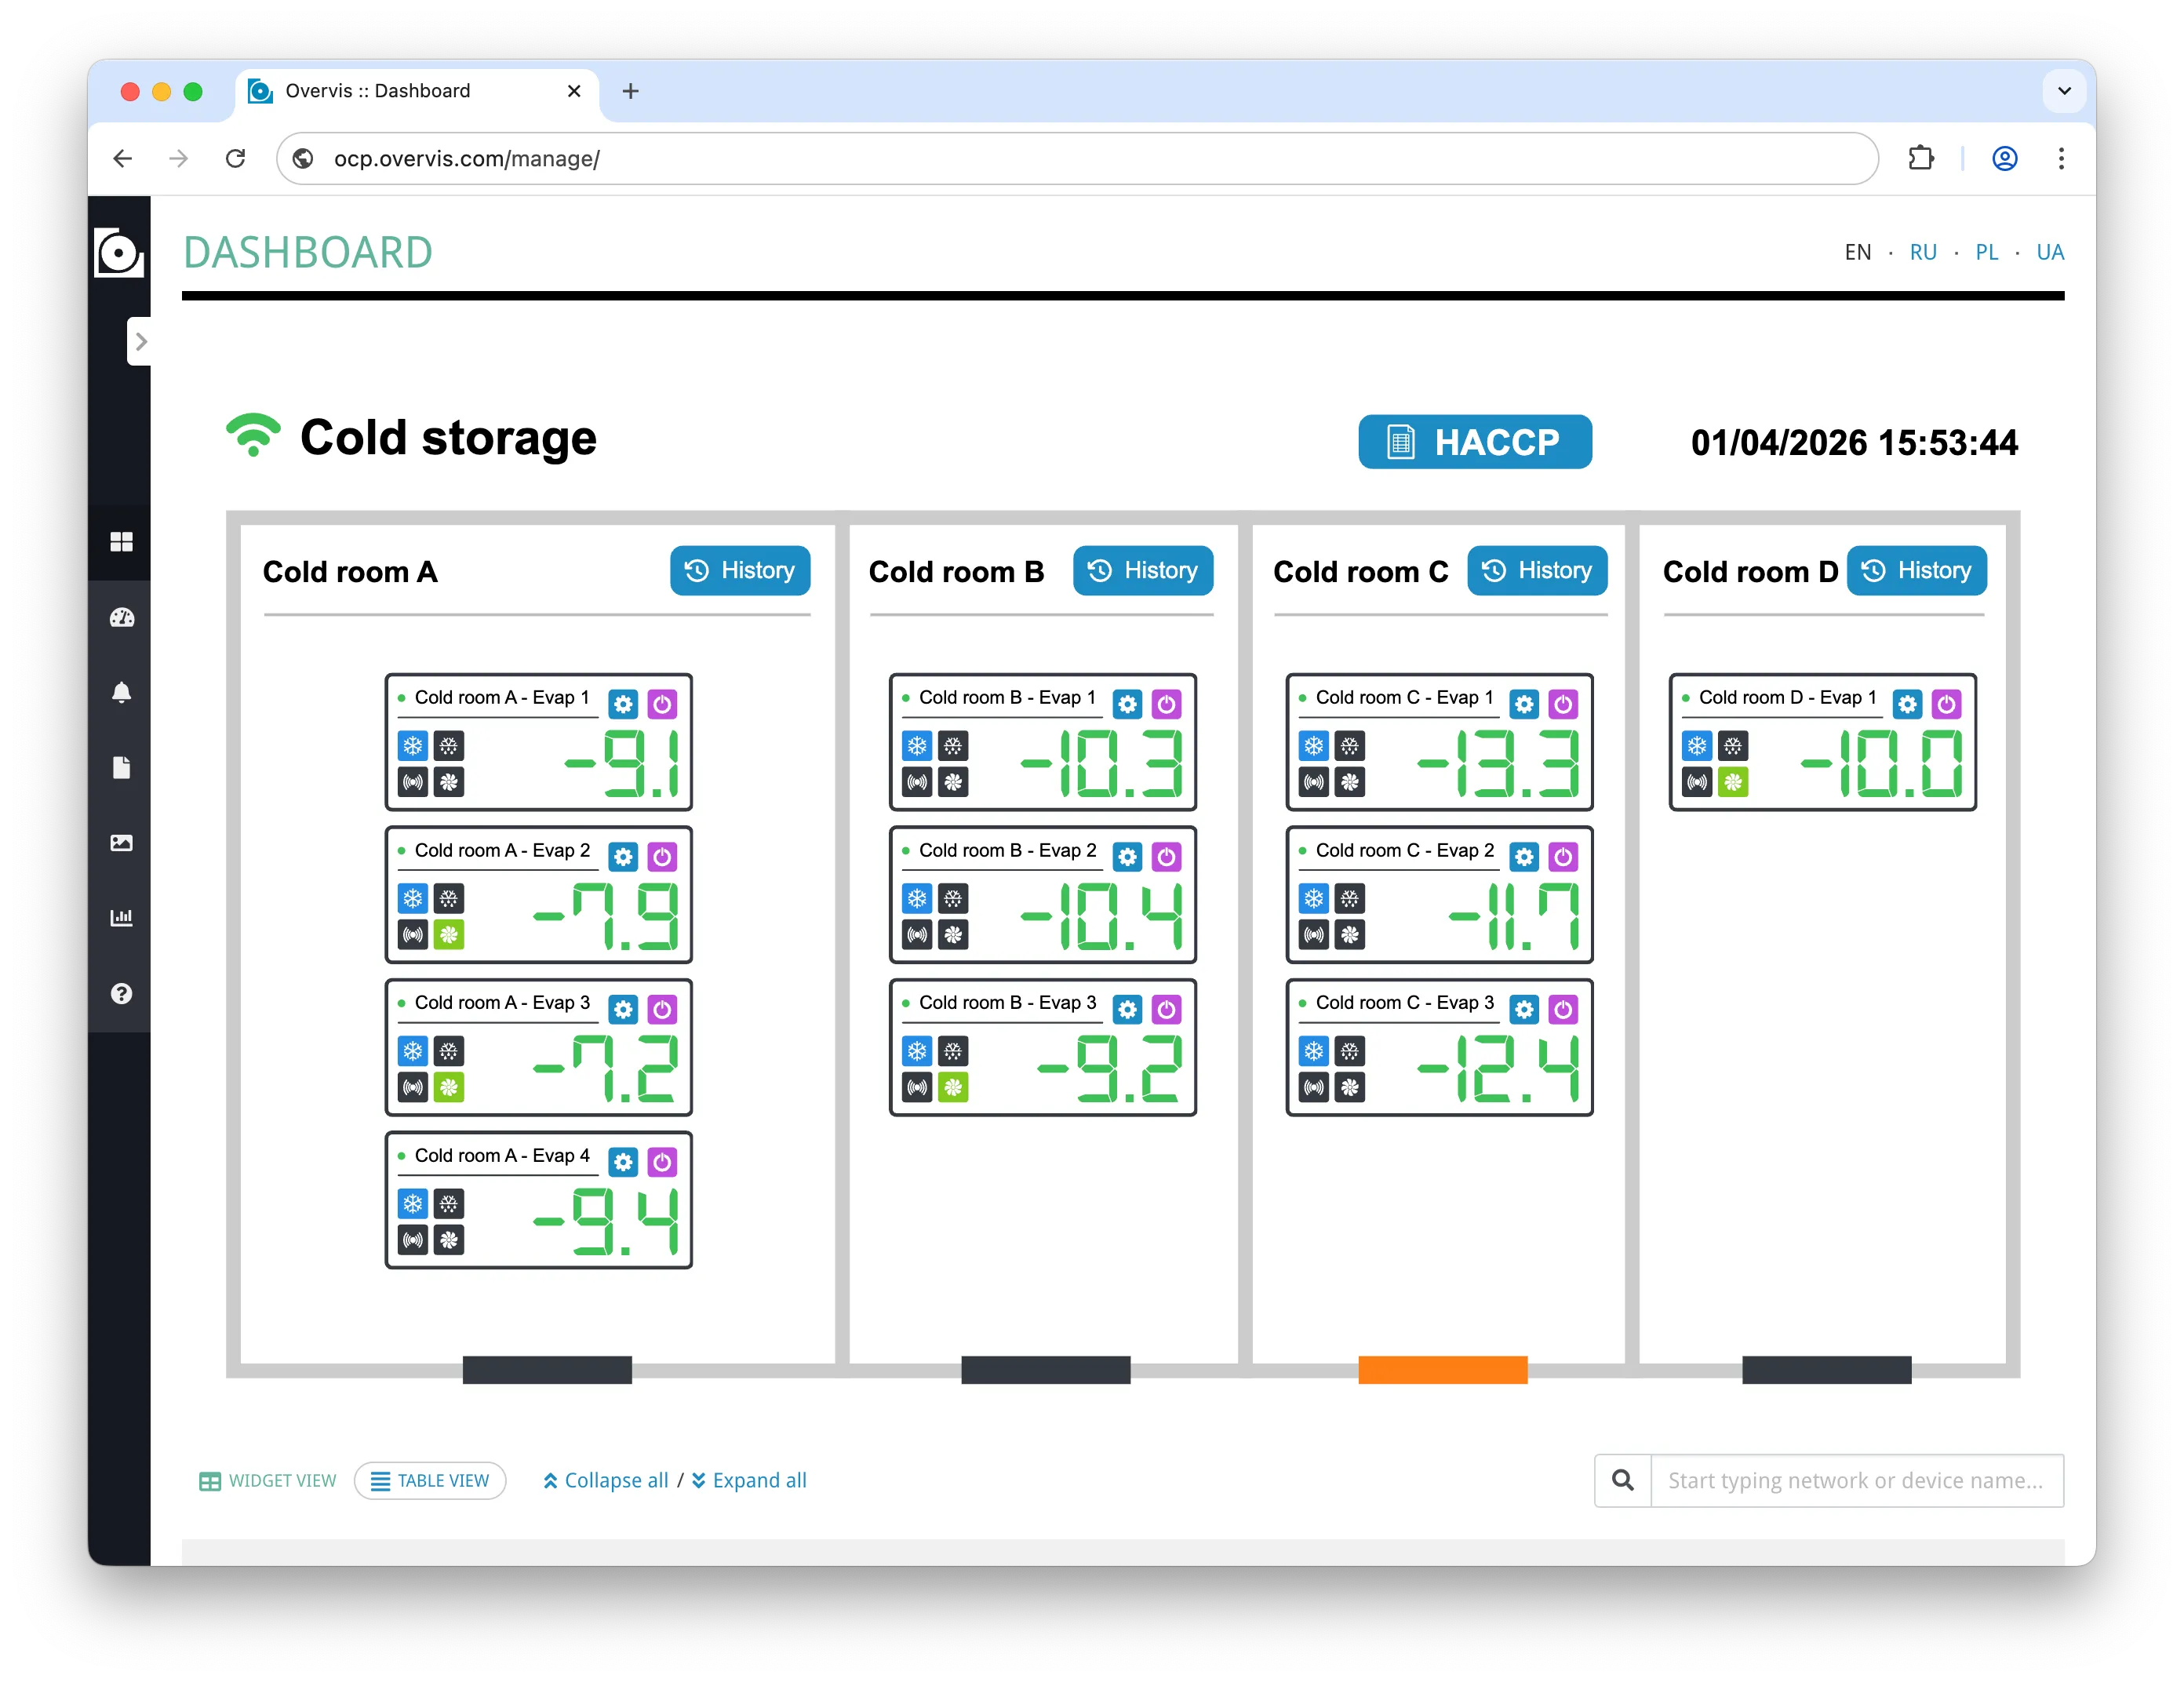
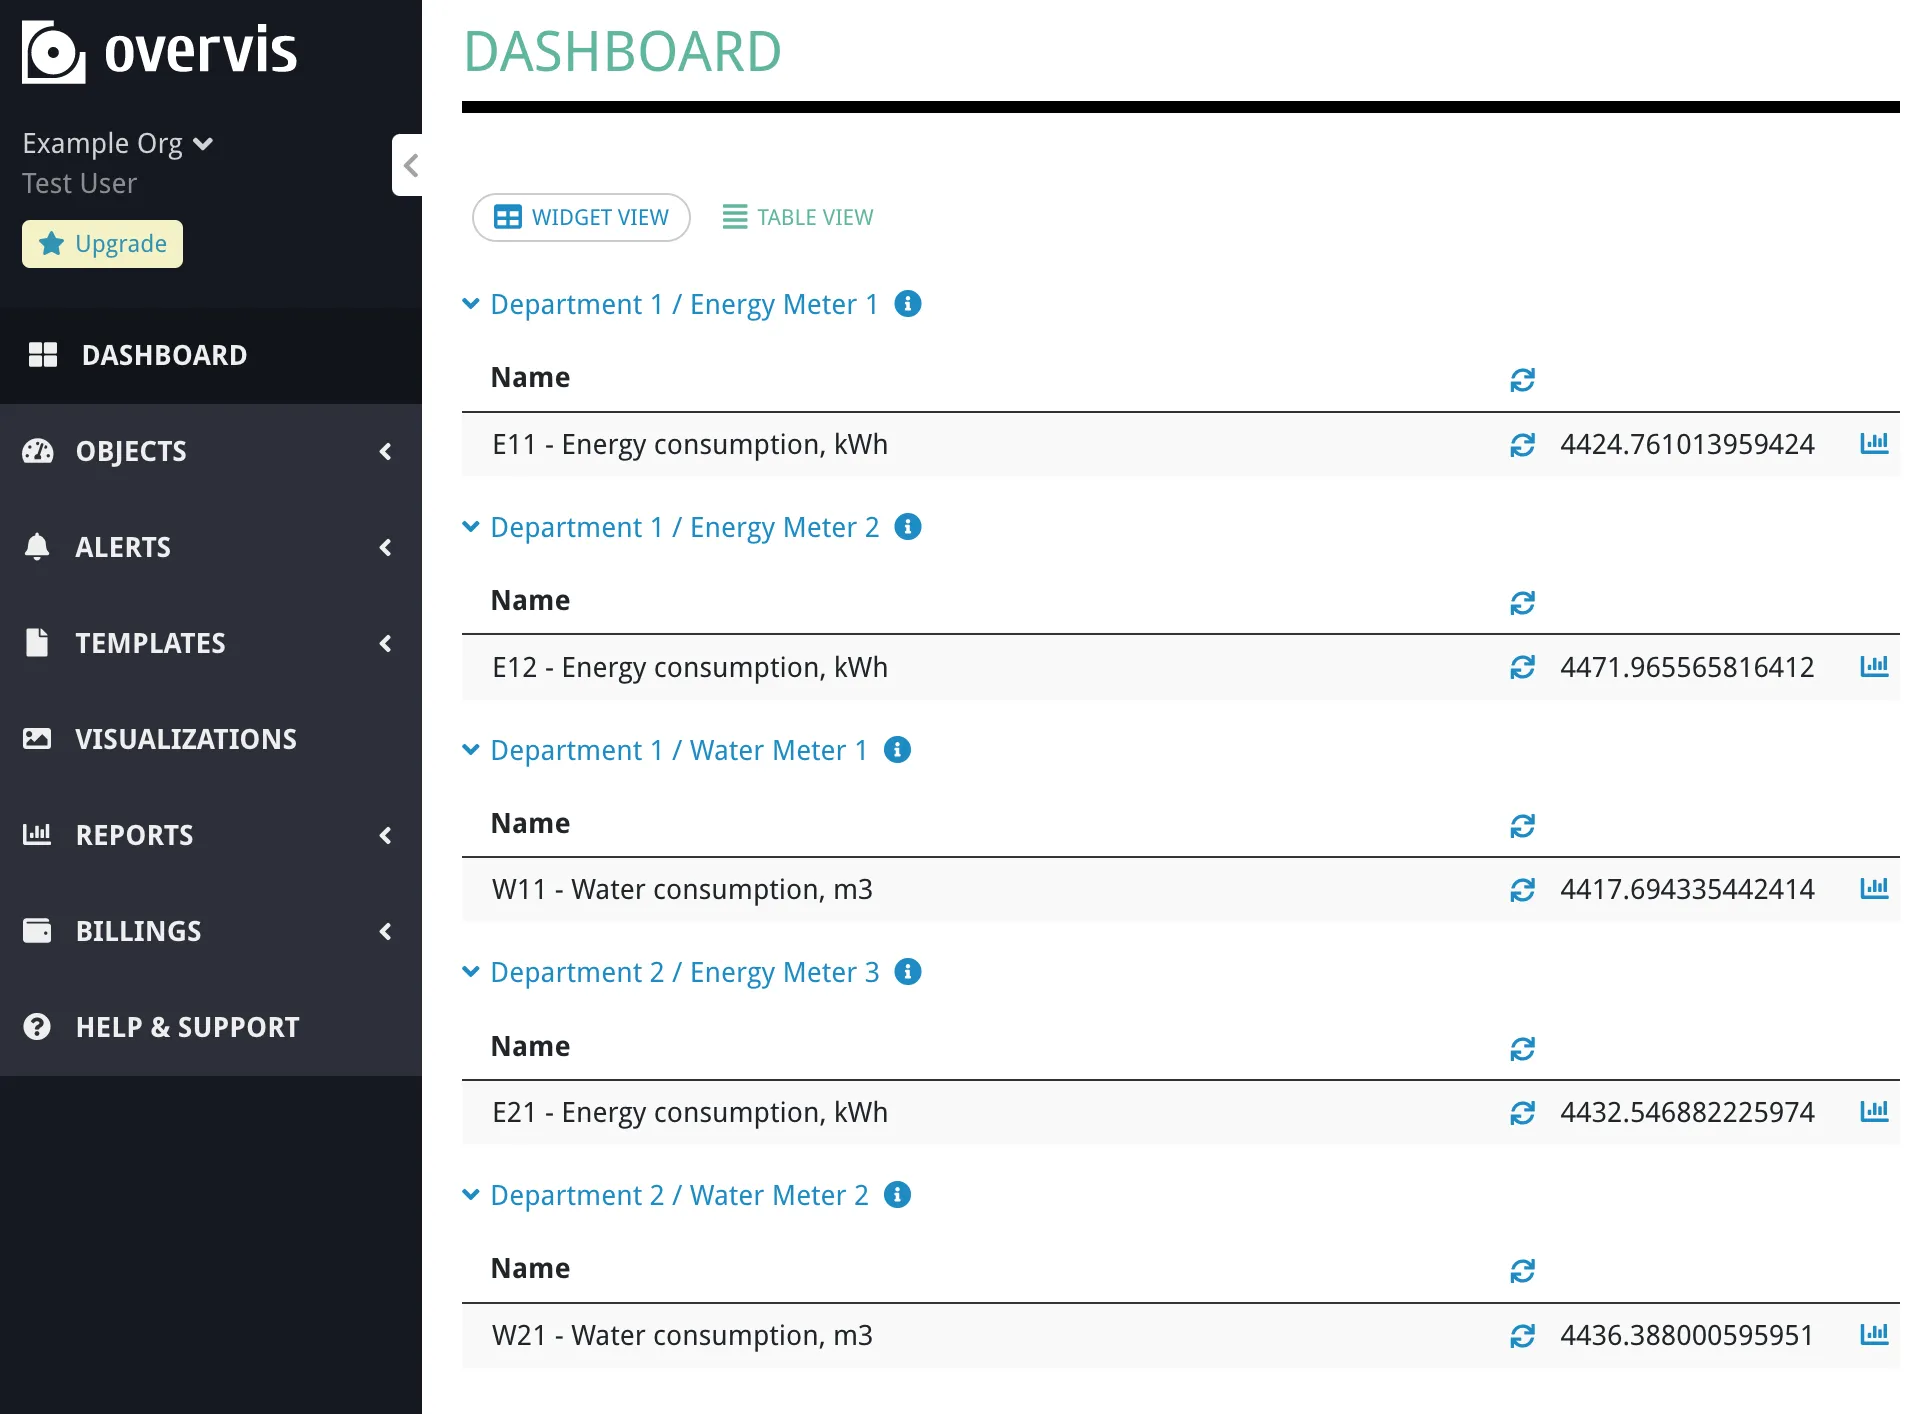
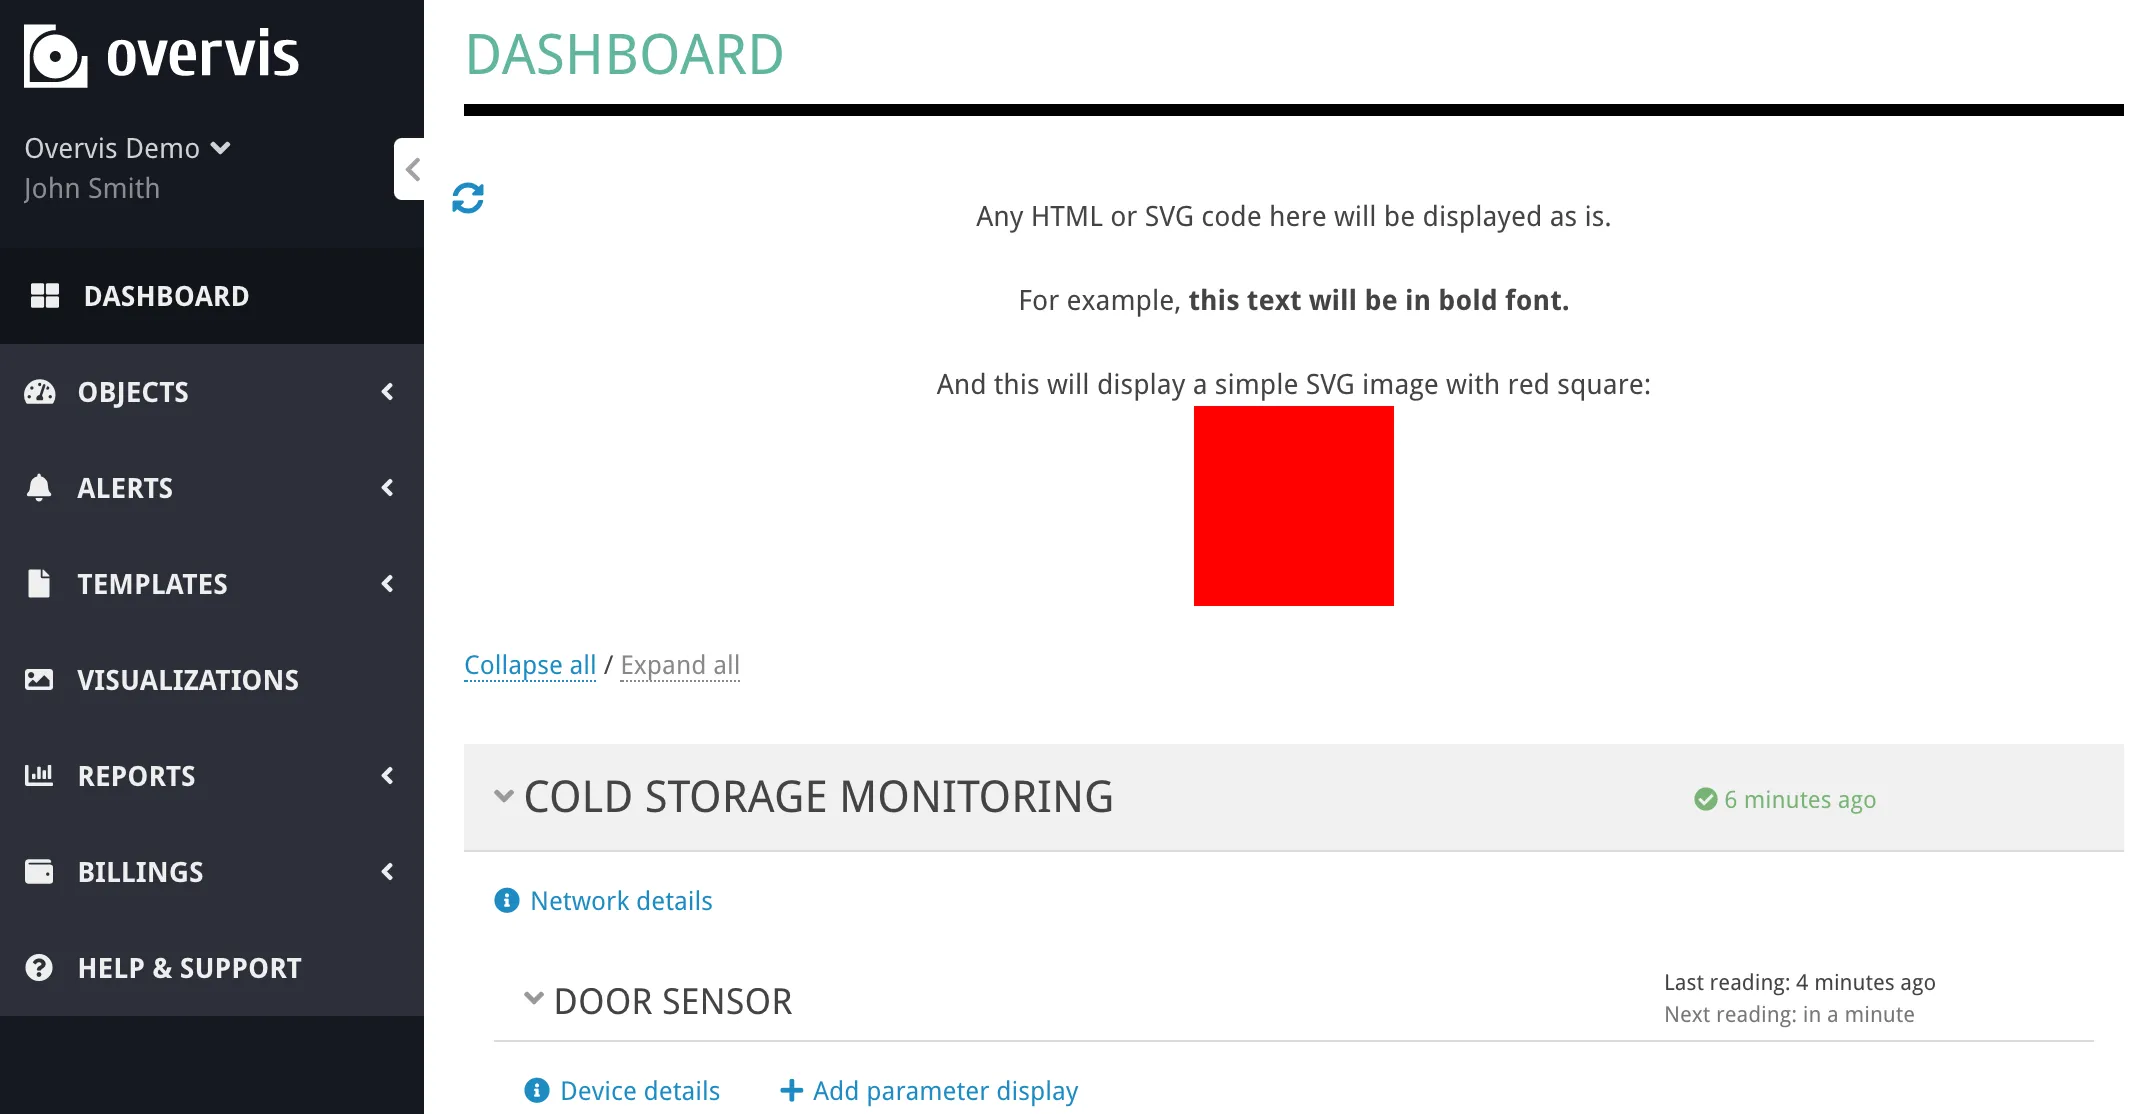
DashboardThe Dashboard is the organization-level overview page in Overvis Cloud. It brings together the most important parameters from all your networks and devices into a single screen, so you can monitor live values, check connection status, see active alerts, and write values to programmable parameters — all without navigating to individual device pages.
The dashboard shows two kinds of content:
The parameter widget set is shared across the organization — all users in the same organization see the same parameters on the dashboard. There are no per-user layouts, custom arrangements, or multiple dashboards per organization. Manage and Monitoring ModesSection titled “Manage and Monitoring Modes”Overvis provides the dashboard in two modes:
Both modes show the same organization-wide parameter widgets and visualizations. Users who open the manage dashboard without management permissions are redirected to the monitoring dashboard automatically. The dashboard offers two layout options, toggled with the Widget view / Table view buttons at the top of the page. The selected view is remembered in the browser. When the dashboard has more than three devices (across all networks), Collapse all / Expand all buttons appear next to the view toggle, allowing you to expand or collapse all network and device panels at once. Widget ViewSection titled “Widget View”Widget view is the default layout. The page is organized as expandable panels grouped by network and device.
Network panels — each network appears as a collapsible section showing:
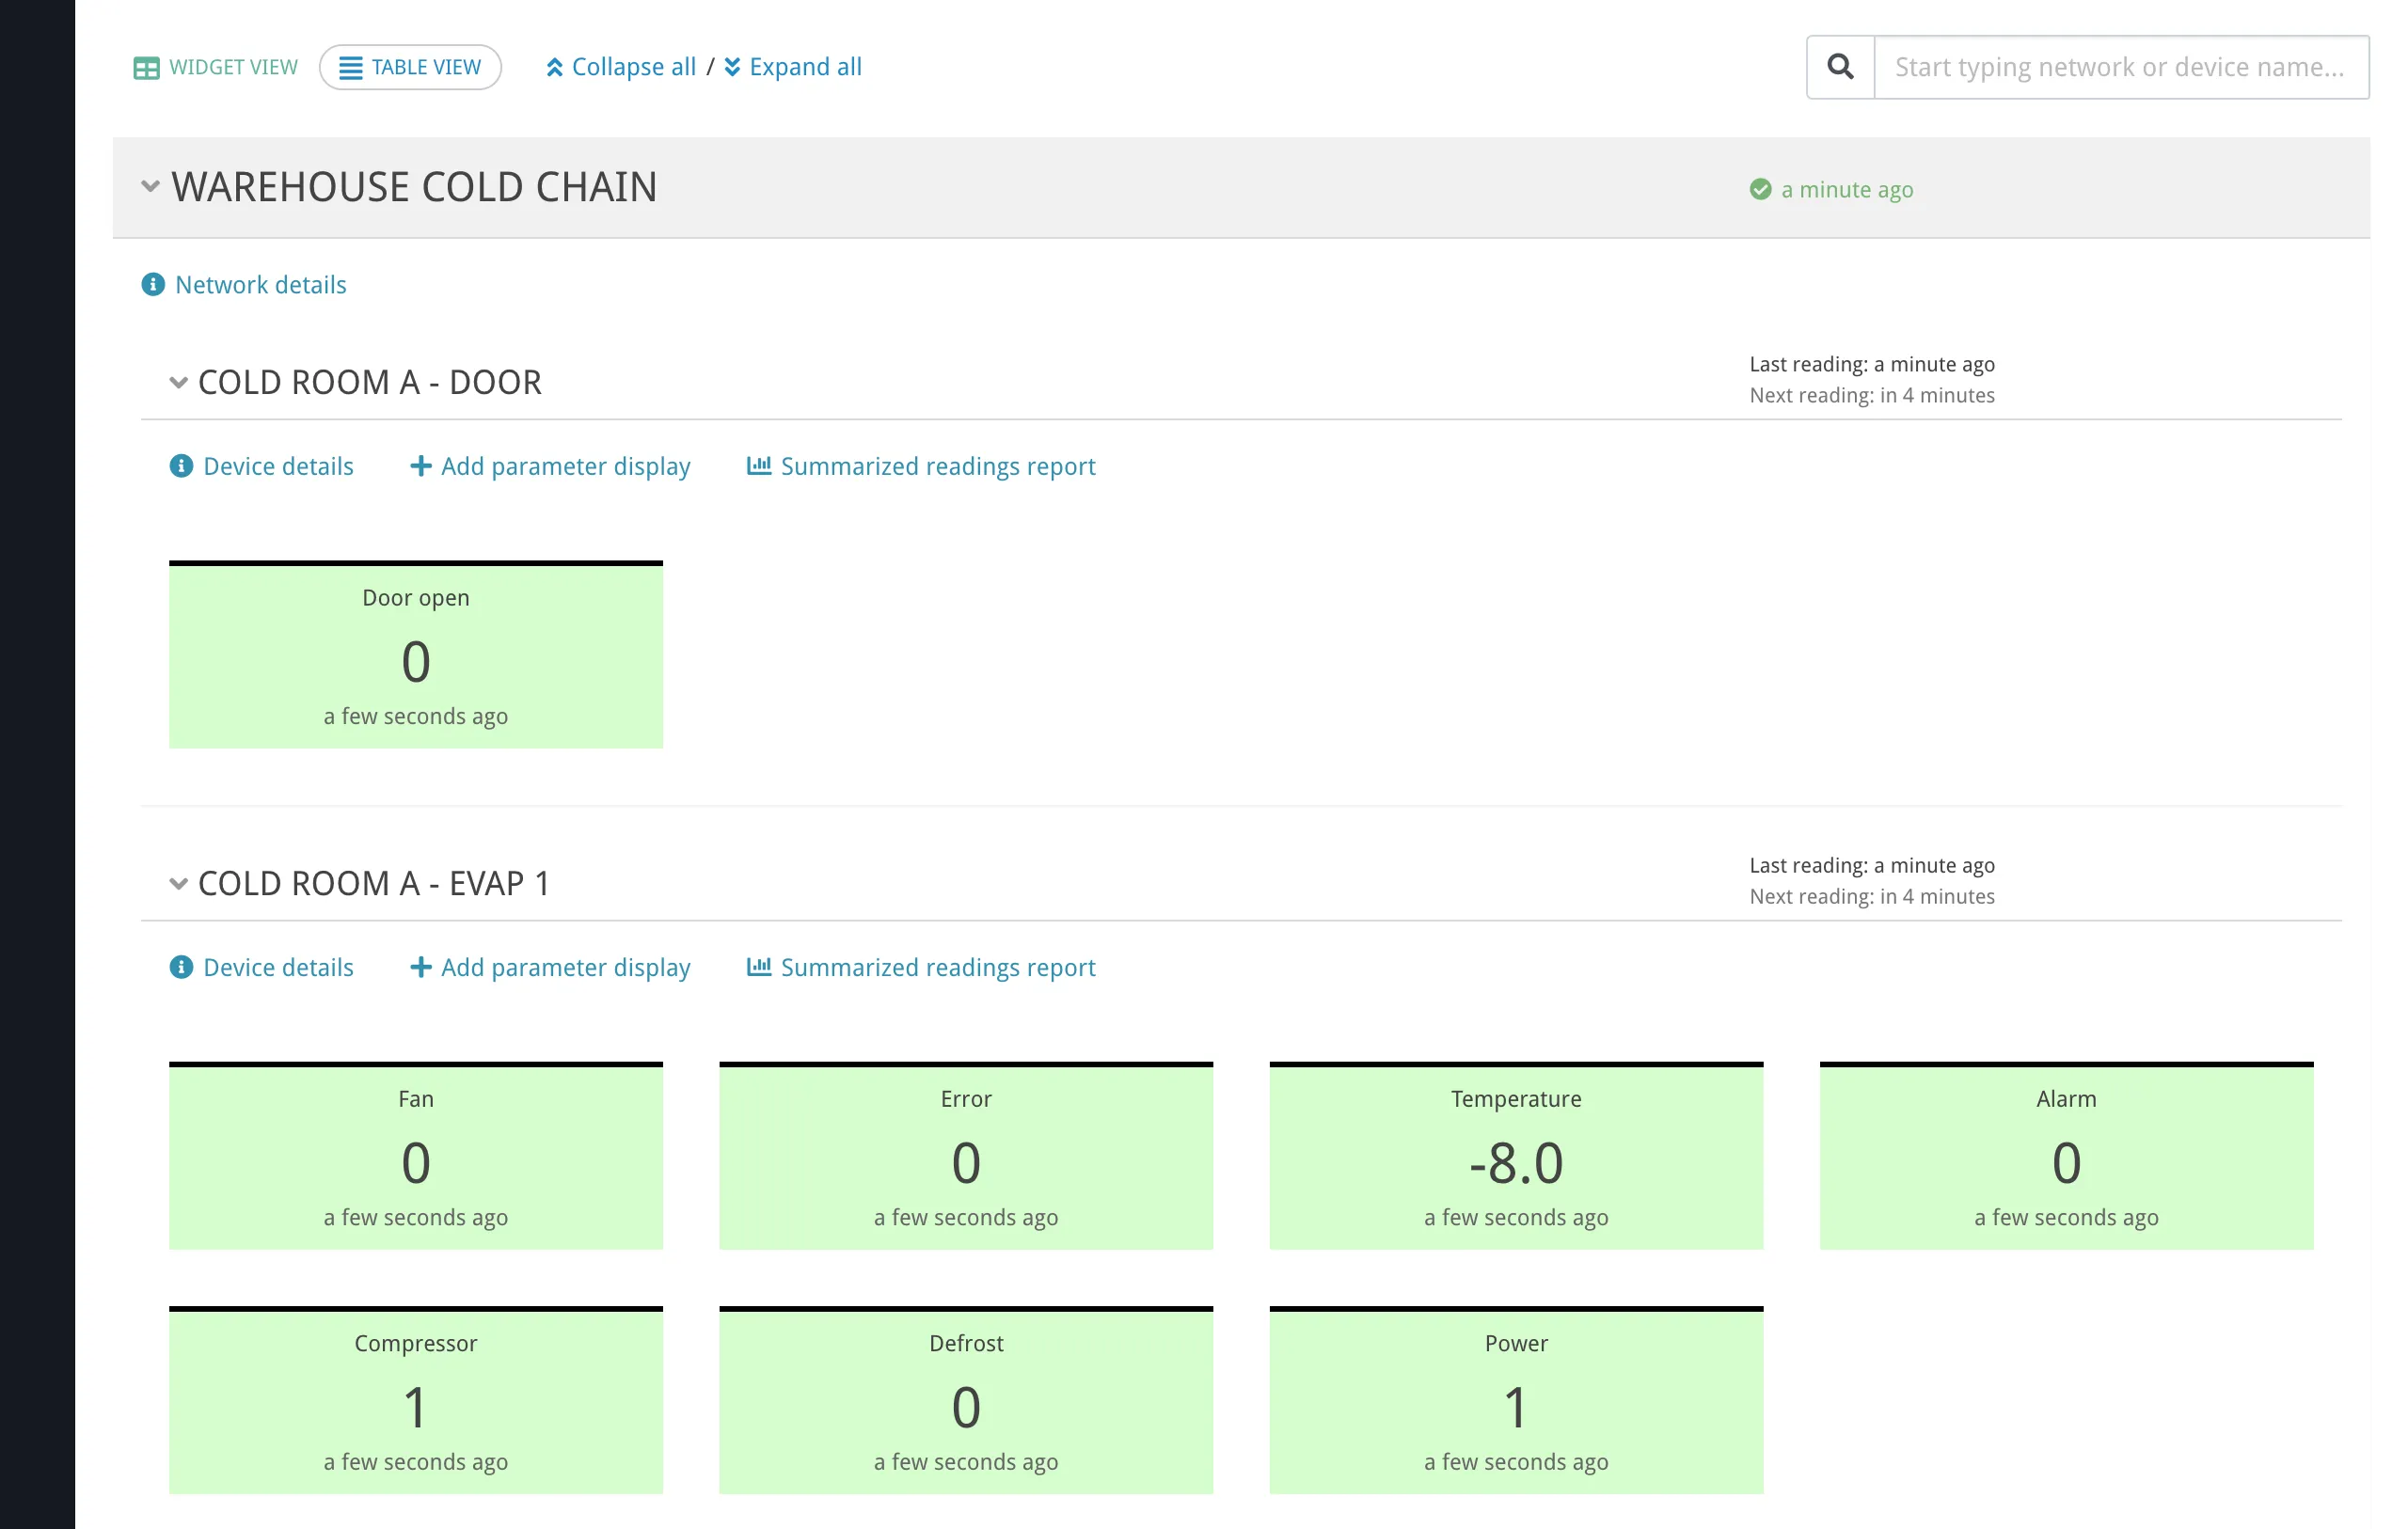
Device panels — inside each network, each device with dashboard parameters appears as a collapsible card showing:
Parameter widgets — inside each device panel, each parameter shows:
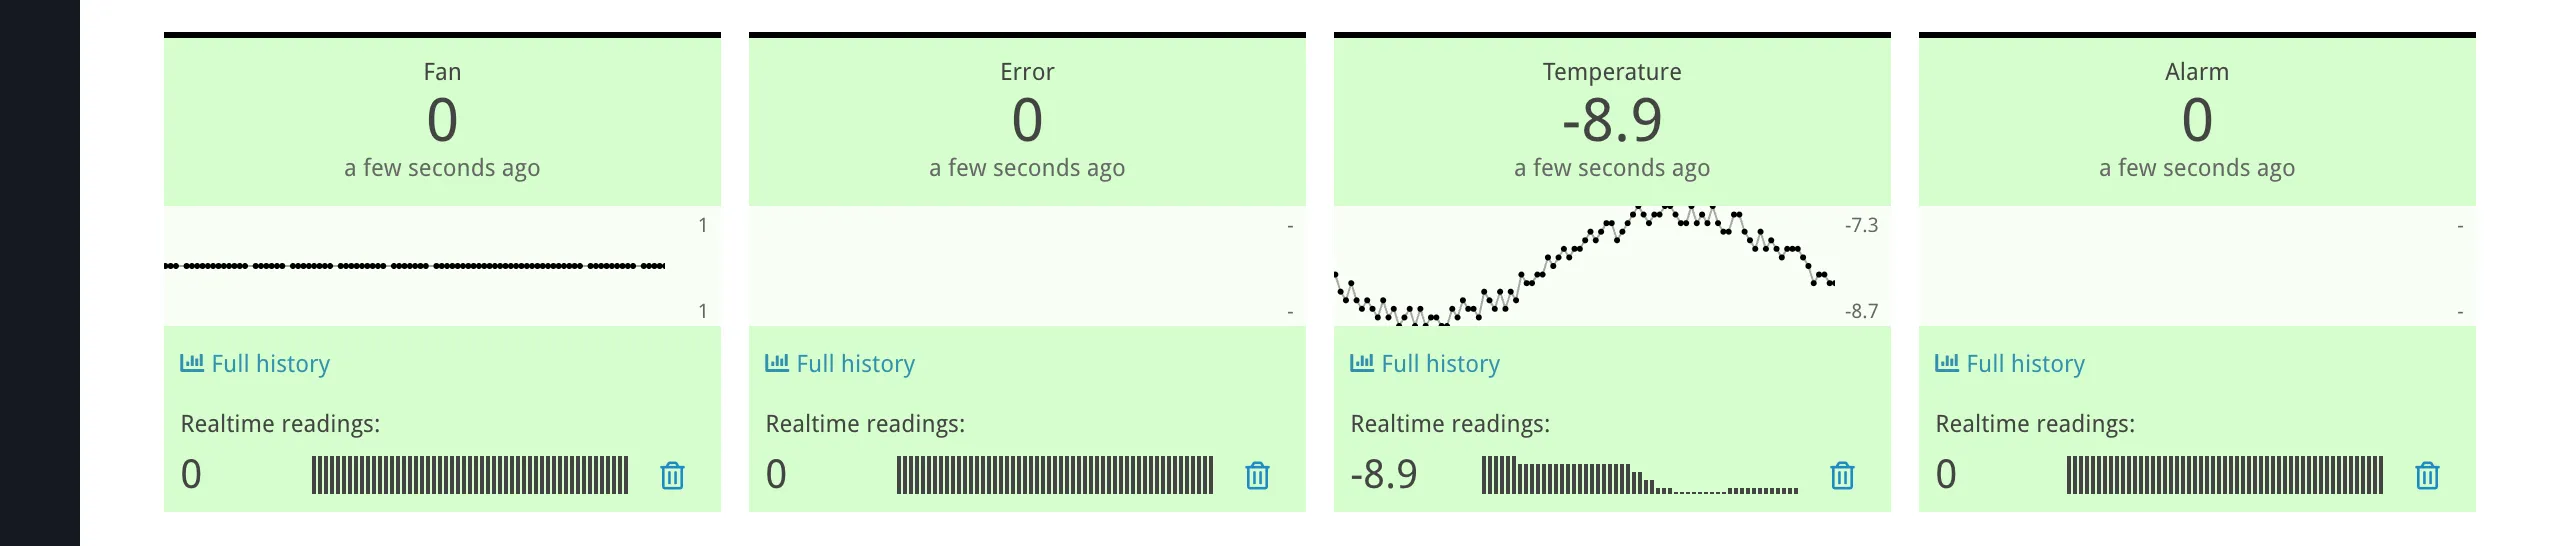
Expanding a parameter widget. Clicking a parameter widget expands it to show:
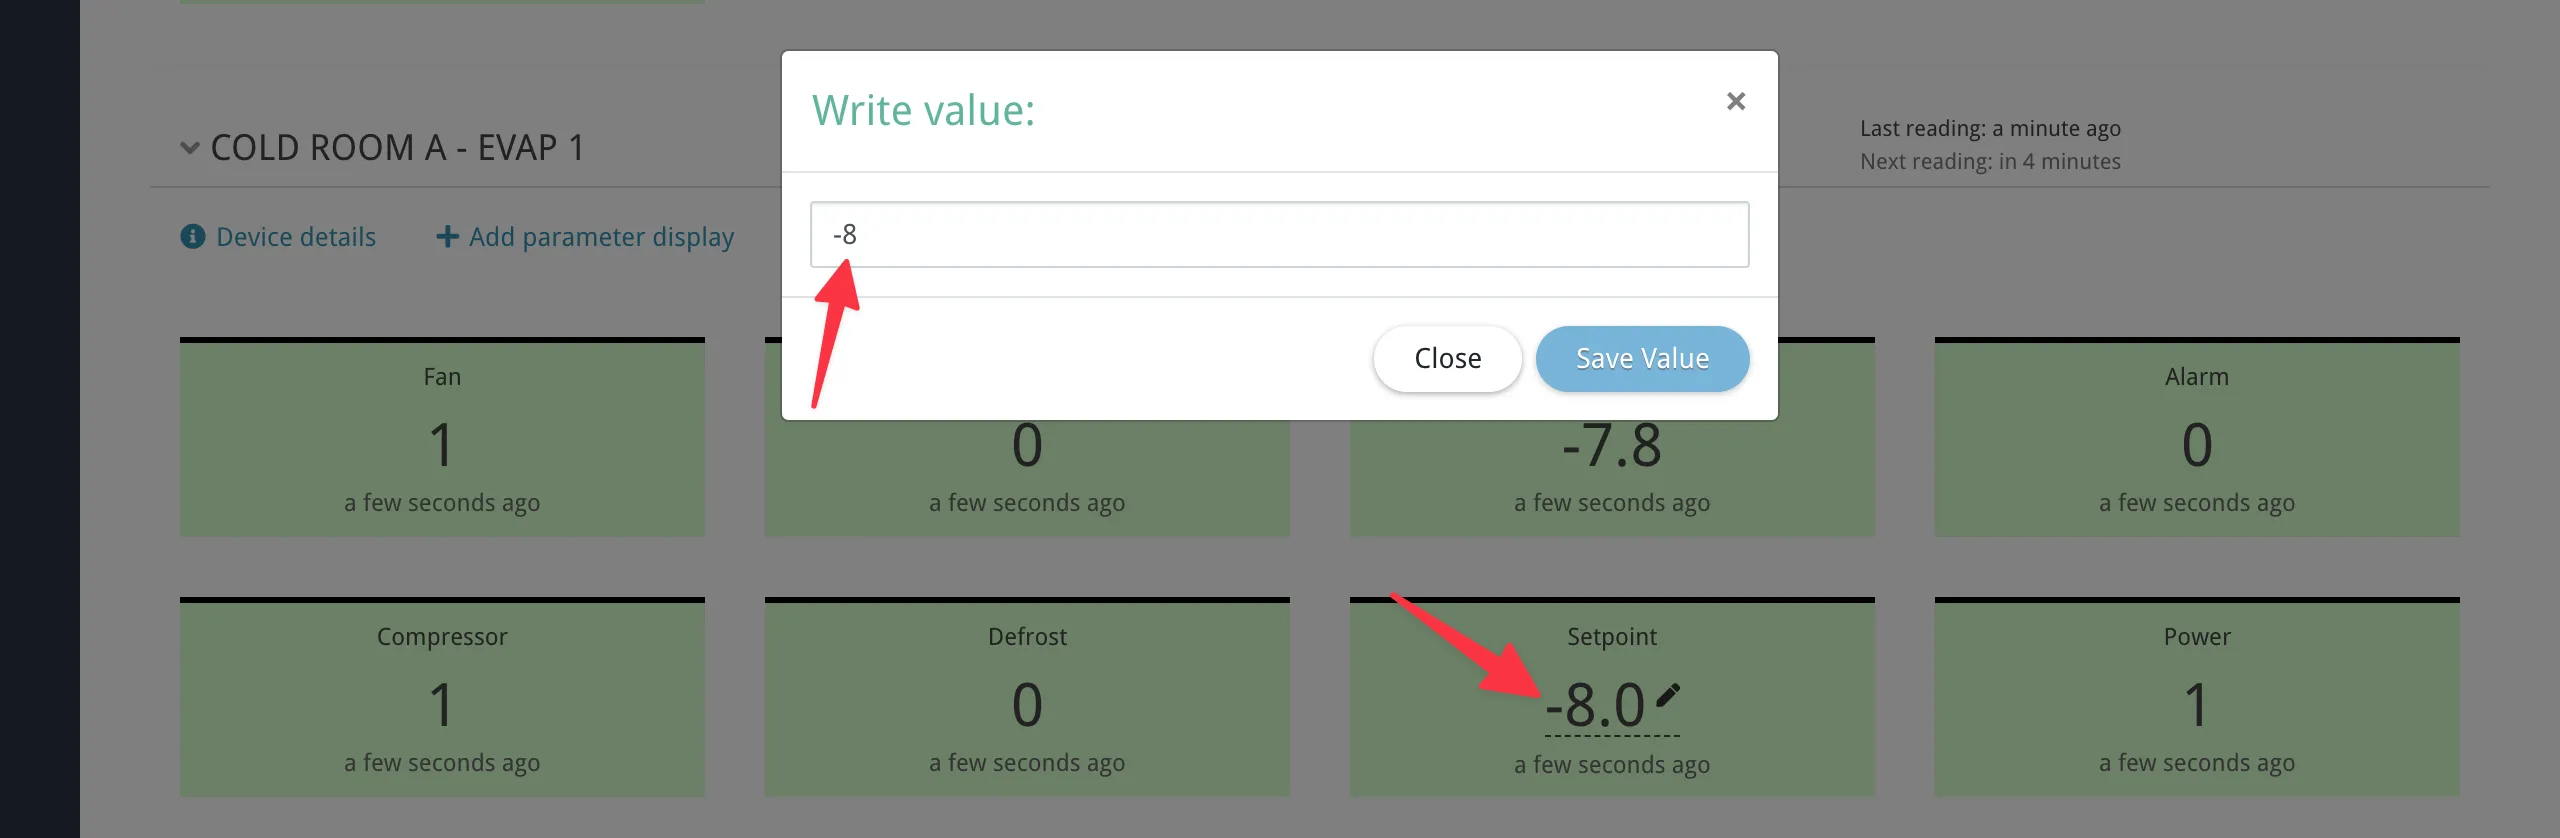
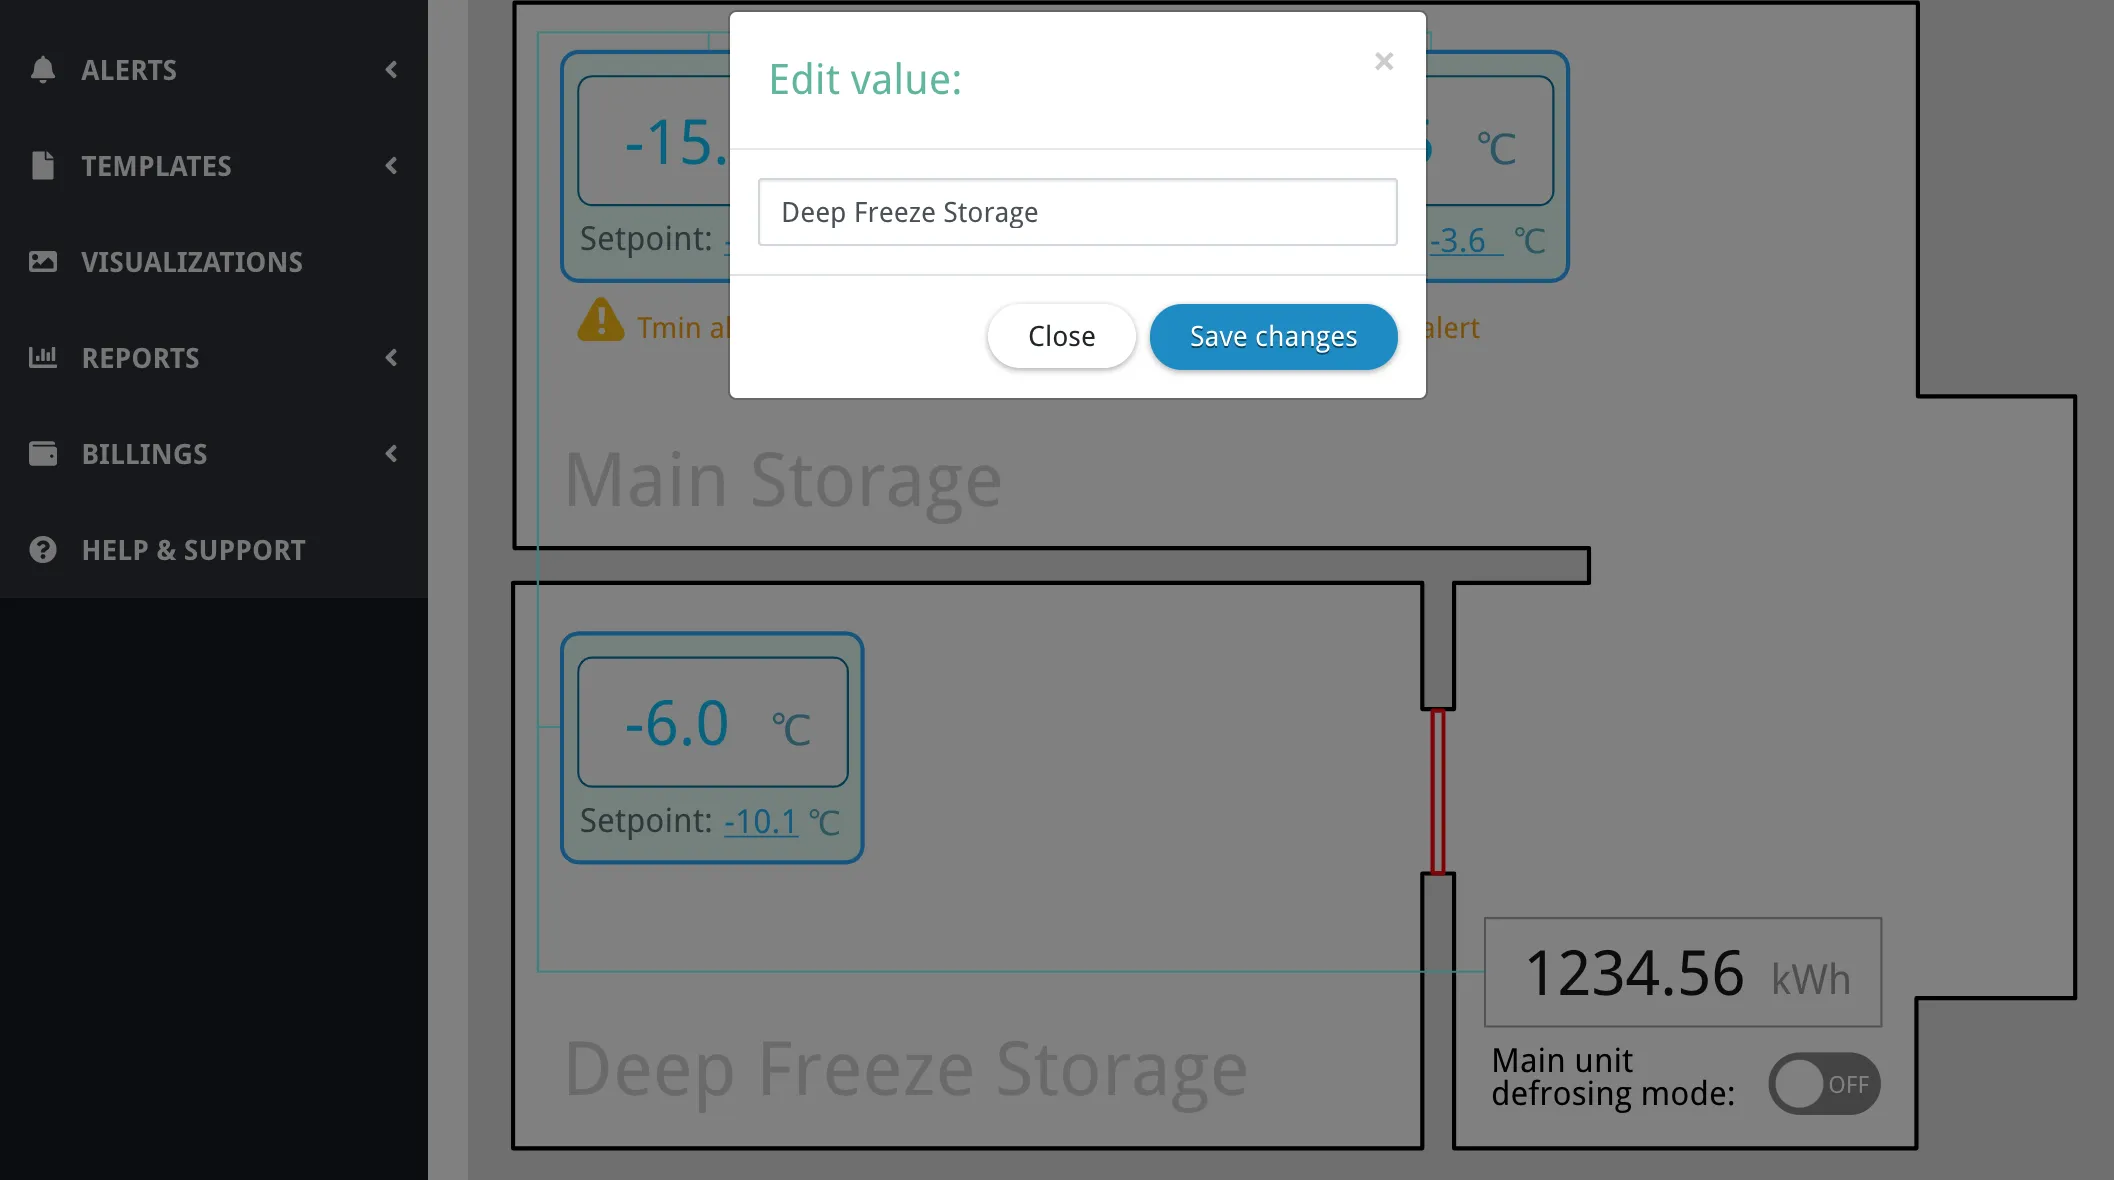
Realtime readings only work while the parameter widget is expanded. Collapsing the widget stops the polling. If the device is disabled, the realtime section shows “Device is disabled” instead. Writing values. On the manage dashboard, clicking the value of a programmable parameter opens a write dialog where you can enter a new numeric value and send it to the device. Programmable parameters are indicated by a dashed underline and a pen icon on their value. Clicking the value opens the write modal; clicking elsewhere on the widget expands/collapses it.
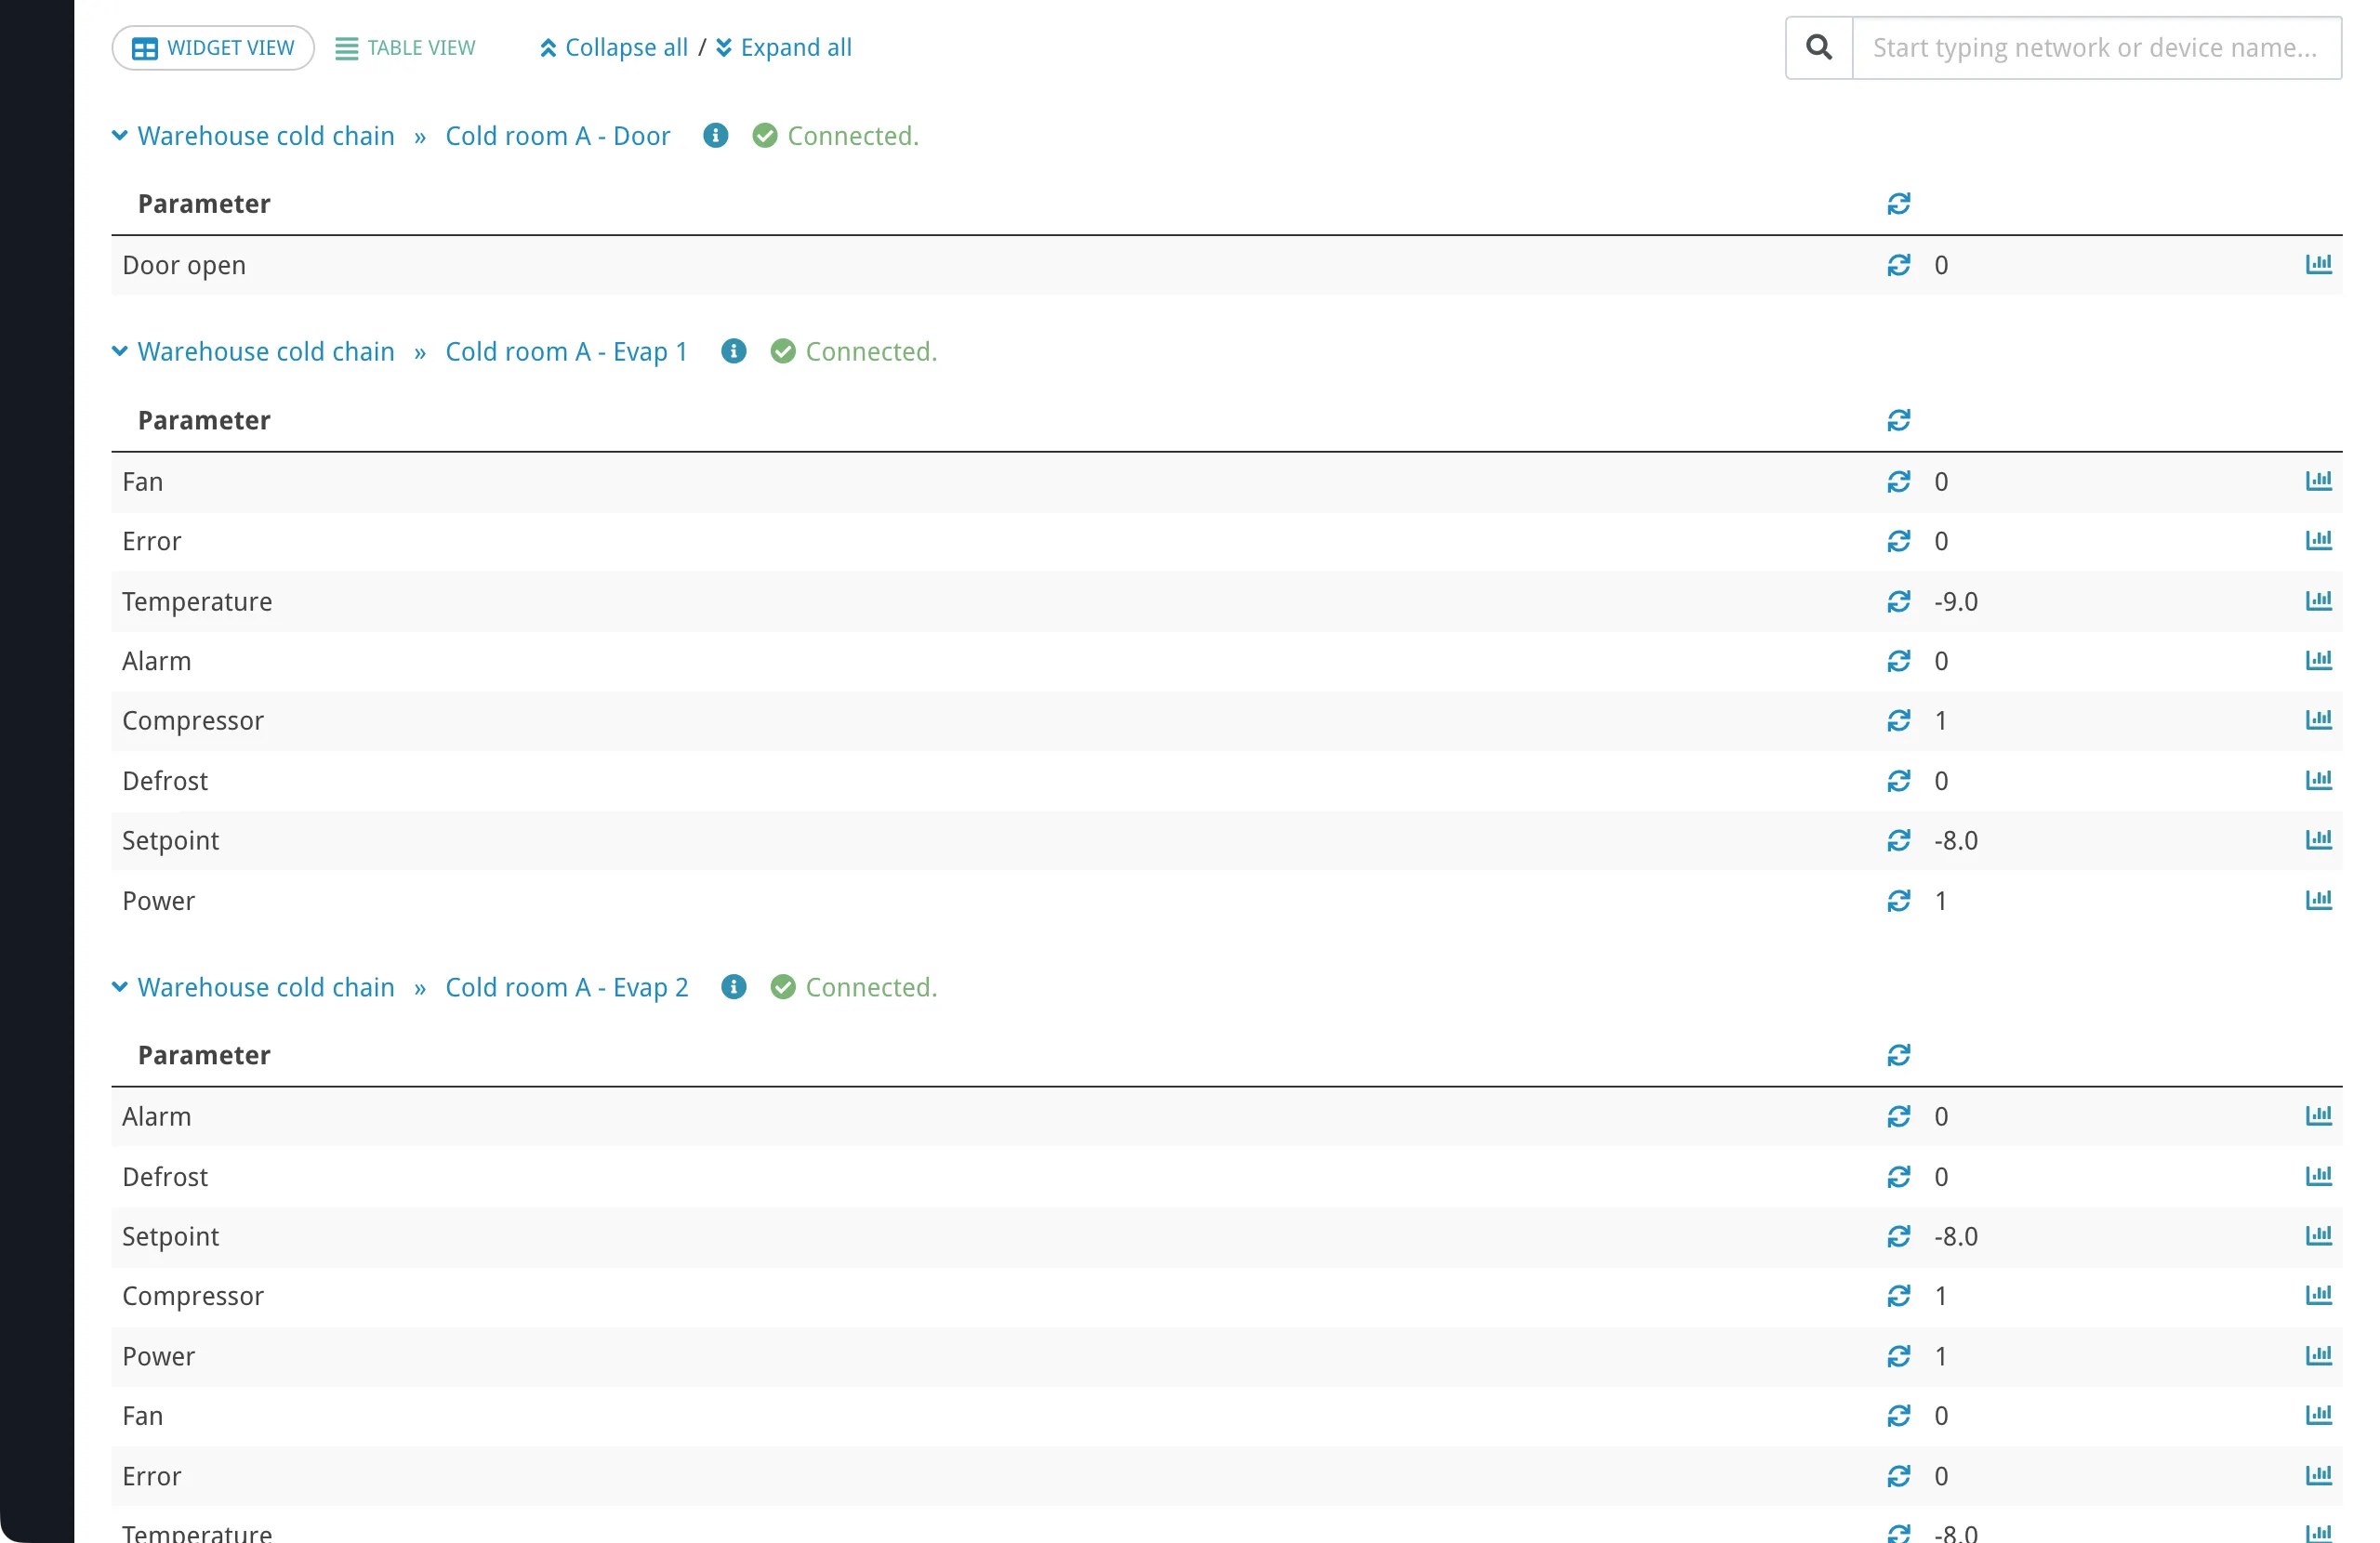
Table ViewSection titled “Table View”Table view shows the same parameter widgets in a compact tabular layout. Instead of nested network and device panels, devices are listed as flat rows: each row is labeled with that device’s network name and device name, separated by » (same pattern as in the interface). Expanding a device row shows a table with the columns listed below. In the UI, the header row shows Parameter as text; the next header cell is a sync icon only; the third and fourth header cells have no text labels.
The sync icon in the device header row toggles realtime reading for all displayed parameters on that device at once.
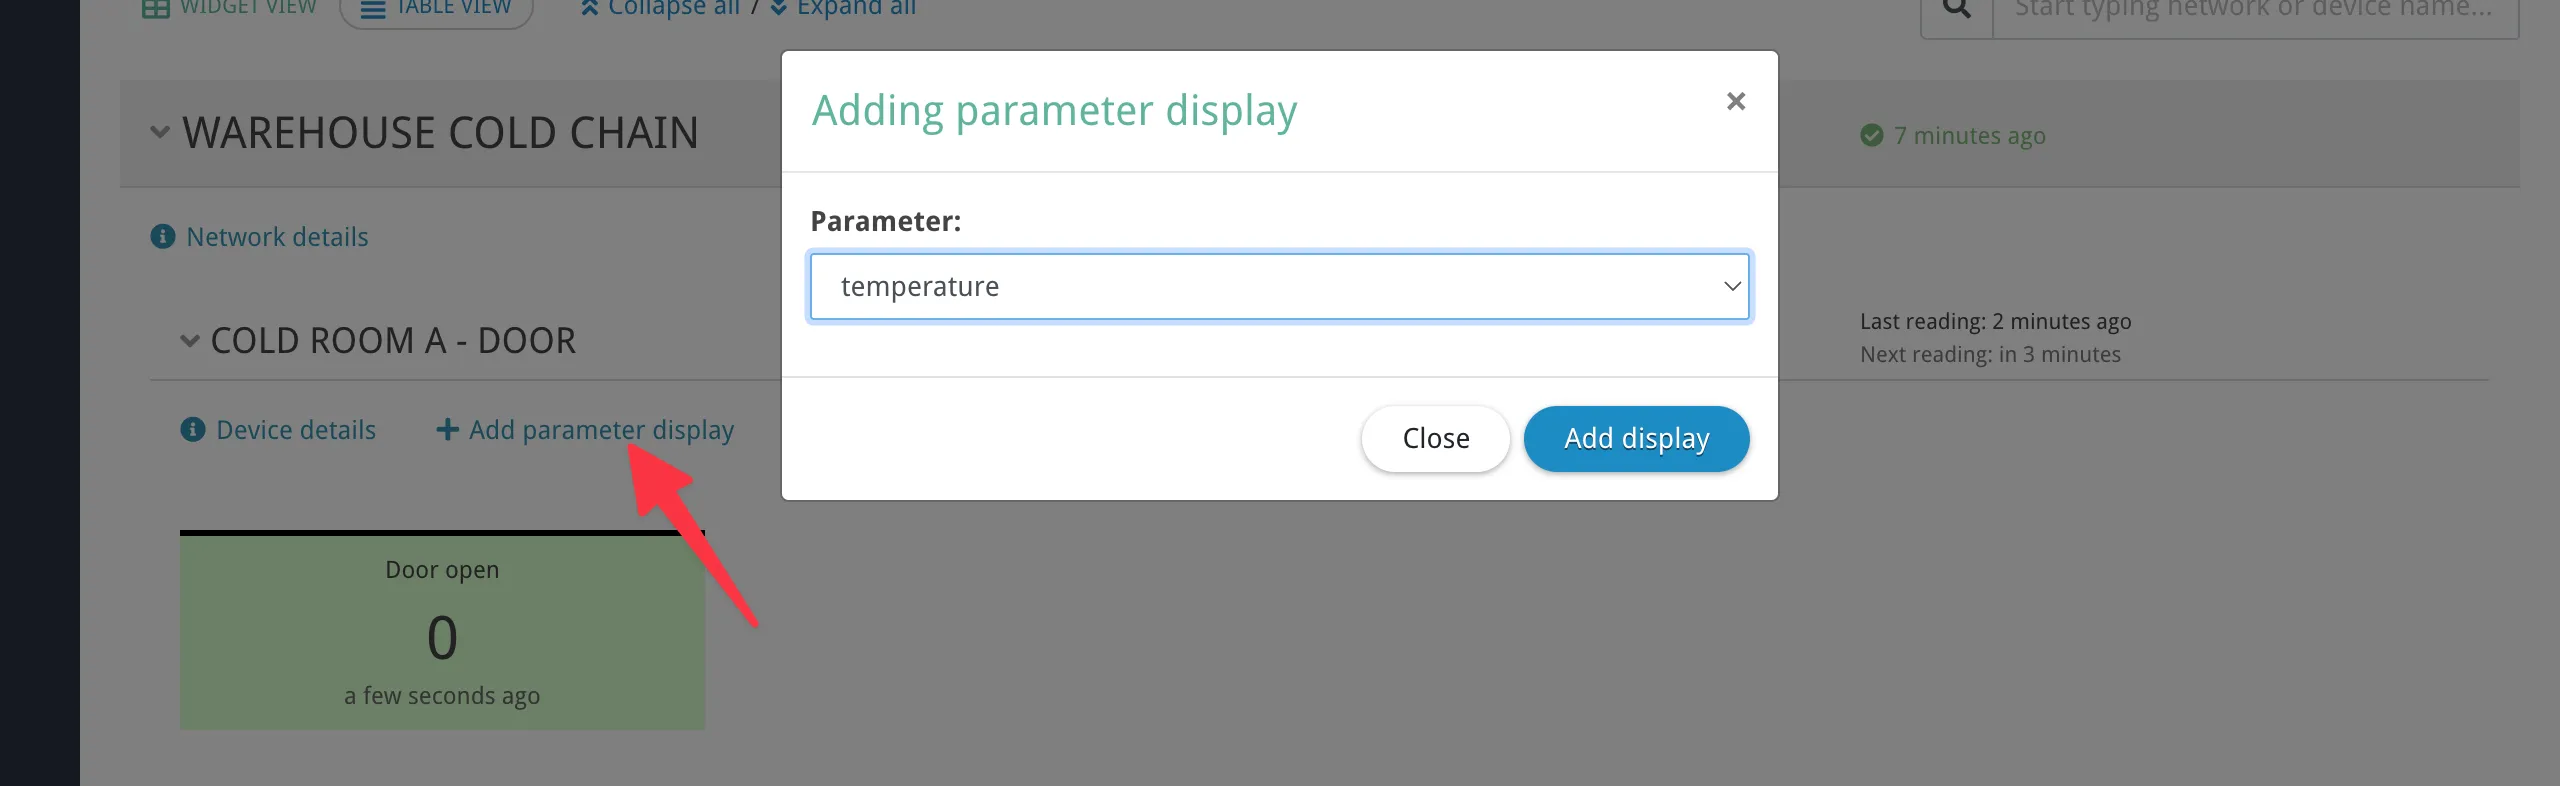
Table view does not provide write or remove controls. Use it for monitoring screens where you need to see many parameters at a glance. Adding Parameters to the DashboardSection titled “Adding Parameters to the Dashboard”There are two ways to add parameters to the dashboard. From the Manage DashboardSection titled “From the Manage Dashboard”Each device panel in widget view has an Add parameter display button (visible in manage mode only). Clicking it opens a modal that lists the device’s tracked parameters, grouped by category. Parameters already on the dashboard are excluded from the list.
This method only offers parameters that are already marked as tracked. If the parameter you want is not listed, add it from the device page instead (see below). From the Device PageSection titled “From the Device Page”On the device details page, select one or more parameters using the checkboxes and click Add to dashboard. This method is more flexible:
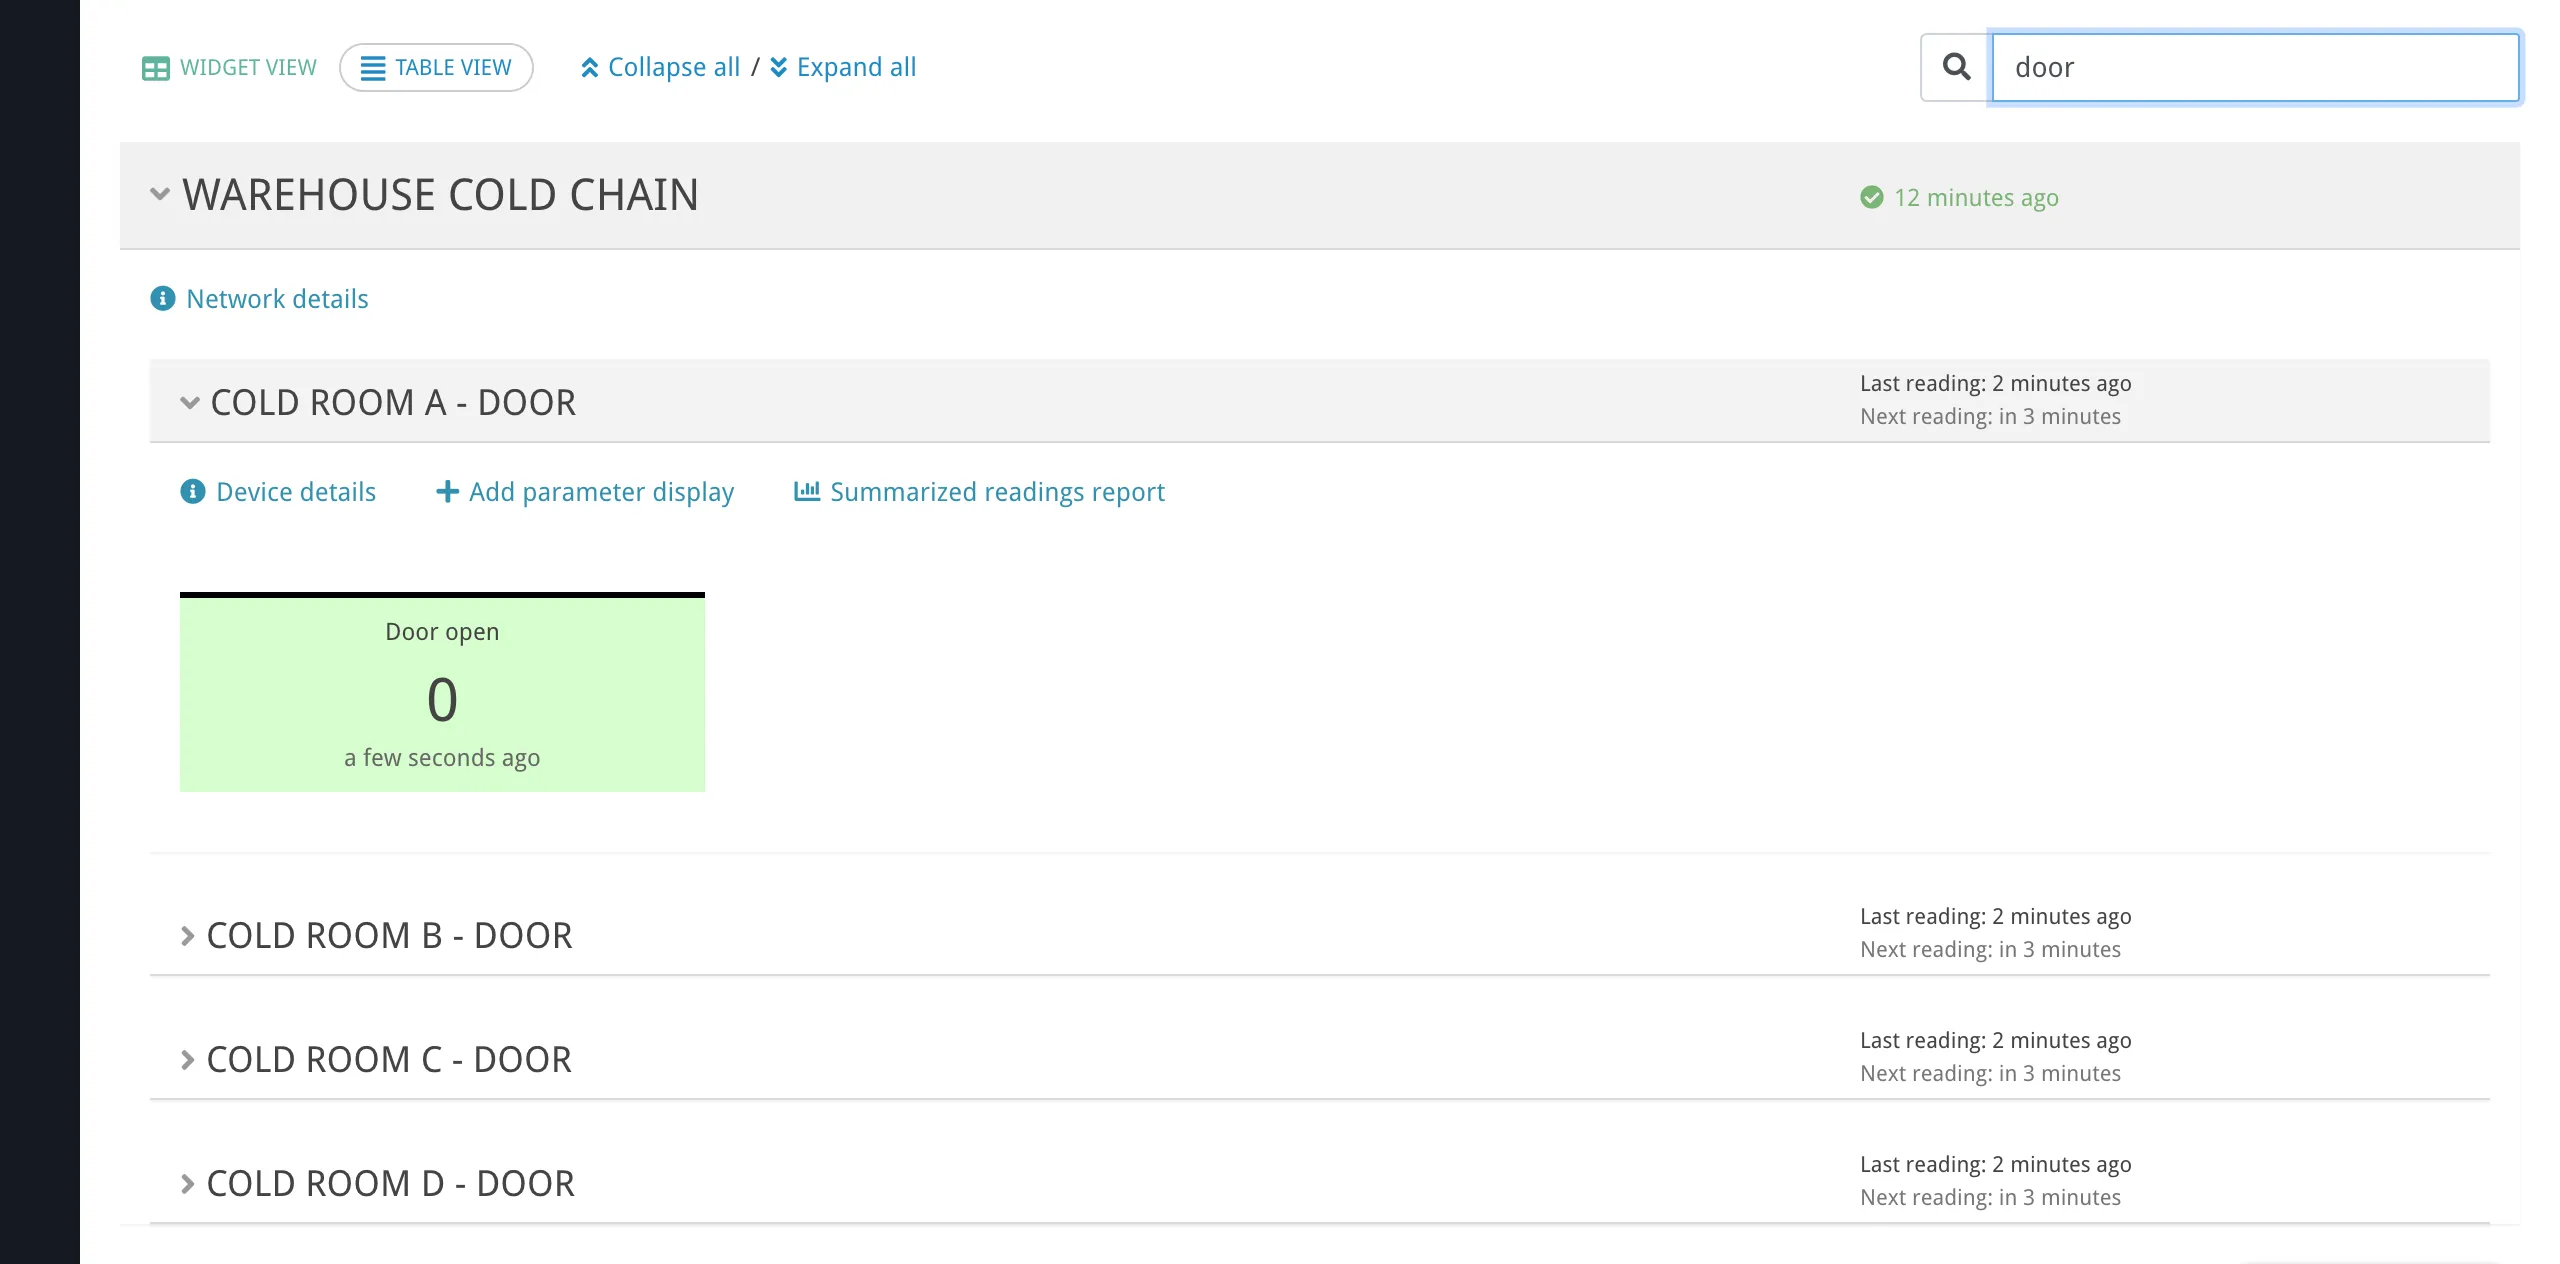
Removing ParametersSection titled “Removing Parameters”On the manage dashboard in widget view, each parameter widget has a remove button (trash icon) to unpin it from the dashboard. Removing a parameter widget does not delete the parameter itself or its historical data — it only removes it from the dashboard view. If a parameter is deleted from the device configuration, its dashboard widget disappears automatically. SearchSection titled “Search”The search field at the top of the dashboard filters by network name and device name. It does not search parameter names. When you type multiple words, Overvis matches devices whose combined network and device name contains all the words (in any order). For example, typing “warehouse temperature” matches a device named “Temperature Controller” in a network named “Warehouse”.
Auto-RefreshSection titled “Auto-Refresh”The dashboard keeps data current through automatic updates:
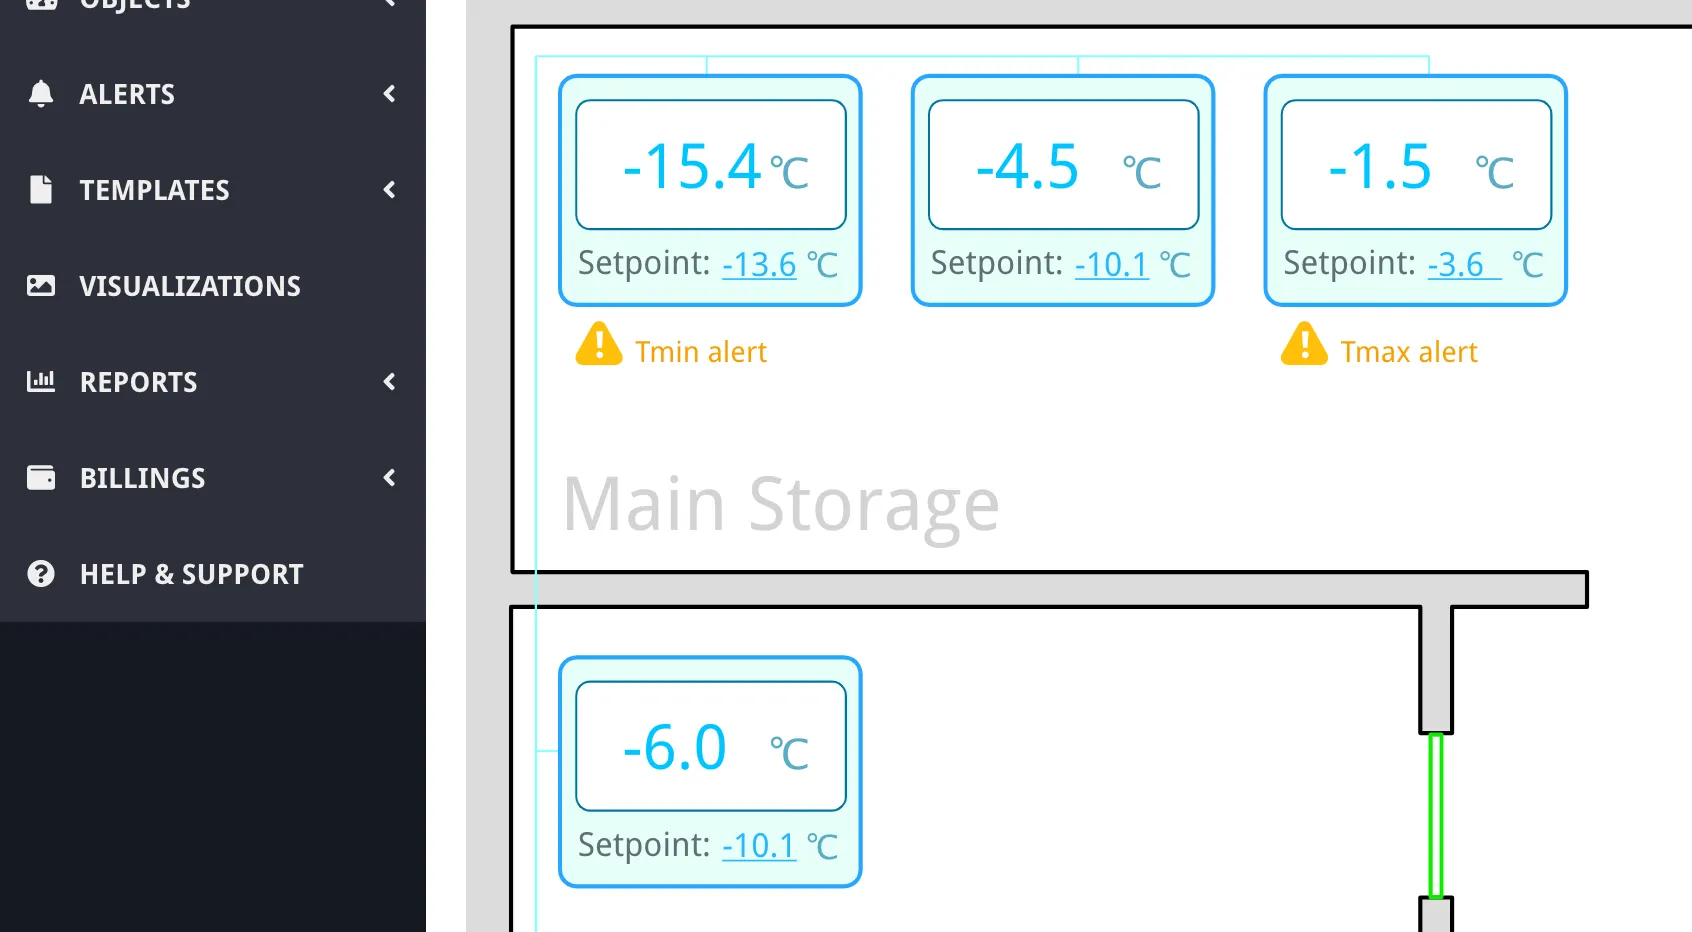
Alerts on the DashboardSection titled “Alerts on the Dashboard”The dashboard reflects active alert state at every level of the hierarchy:
For details on configuring alerts, see Alerts. Disabled Networks and DevicesSection titled “Disabled Networks and Devices”Disabled networks and devices remain visible on the dashboard, but their behavior changes:
Disabling does not remove parameter widgets from the dashboard. When the network or device is re-enabled, normal polling and display updates resume. For more on disabling, see Networks, Devices & Parameters — Disabling. State PersistenceSection titled “State Persistence”The dashboard remembers the following in the browser (per browser, not per user account):
Search queries and expanded parameter widgets are not persisted — they reset when the page is reloaded. TroubleshootingSection titled “Troubleshooting”Parameter not appearing on the dashboard after adding itSection titled “Parameter not appearing on the dashboard after adding it”If a parameter does not show up after you add it, reload the page — the dashboard loads its full structure once on page load and may not reflect changes made in another tab. If the parameter still does not appear, check that it belongs to a device in the current organization and that the parameter has not been deleted. Values showing ”–” or not updatingSection titled “Values showing ”–” or not updating”A dash (”–”) instead of a value means Overvis has no recent reading for that parameter. Common reasons:
If values update on the device page but not on the dashboard, expand the network and device panels — collapsed panels are not polled for new values. Cannot write a value to a parameterSection titled “Cannot write a value to a parameter”The write dialog only appears under all of these conditions:
If the value still cannot be written, the device may be unreachable. Check the device status in the panel header. Search not finding a deviceSection titled “Search not finding a device”The search field only matches network names and device names — it does not search parameter names. If you are searching for a parameter by name, you need to find it by its device or network name instead. Multiple words are matched independently: all words must appear somewhere in the combined network name and device name (in any order). Realtime readings not appearingSection titled “Realtime readings not appearing”Realtime readings require expanding (clicking) an individual parameter widget. If you expand the widget and still see no realtime values:
In table view, use the sync toggle icon to start realtime readings for individual parameters or all parameters on a device. Common QuestionsSection titled “Common Questions”Can I create multiple dashboards or custom layouts?Section titled “Can I create multiple dashboards or custom layouts?”No. Each organization has one dashboard with one shared set of parameter widgets. All users in the organization see the same parameters. The dashboard layout (grouping by network and device) is automatic and cannot be rearranged. Why do my expanded panels reset when I reload the page?Section titled “Why do my expanded panels reset when I reload the page?”The expand/collapse state of network and device panels is saved in your browser’s local storage — it persists across reloads. However, expanded parameter widgets (focused for realtime readings) and search queries reset on reload by design. If you notice panel state is lost, you may have cleared your browser data, or you are using a different browser/device. How do I see historical data for a parameter?Section titled “How do I see historical data for a parameter?”Expand a parameter widget in widget view to see a 24-hour sparkline (mini chart). Click the Full history link below the chart to open a detailed readings report. In table view, use the chart icon in the last column to go directly to the readings report. What is the difference between widget view and table view?Section titled “What is the difference between widget view and table view?”Widget view shows parameters as interactive cards with sparkline mini charts, realtime readings, write controls, and the ability to add/remove parameters. It is best for active monitoring and control. Table view shows parameters in a compact table with sync toggles for realtime values. It does not have write or add/remove controls. It is best for monitoring screens and situations where you need to see many parameters at once. Why does the dashboard show outdated values for some devices?Section titled “Why does the dashboard show outdated values for some devices?”The dashboard only refreshes values for expanded network and device panels. If a network or device panel is collapsed, its parameter values are not polled until you expand it. Expand the panel to see the latest values. How do I add a parameter that is not listed in the “Add parameter display” modal?Section titled “How do I add a parameter that is not listed in the “Add parameter display” modal?”The dashboard’s “Add parameter display” modal only shows parameters that are already tracked (have automatic periodic readings enabled). If the parameter you want is not listed:
Overvis will automatically enable tracking for the parameter and add it to the dashboard. |
| | ||||||||||||
|---|---|---|---|---|---|---|---|---|---|---|---|---|
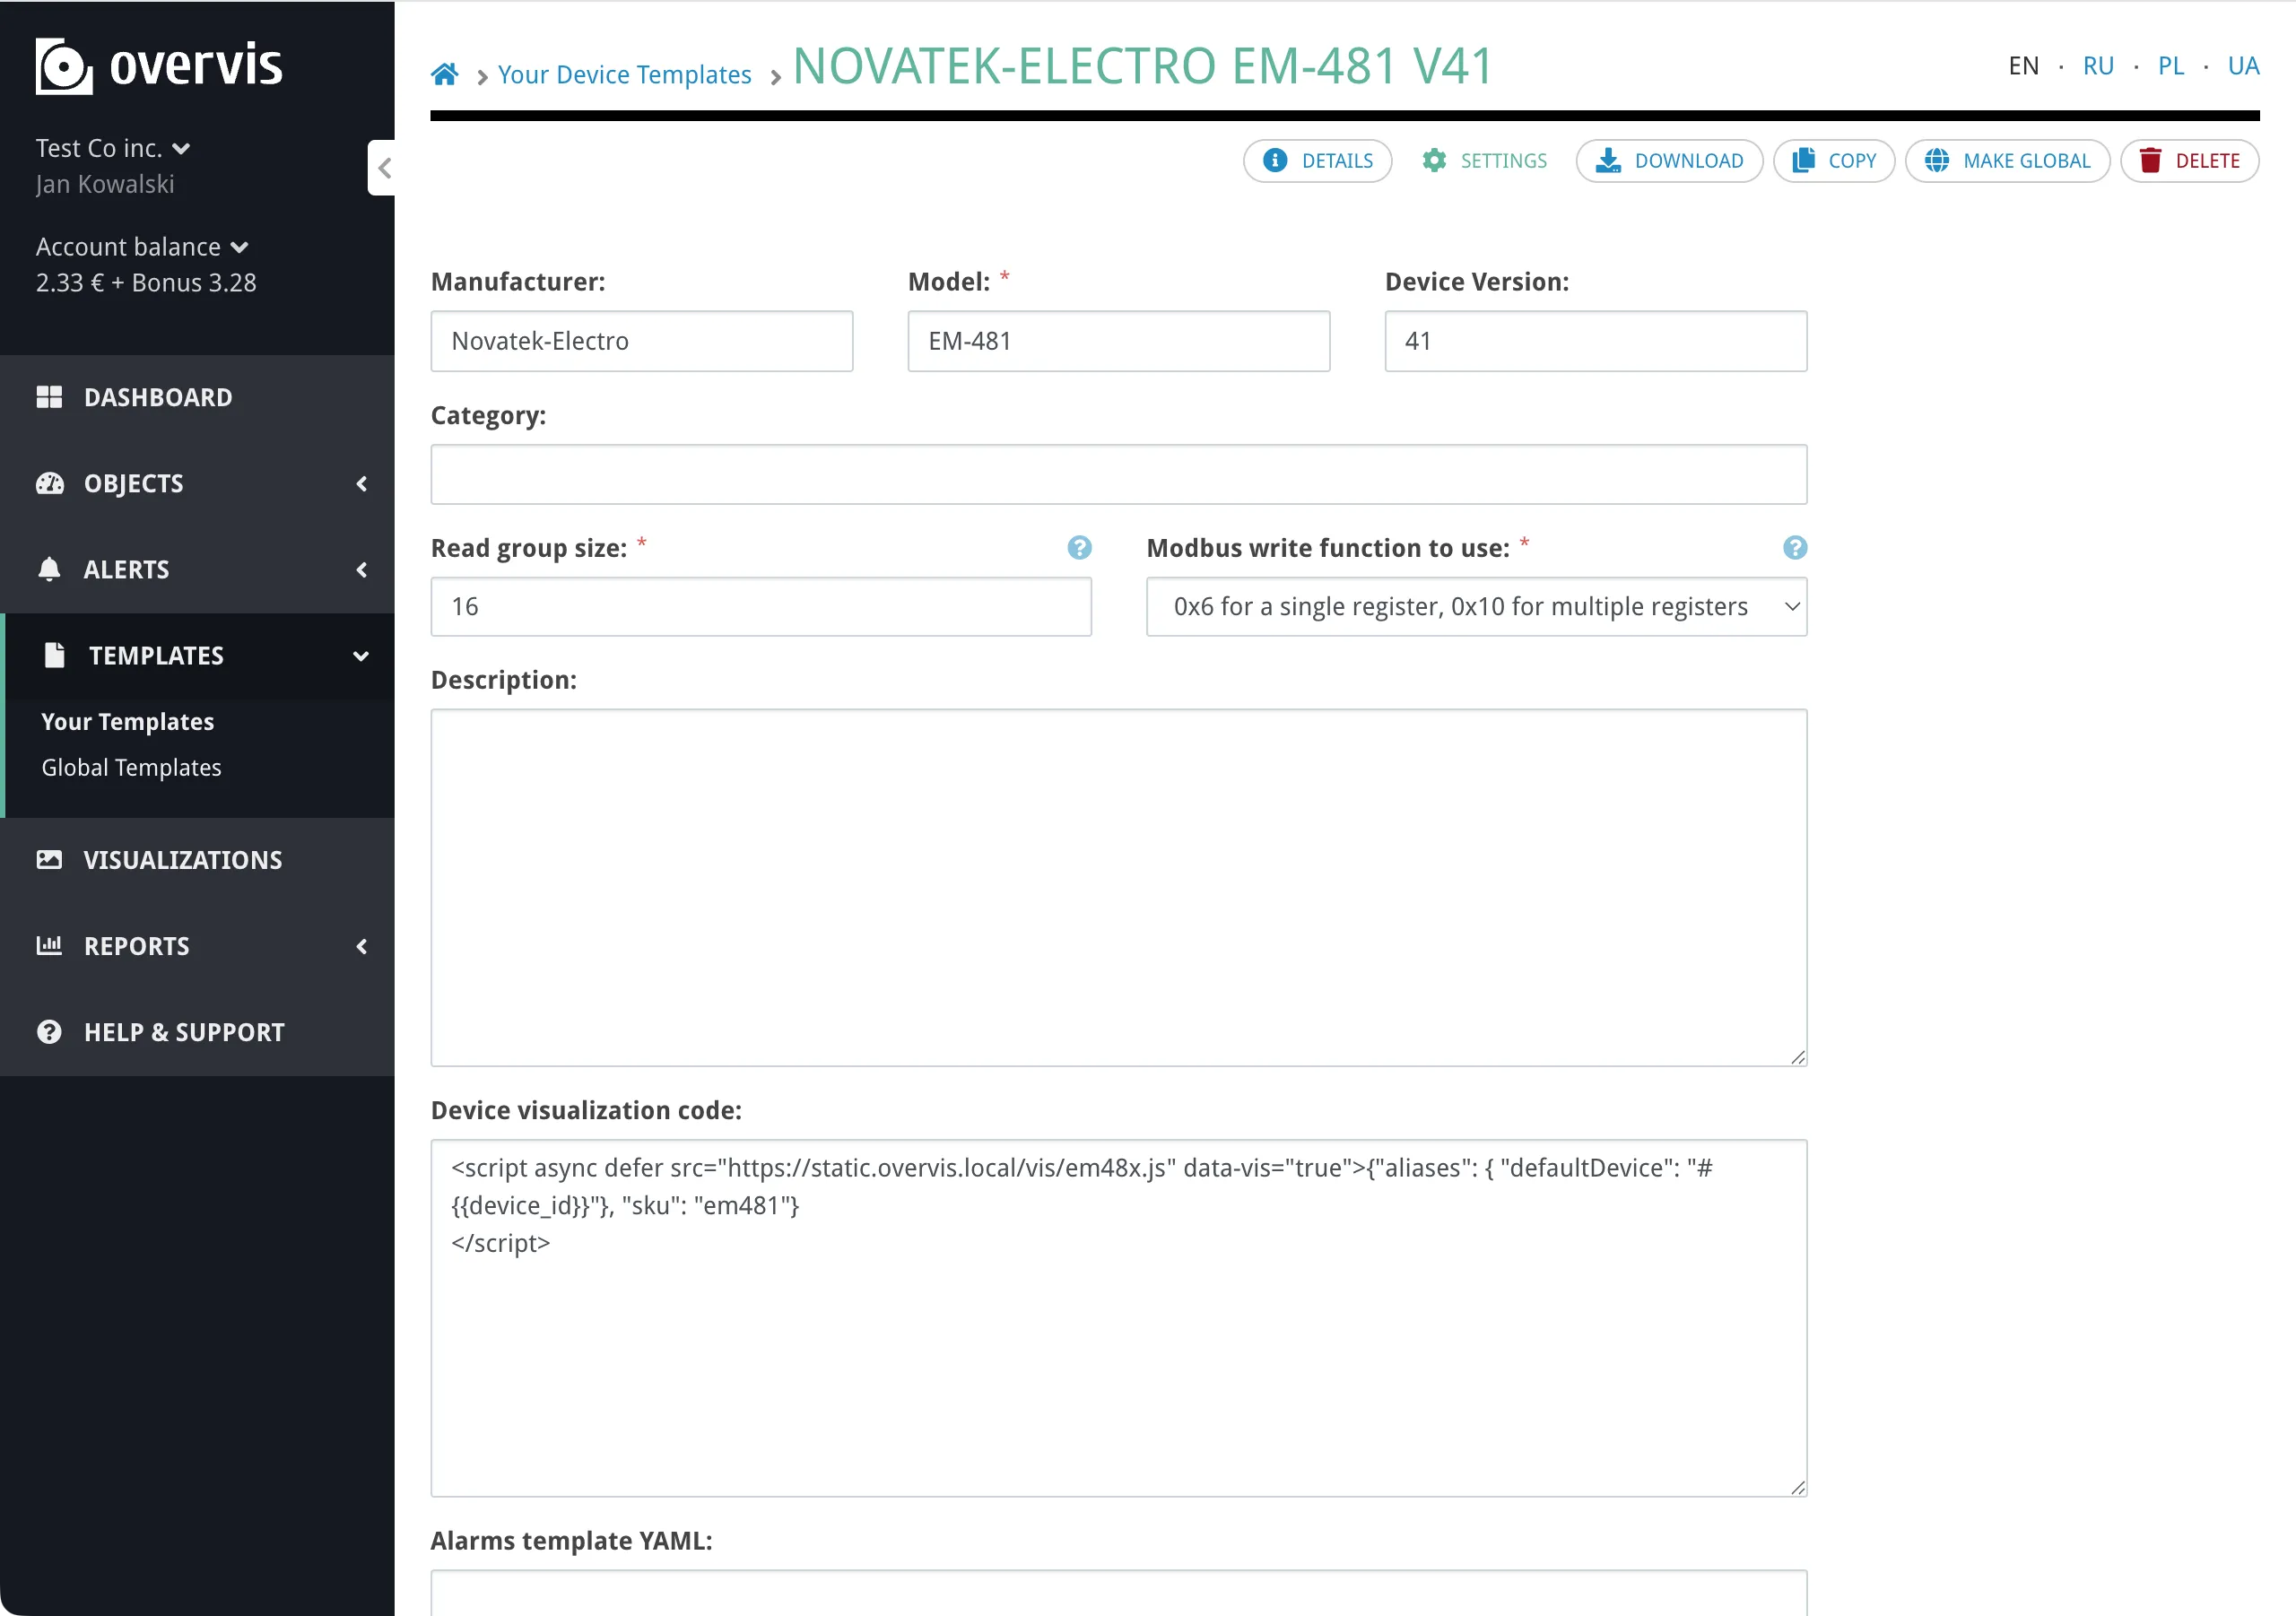
Device TemplatesEvery Modbus device needs a set of parameters before Overvis can read data from it — register addresses, value types, names, units, tracking flags, and so on. Setting these up manually for a 50-register energy meter is time-consuming; doing it for twenty identical meters is impractical. Device templates solve this. A template is a saved, reusable parameter configuration for a specific device model. Select a template when creating a device (or apply one later), and Overvis configures all parameters, dashboard widgets, visualizations, and alerts automatically. What a template containsSection titled “What a template contains”A device template stores two kinds of information: Device-level settings — metadata and communication defaults:
Parameter definitions — one entry per register or bit the device exposes:
Optional extras:
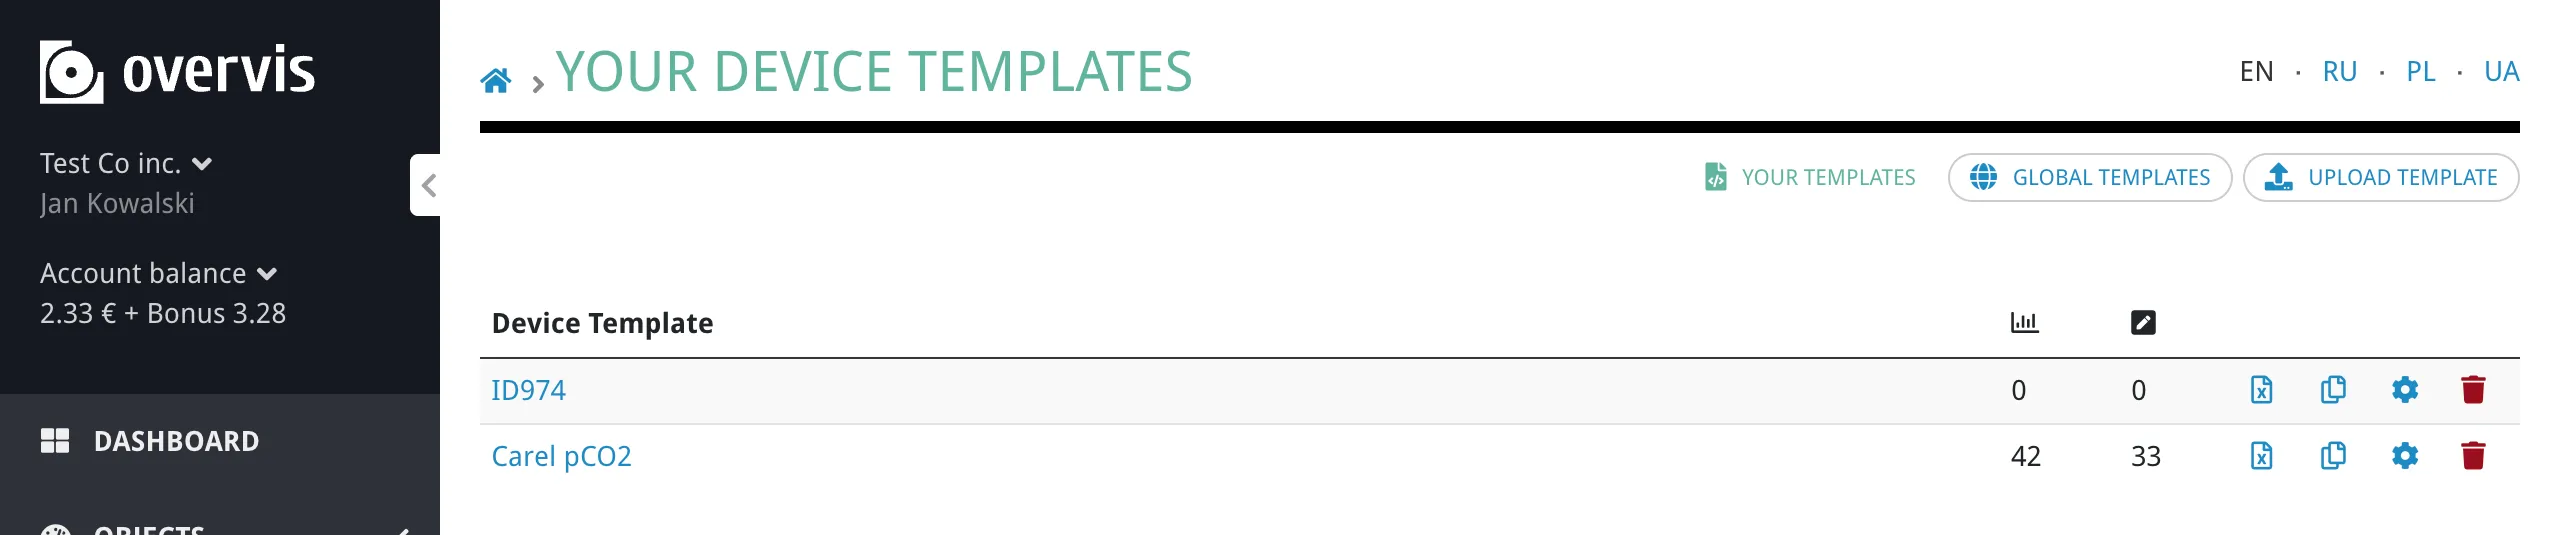
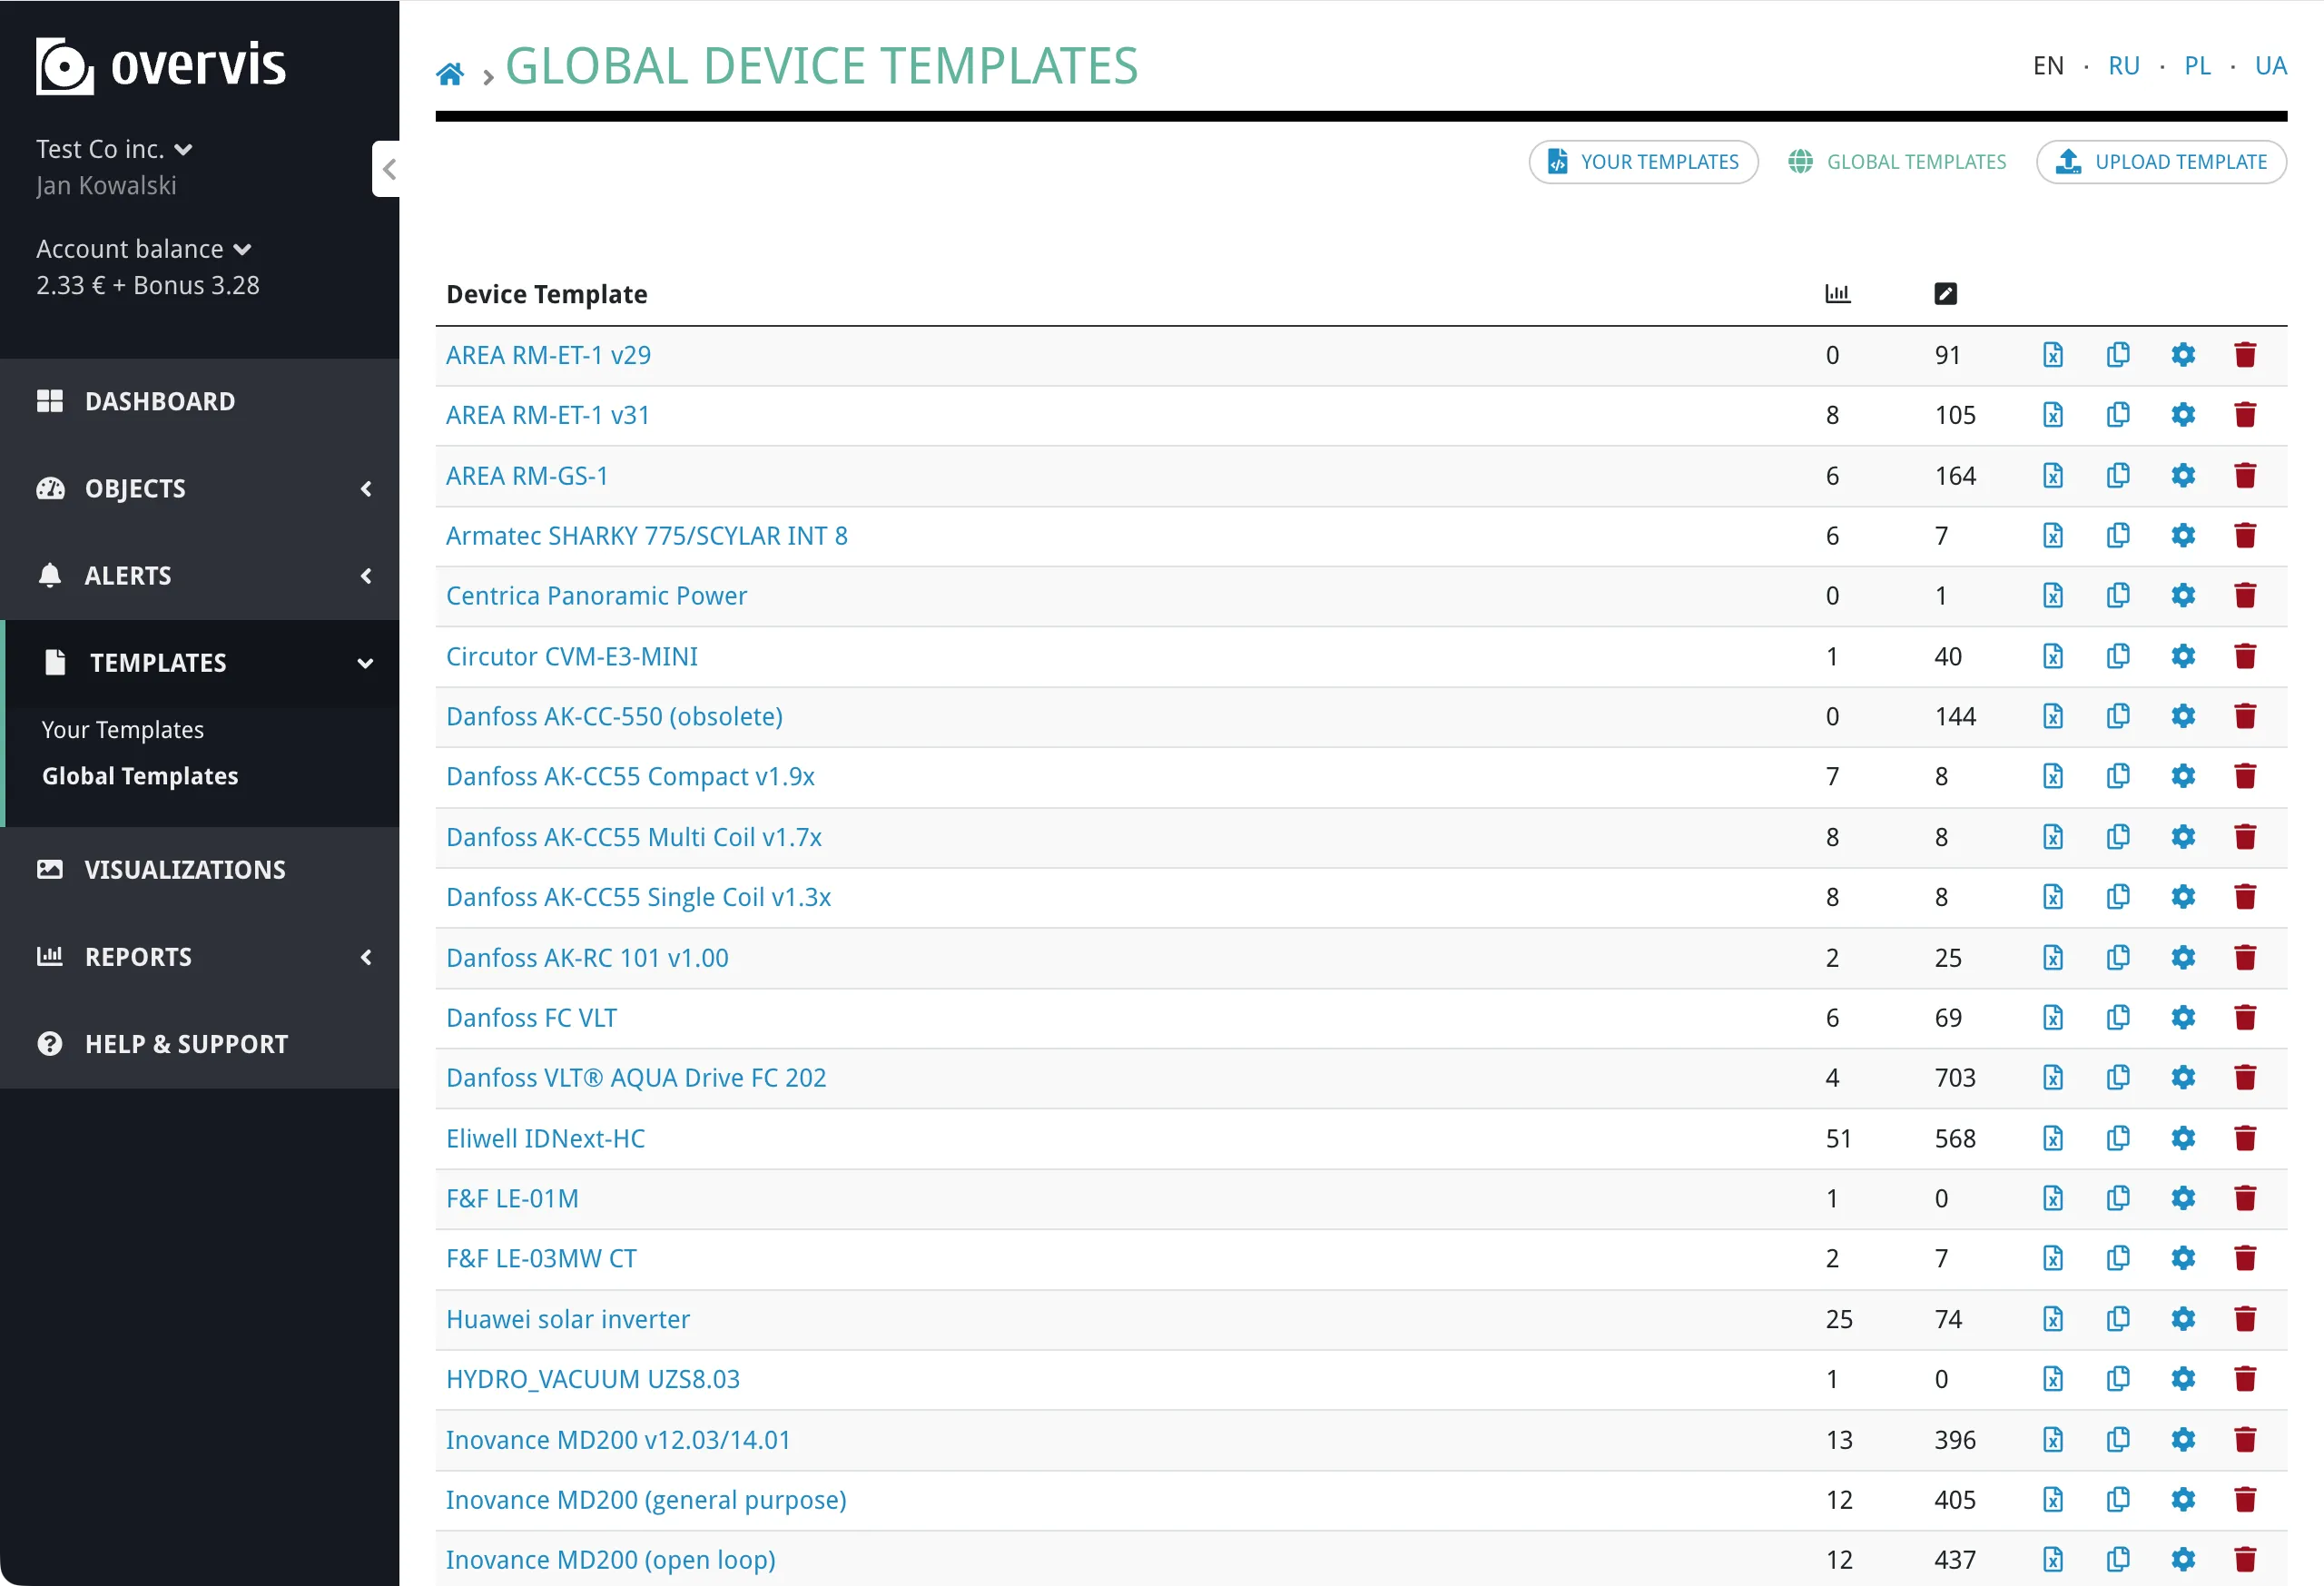
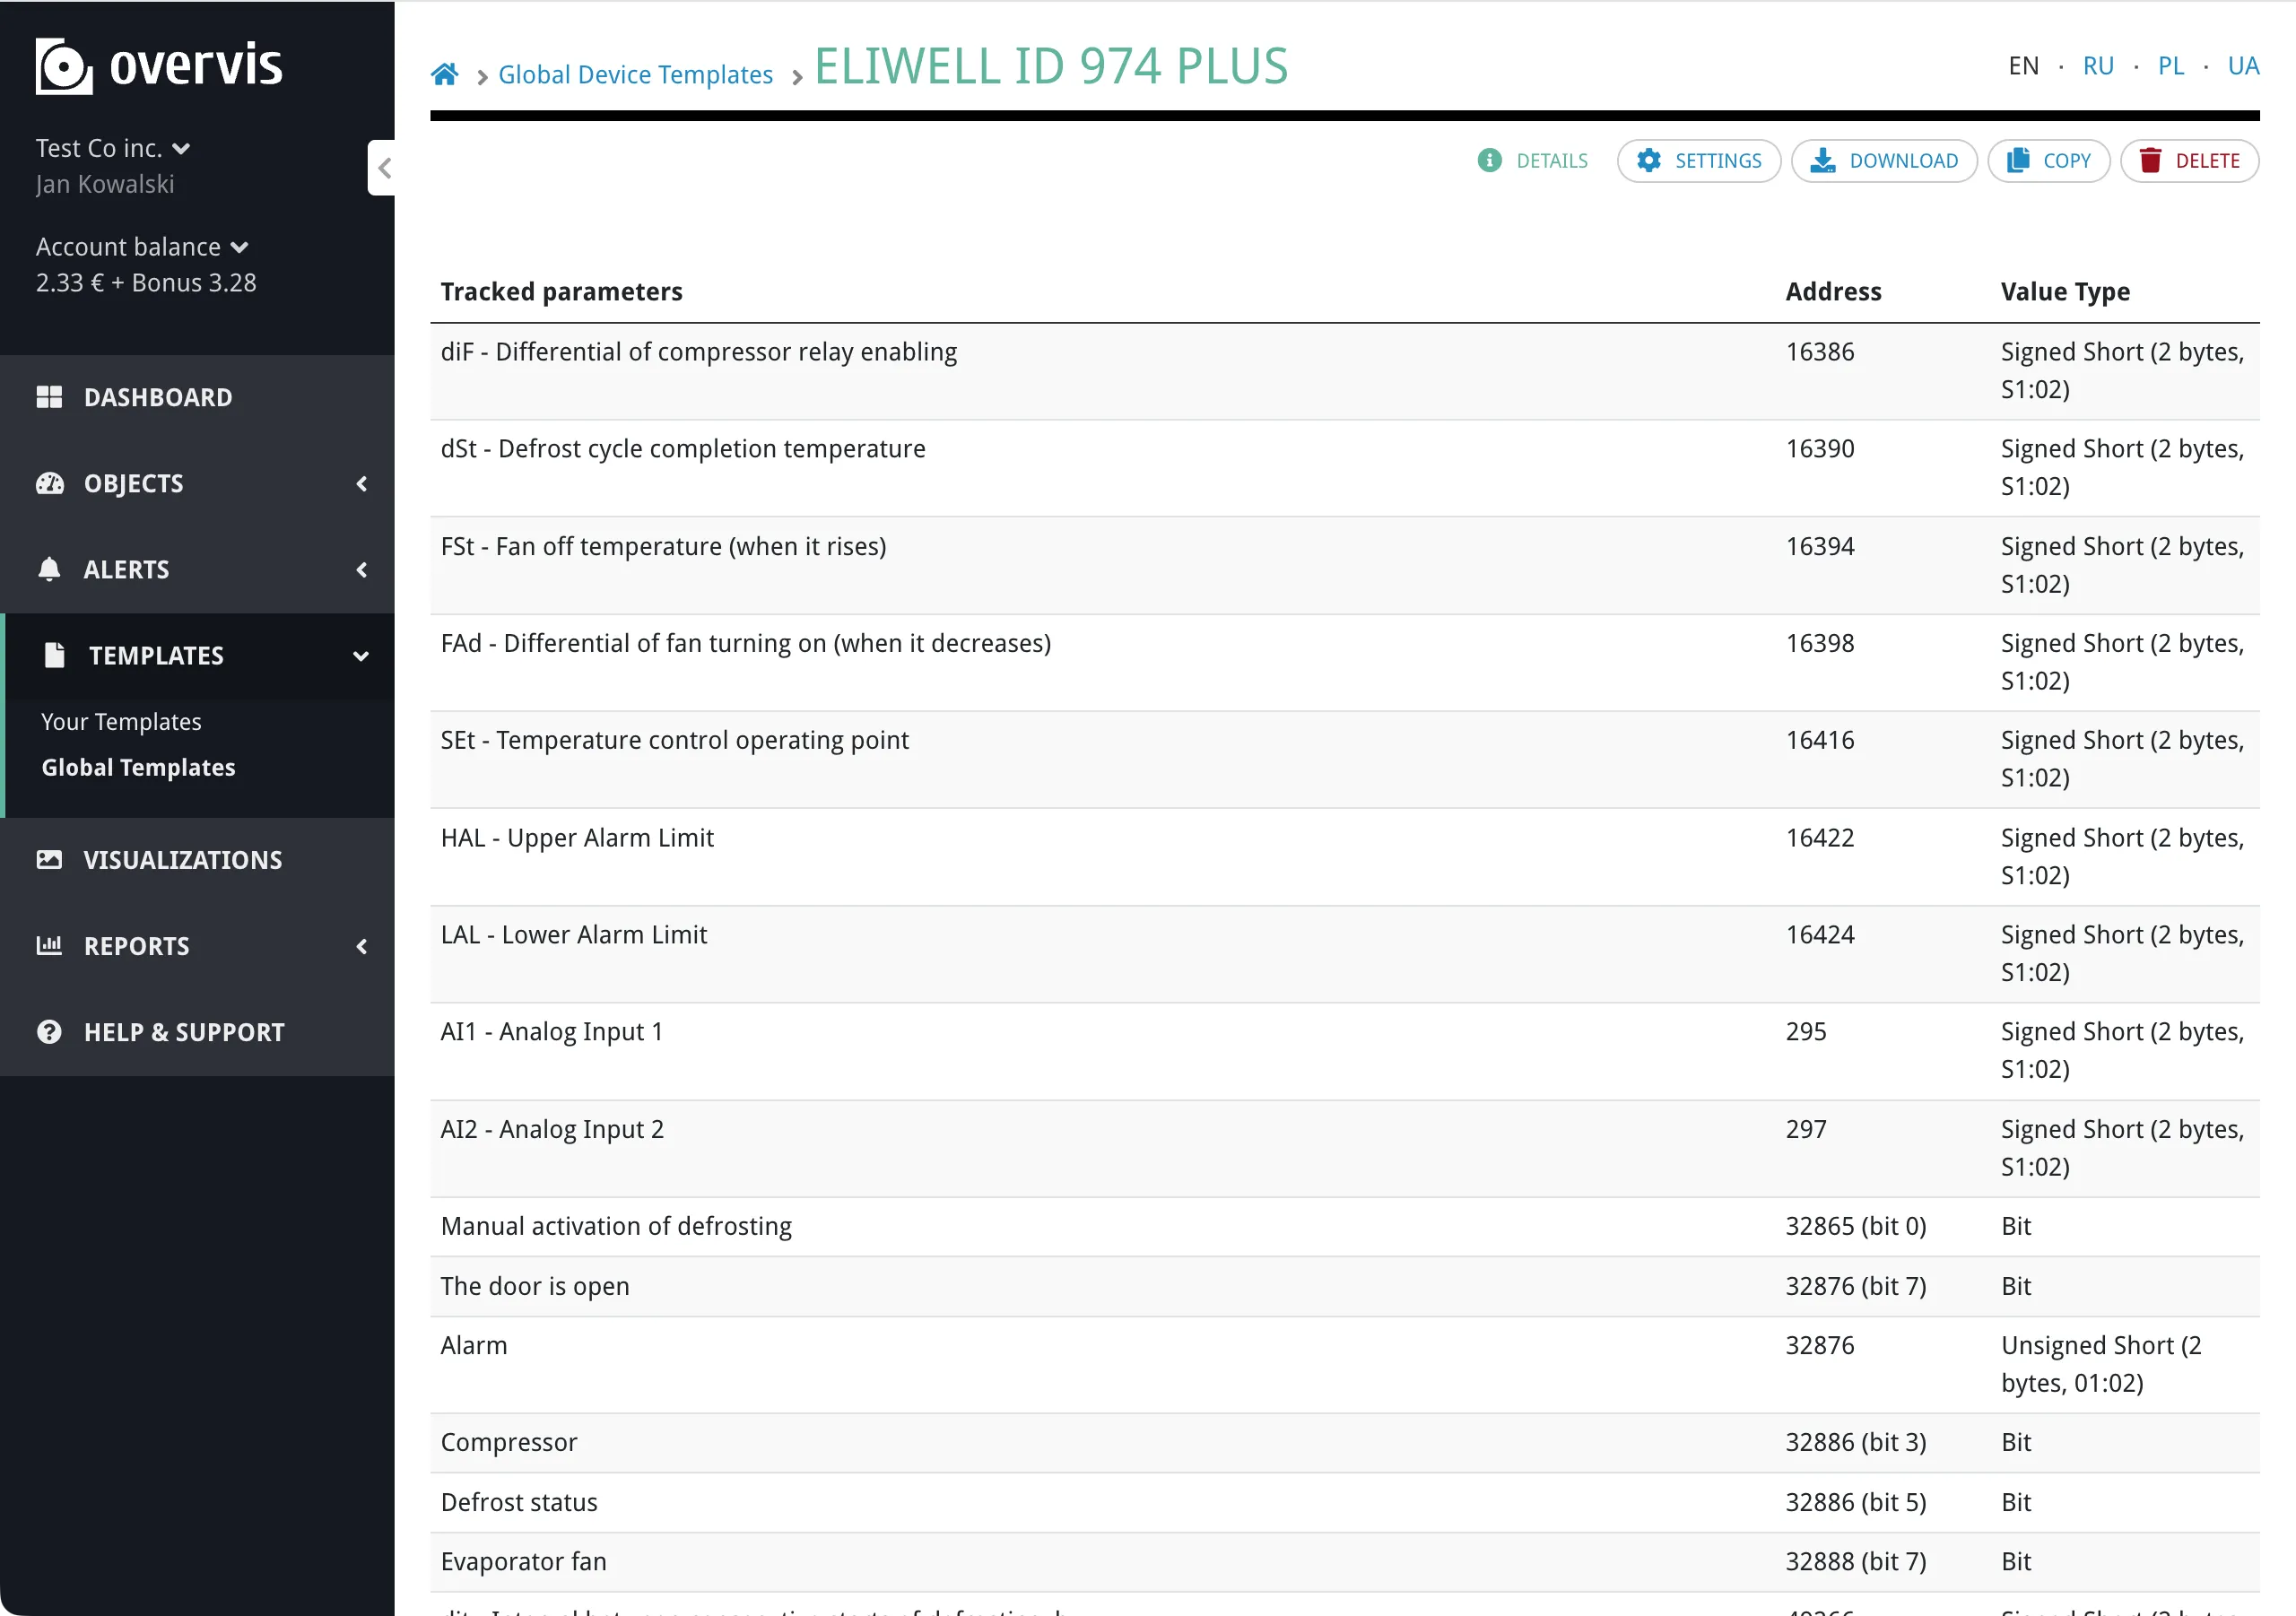
Global and organization templatesSection titled “Global and organization templates”Templates exist at two levels: Global templates are maintained by Overvis and available to all users. They cover common industrial devices — controllers, energy meters, PLCs, sensors, and gateways. You cannot edit global templates, but you can clone them into your organization to customize. Organization templates belong to a specific organization. They are visible only to members of that organization. You can create, edit, clone, delete, and export organization templates freely. Browsing templatesSection titled “Browsing templates”In the Overvis web interface, go to Templates in the left sidebar:
Both views display the template name, manufacturer, version, and parameter count (tracked and programmable). Click a template to see its full parameter list and settings. Your Templates lists the templates your organization owns or has cloned:
Global Templates lists the shared library maintained by Overvis:
Cloning a global templateSection titled “Cloning a global template”If a global template is close to what you need but requires modifications — different scaling, extra parameters, adjusted alerts — clone it:
If a template with the same name already exists, the clone is created with a numeric suffix (e.g. PAC3200 (1)). Enumeration mappings and translations are fully copied to the clone. Creating templatesSection titled “Creating templates”There are two ways to create an organization template: save from an existing device, or import from an Excel file. From an existing deviceSection titled “From an existing device”If you have already configured a device manually — set up all its parameters, units, tracking flags, and so on — you can save that configuration as a template:
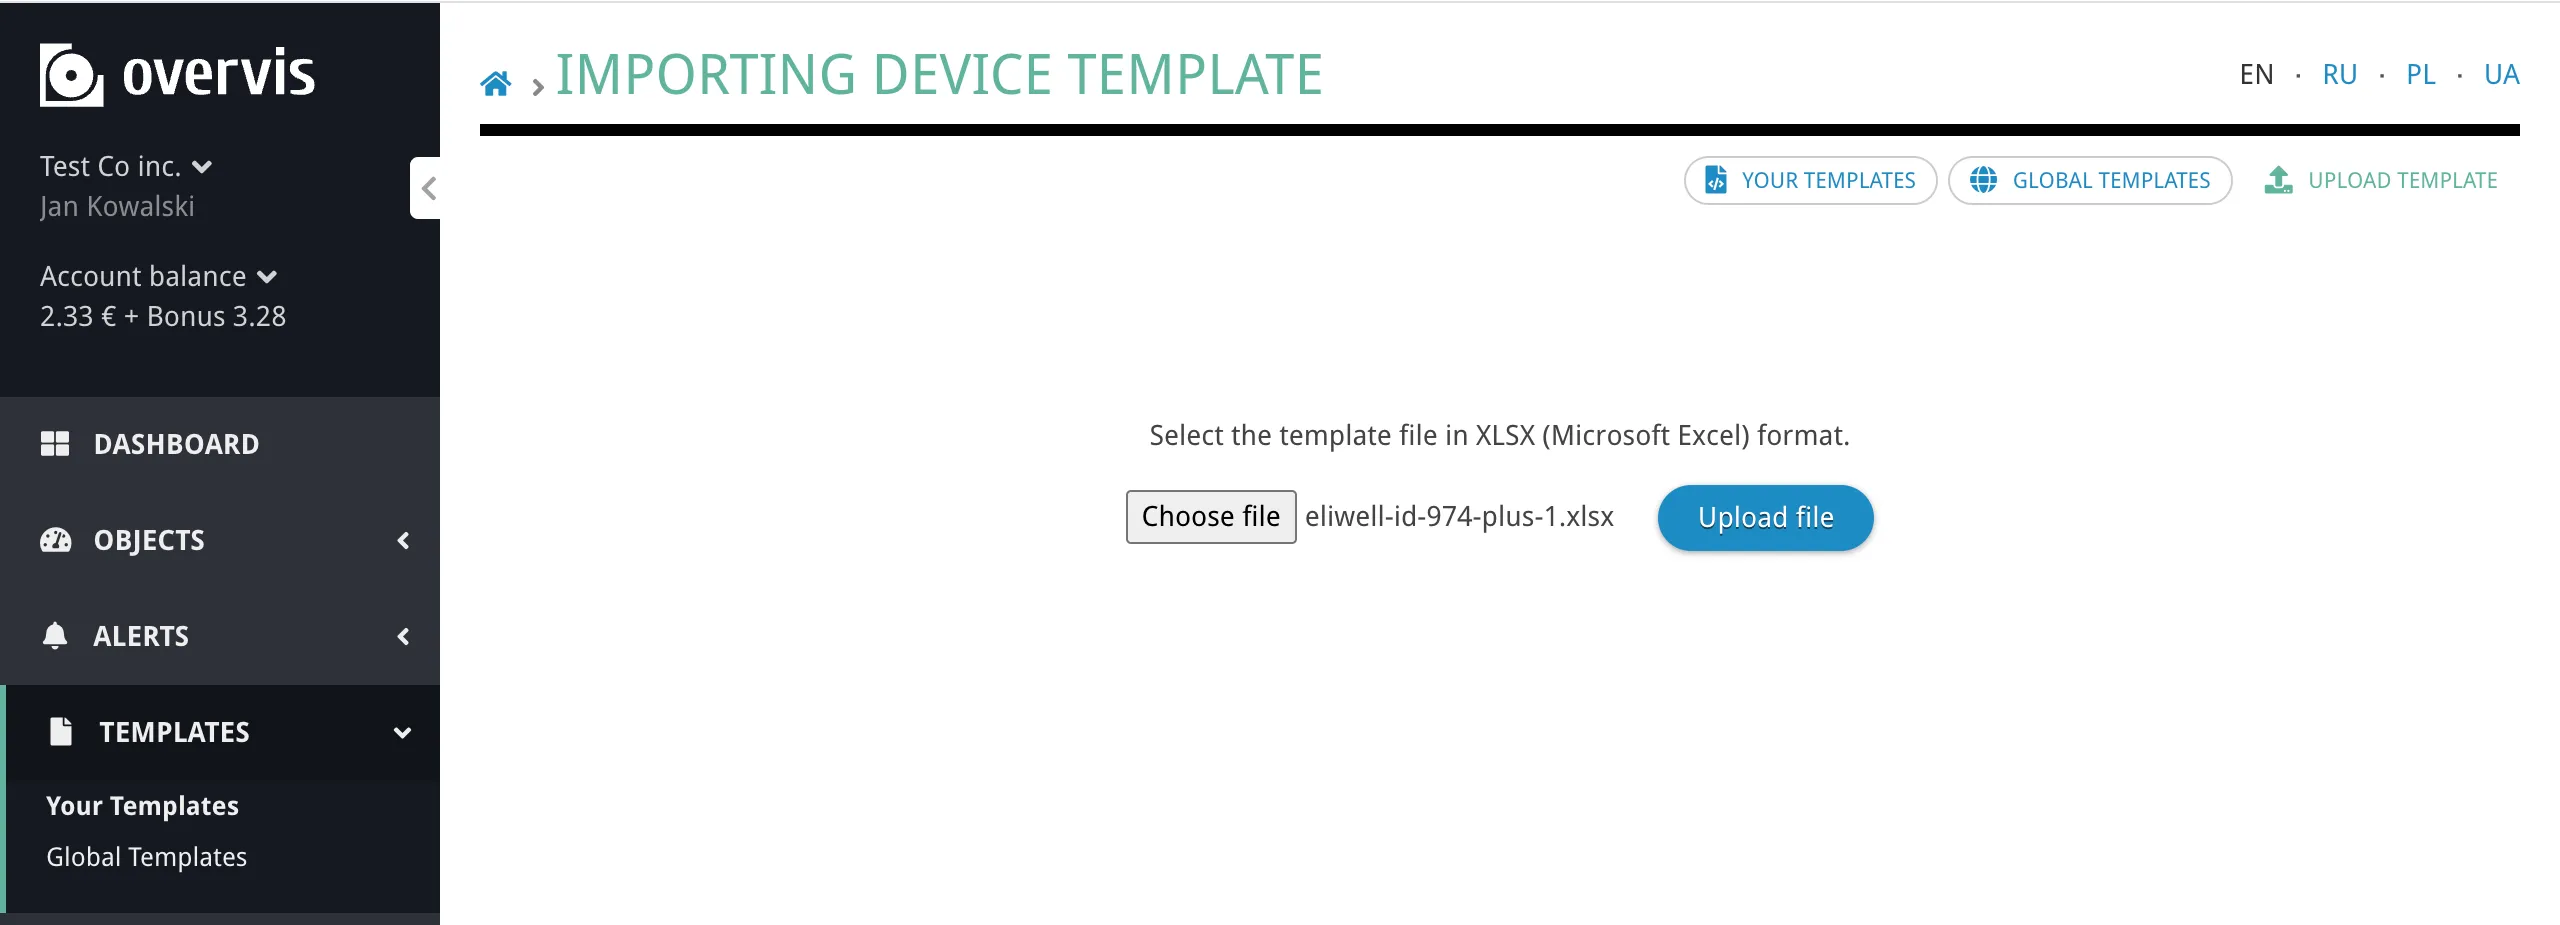
The new template appears in your organization library with the same parameters, register settings, and enumeration mappings as the device. You can edit name, manufacturer, version, category, and description later on the template settings page. From an Excel fileSection titled “From an Excel file”For new device models, or when you want precise control over every field, create a template as an Excel
If a template with the same name, version, and manufacturer already exists in your organization, the import replaces it — the old template is deleted and the new one takes its place. The Excel file must have an Info sheet and a Params sheet. Optional sheets: Visualization (device visualization source code) and Alerts (alert template YAML). No other sheet names are allowed. See the Device Templates Reference for the complete specification.
Editing templatesSection titled “Editing templates”After creating or cloning a template, you can edit its metadata (name, manufacturer, version, category, and description) through the template settings page. The settings page also has an Alarms template YAML: field where you can add or edit alert definitions directly, without re-importing the Excel file. To change individual parameter definitions, export the template to Excel, make changes in the spreadsheet, and re-import.
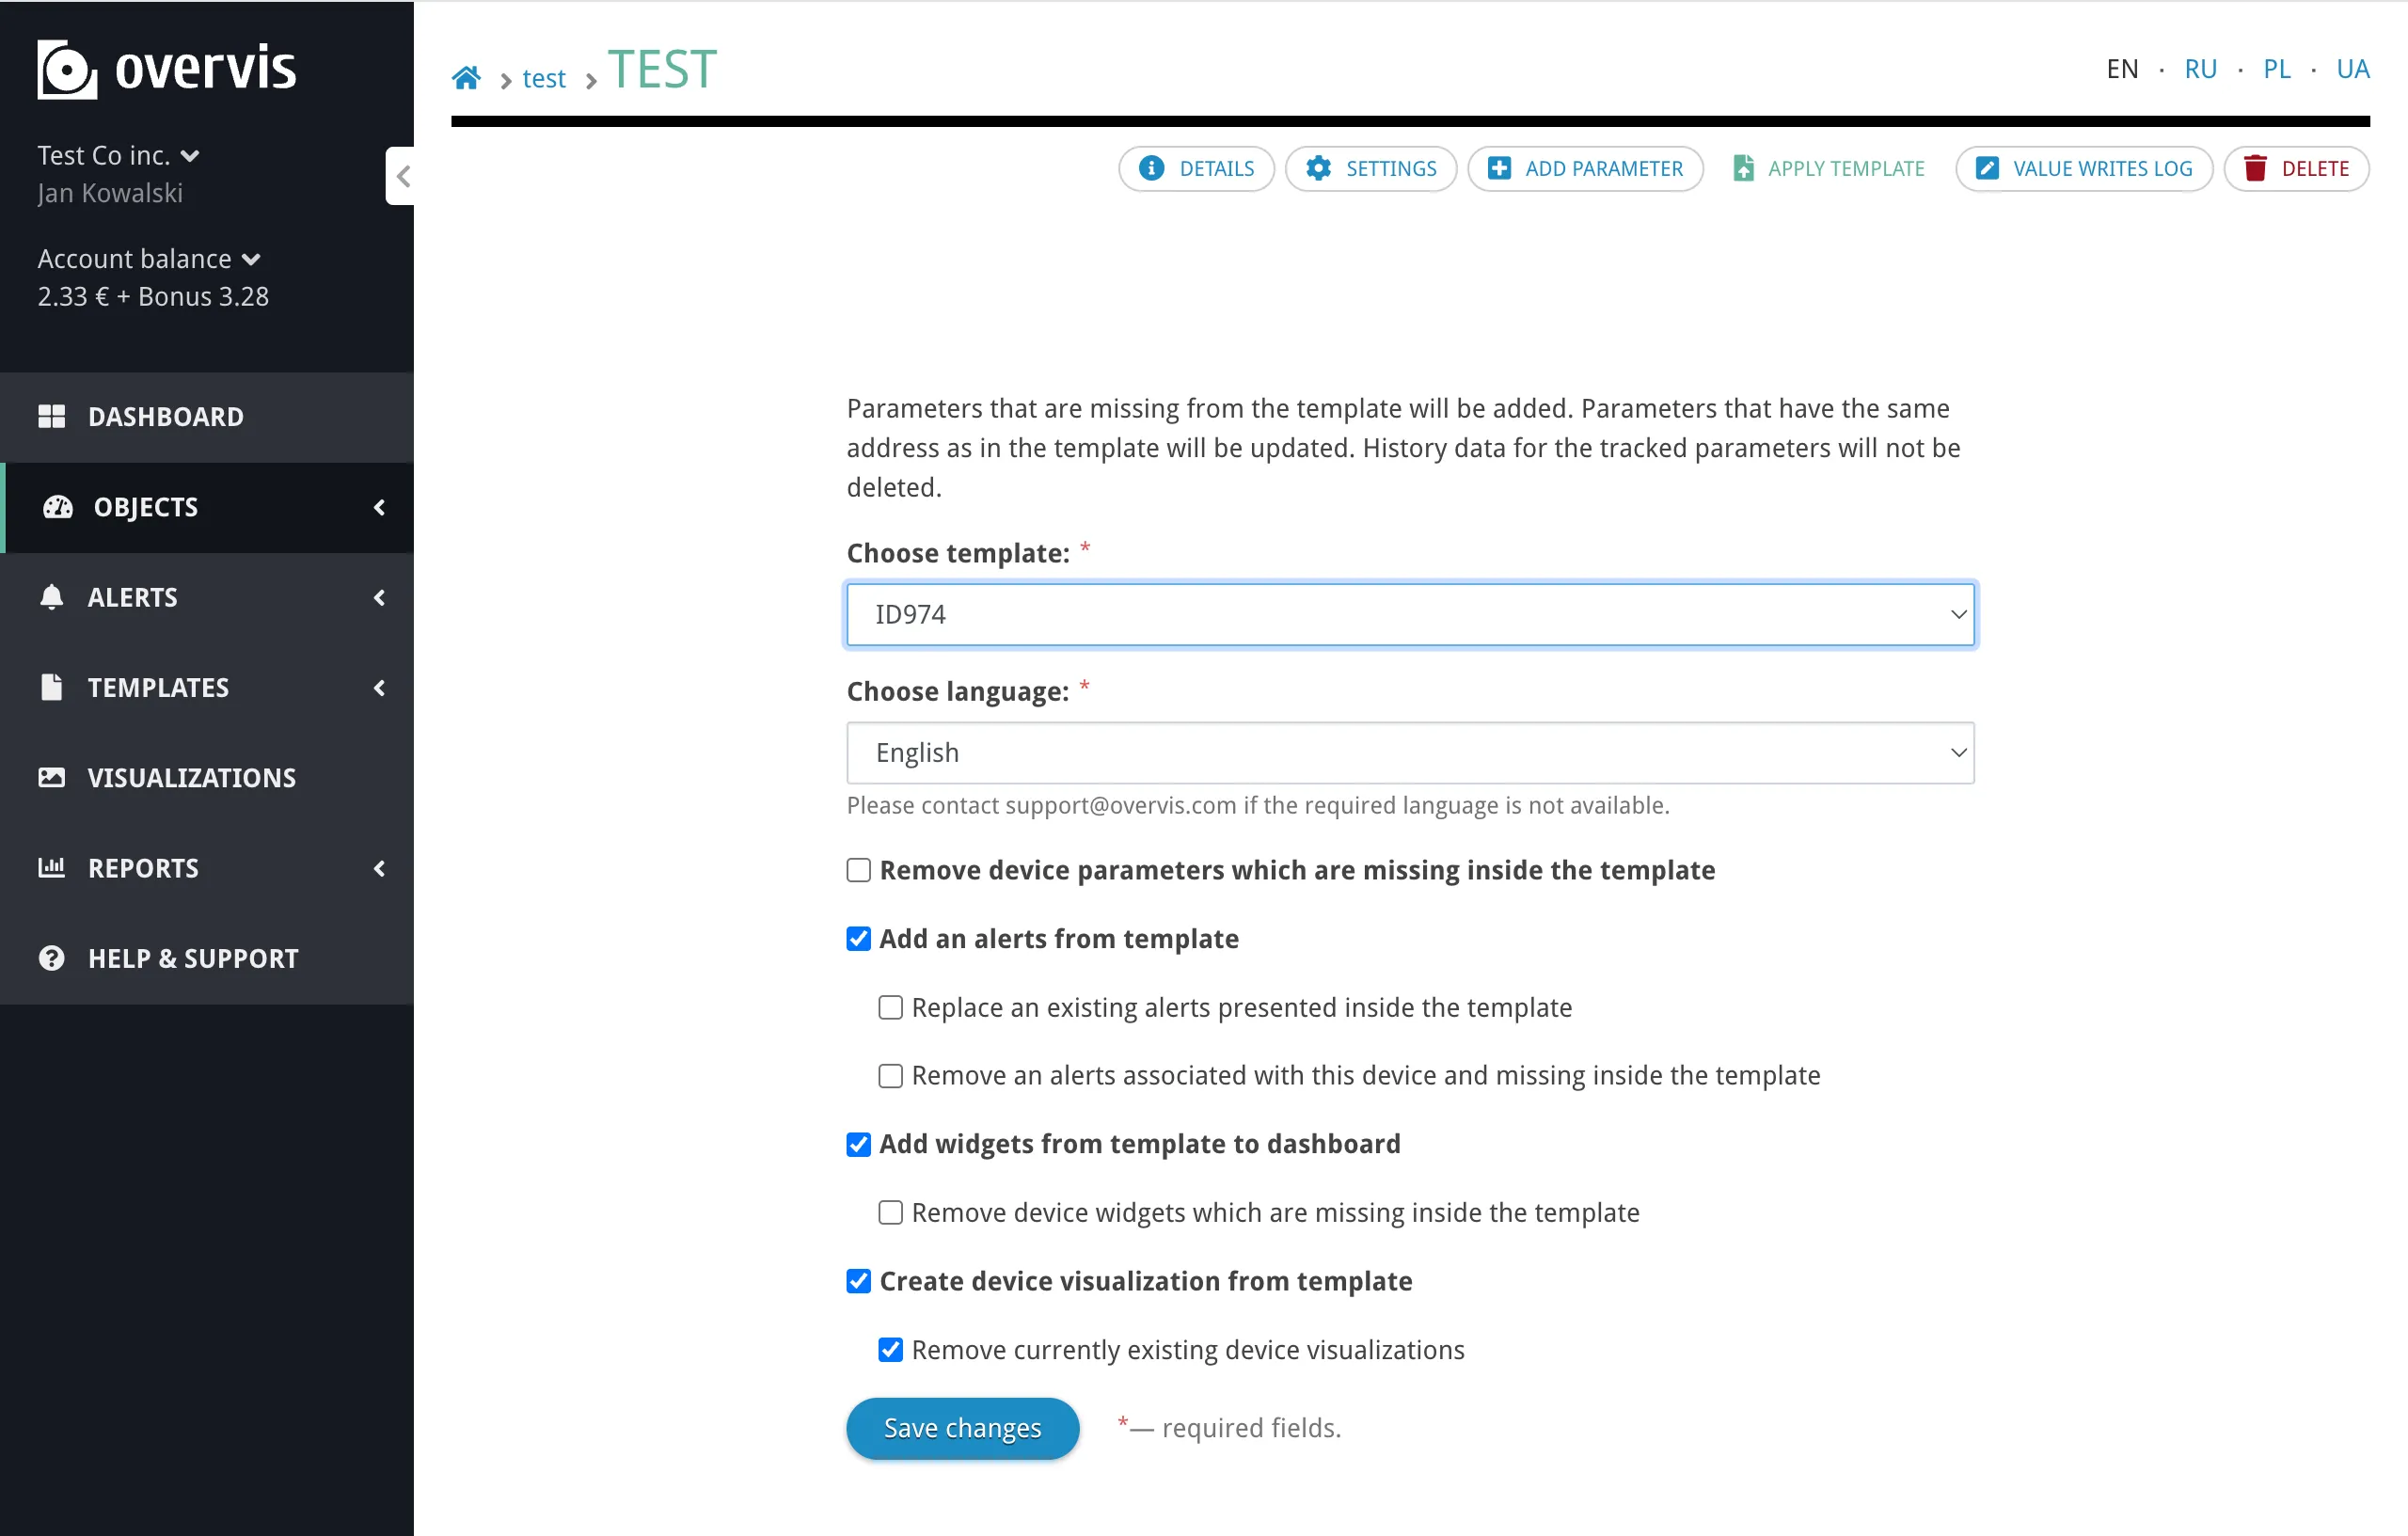
Exporting templatesSection titled “Exporting templates”Any template — global or organization — can be exported as an Applying a template to a deviceSection titled “Applying a template to a device”Templates can be applied when creating a new device or to an existing device at any time. During device creationSection titled “During device creation”When adding a device to a network, select a template from the dropdown. The device will be created with all template parameters pre-configured. Overvis records which template was used, so you can see the original template on the device page. To an existing deviceSection titled “To an existing device”
Apply optionsSection titled “Apply options”When applying a template, you control what happens with several settings: Parameters:
Alerts:
Dashboard widgets:
Visualizations:
After applying, Overvis refreshes the device configuration on the communication operator so polling begins immediately with the new parameters. Template detailsSection titled “Template details”Click on any template to see its full details: device-level settings, the complete parameter list with addresses, value types, tracking flags, and enumeration mappings.
TranslationsSection titled “Translations”Templates support multilingual parameter names, descriptions, categories, units, and enumeration labels. The base language is always English. Additional translations (Ukrainian, Polish, Russian) can be included in the Excel file or managed through the template settings. When applying a template, you choose which language to use. Overvis looks up translations for that language and applies them to parameter names and other text fields. If a translation is missing for a specific field, the English value is used. Enumeration parametersSection titled “Enumeration parameters”Some device parameters represent discrete states rather than continuous values — operating modes, error codes, status flags. Templates handle these with the An enumeration mapping defines which numeric register value corresponds to which human-readable text. For example, a status register might map Enumeration mappings are defined per-parameter in the template and can include translations. When a template with enum parameters is applied, Overvis creates the mapping automatically, so the dashboard and parameter views show the text labels instead of raw numbers. For more details on how enumeration parameters work, see Networks, Devices & Parameters — Enumeration parameters. PermissionsSection titled “Permissions”
TroubleshootingSection titled “Troubleshooting”Import fails with validation errorsSection titled “Import fails with validation errors”When importing a template from Excel, Overvis validates the file structure and every field value. Common causes of validation errors:
The error message includes the sheet name, row number, and cell reference to help locate the issue. Parameters not updating after template applySection titled “Parameters not updating after template apply”If applying a template does not update existing parameters as expected:
Alerts not created from templateSection titled “Alerts not created from template”
Device not polling after template applySection titled “Device not polling after template apply”After applying a template, Overvis sends the updated configuration to the communication operator. If the device is not polling:
Template not appearing after importSection titled “Template not appearing after import”
Common questionsSection titled “Common questions”Can I apply multiple templates to the same device?Section titled “Can I apply multiple templates to the same device?”Yes. You can apply templates sequentially. Each apply merges or replaces parameters based on the matching logic (address, register kind, bit position, bits amount). To combine parameters from two templates, apply the first one, then apply the second without enabling Remove device parameters which are missing inside the template. What happens to existing parameters when I apply a template?Section titled “What happens to existing parameters when I apply a template?”By default, existing parameters are kept. Parameters that match a template parameter (by address, register kind, bit position, and bits amount) are updated with the template’s settings. Template parameters that don’t match any existing parameter are added as new parameters. Enable Remove device parameters which are missing inside the template to delete unmatched device parameters. How do I update a template across many devices?Section titled “How do I update a template across many devices?”There is no bulk re-apply feature. To update all devices using a template, import the updated template, then apply it to each device individually. Use Remove device parameters which are missing inside the template if you want each device to match the template exactly. Can I share templates between organizations?Section titled “Can I share templates between organizations?”Not directly. Templates belong to one organization or to the global library. To share a template, export it as an What is the difference between global and organization templates?Section titled “What is the difference between global and organization templates?”Global templates are maintained by Overvis, available to everyone, and read-only. Organization templates belong to your organization, are private to your members, and can be freely edited. Clone a global template to your organization if you need to modify it. Can I edit individual parameters in a template without re-importing?Section titled “Can I edit individual parameters in a template without re-importing?”No. The web interface only allows editing template metadata (name, manufacturer, version, category, description) and the alert YAML. To change parameter definitions, export the template to Excel, edit the spreadsheet, and re-import. What happens if I delete a template that devices were created from?Section titled “What happens if I delete a template that devices were created from?”Nothing breaks. The devices keep their parameters and continue operating normally. The device’s reference to the template is cleared, but no parameters or settings are removed. Further readingSection titled “Further reading”
|
| | ||||||||||||||||||||||||||||||||||||||||||||
|---|---|---|---|---|---|---|---|---|---|---|---|---|---|---|---|---|---|---|---|---|---|---|---|---|---|---|---|---|---|---|---|---|---|---|---|---|---|---|---|---|---|---|---|---|
AlertsOvervis continuously reads parameter values from your devices. An alert lets you define conditions on those readings — and get notified by email, SMS, or voice call when something goes wrong. Alerts also maintain a log of every time a condition was triggered and resolved, giving you an audit trail of incidents. How alerts workSection titled “How alerts work”Every alert has three parts:
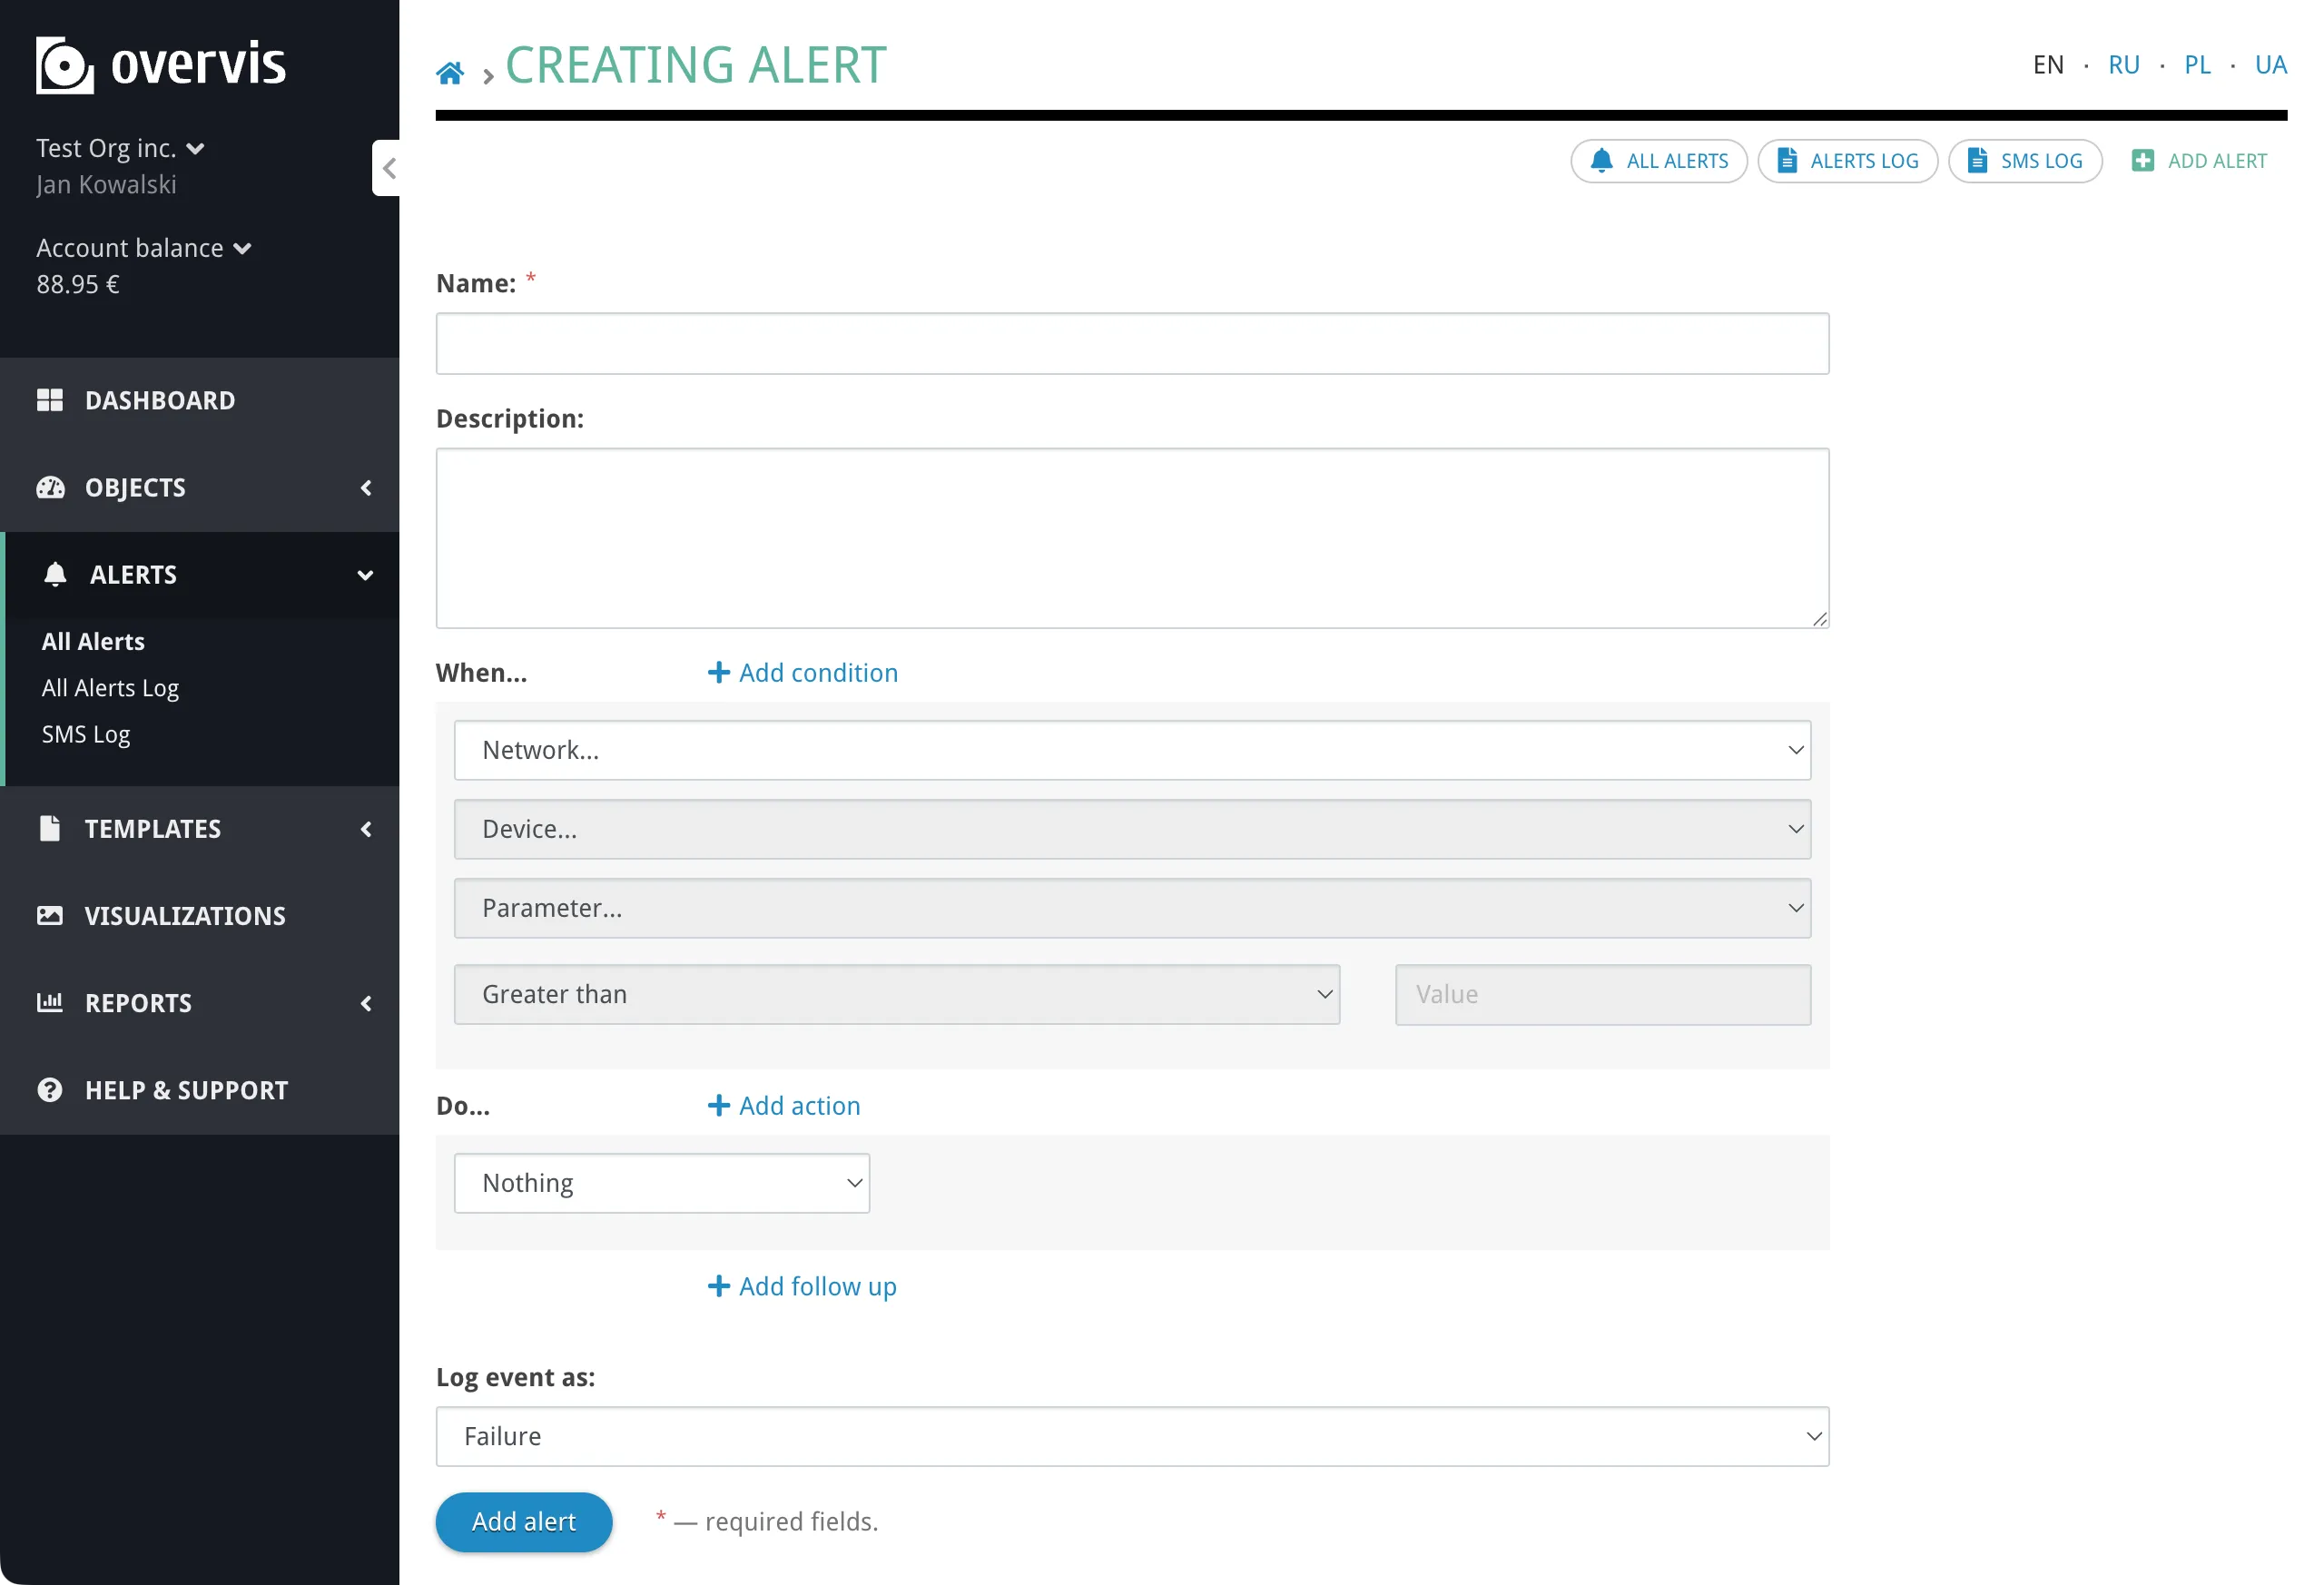
Overvis evaluates conditions automatically after each parameter reading cycle. When conditions are met, the alert activates and starts executing actions. When conditions are no longer met, the alert resolves automatically. Creating an alertSection titled “Creating an alert”Navigate to Alerts in the sidebar and click Add alert. The alert form has the sections described below.
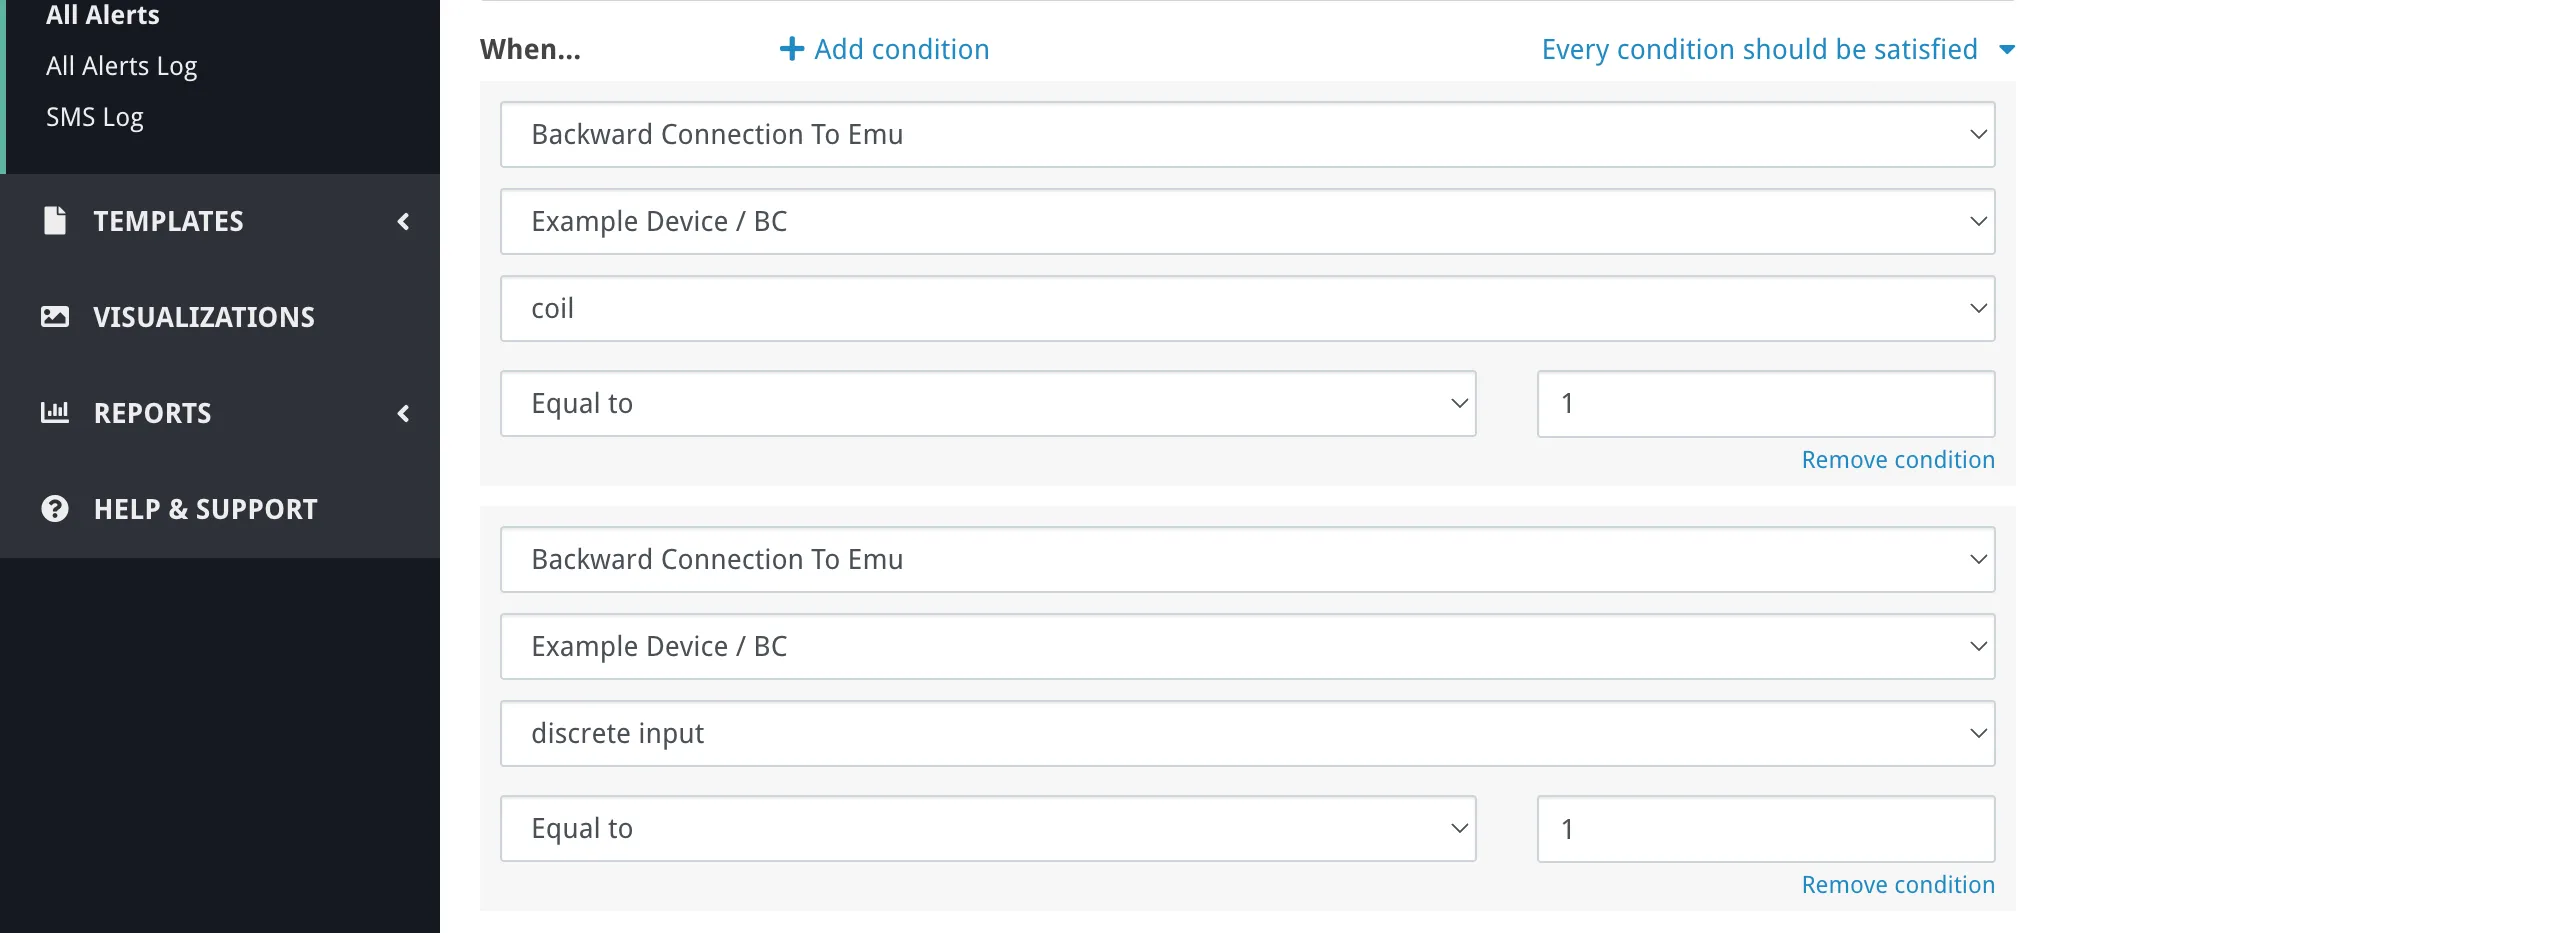
Name and descriptionSection titled “Name and description”Give the alert a descriptive name (e.g. “Cold room temperature too high”). The name appears in notifications and in the alert log, so it should be immediately understandable to whoever receives the message. The name can be up to 200 characters long. The description is optional and can contain additional context. Conditions — “When…”Section titled “Conditions — “When…””Each condition monitors one device parameter and compares its value to a threshold.
To add a condition, select a network, then a device on that network, then a parameter on that device. Only tracked parameters are available — untracked parameters are not polled, so there is nothing to compare. Next, choose a comparison operator and enter a threshold value:
The threshold is compared against the parameter’s displayed value — the value after any multiplier defined in the parameter settings has been applied. Enter the threshold in the same engineering units you see on the device page (e.g. °C, kW), not in raw register values. “Has reading error” is a special condition that triggers when the parameter cannot be read at all — for example, the device is offline, or the Modbus address is invalid. No threshold value is needed. To avoid false positives during system startup, reading error conditions are silenced for approximately 2 minutes after the system starts. Condition logic. If an alert has multiple conditions, you choose how they combine:
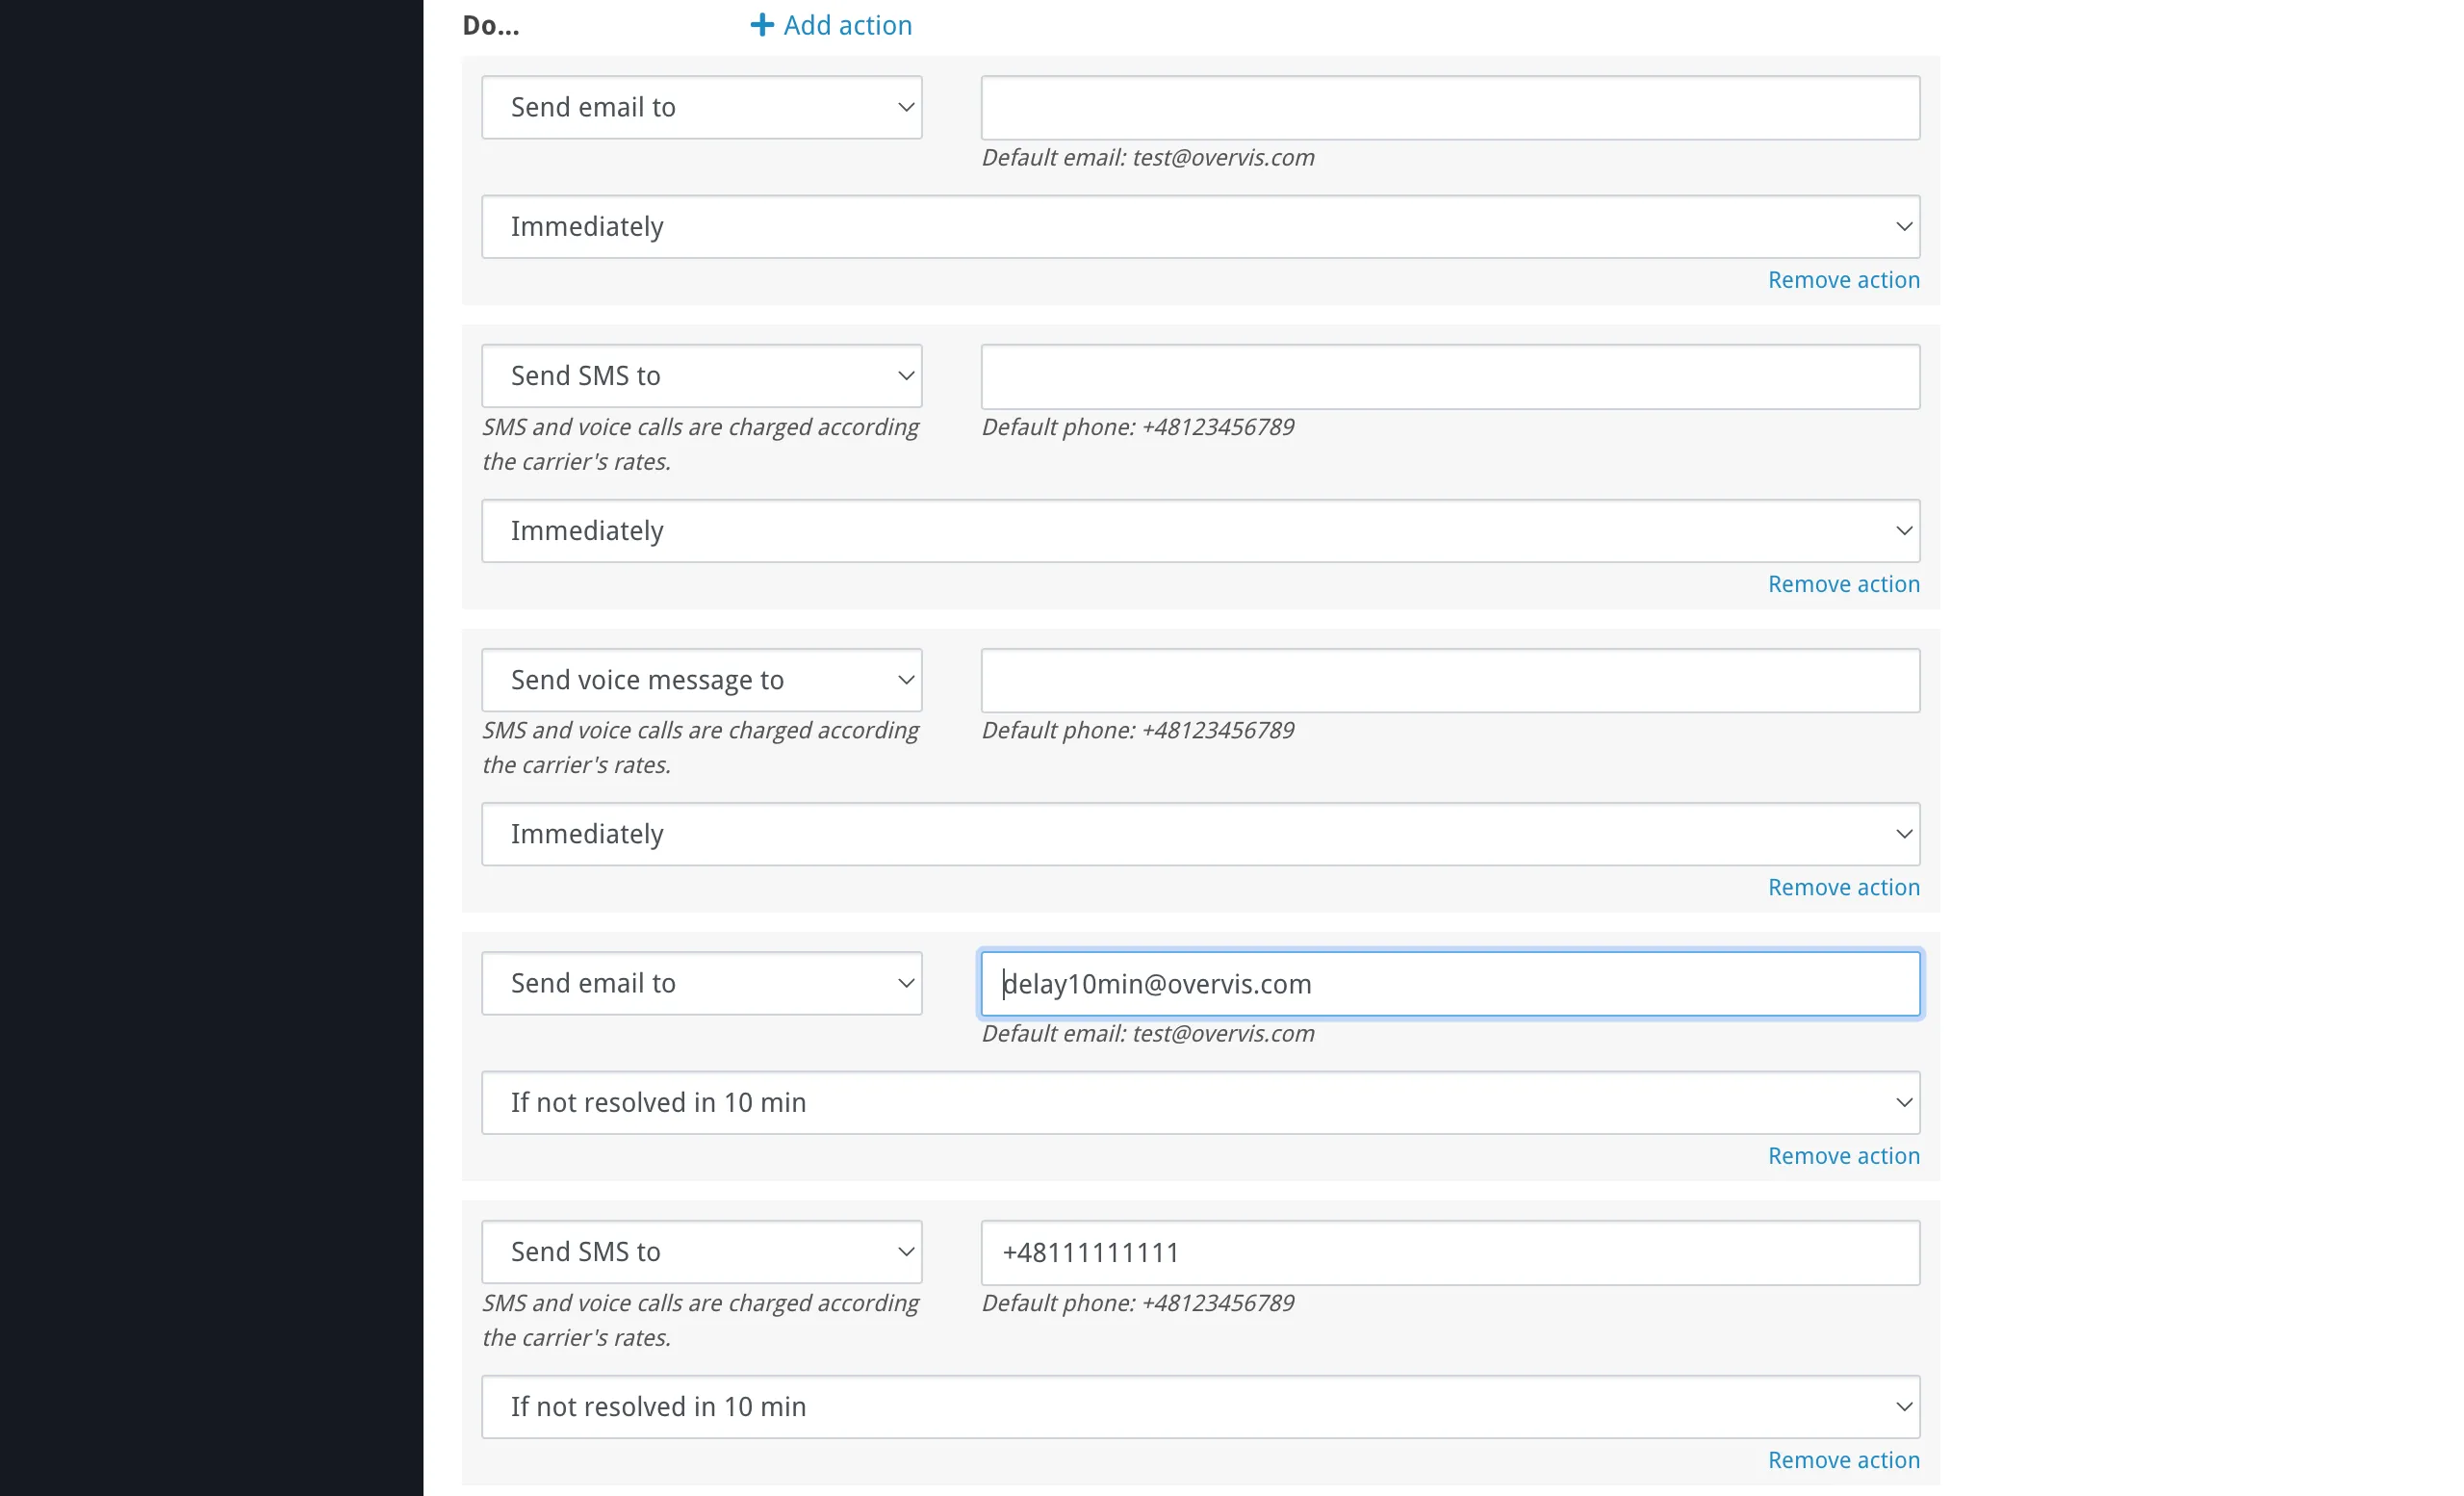
Actions — “Do…”Section titled “Actions — “Do…””Actions define what happens when the alert activates. Each action specifies:
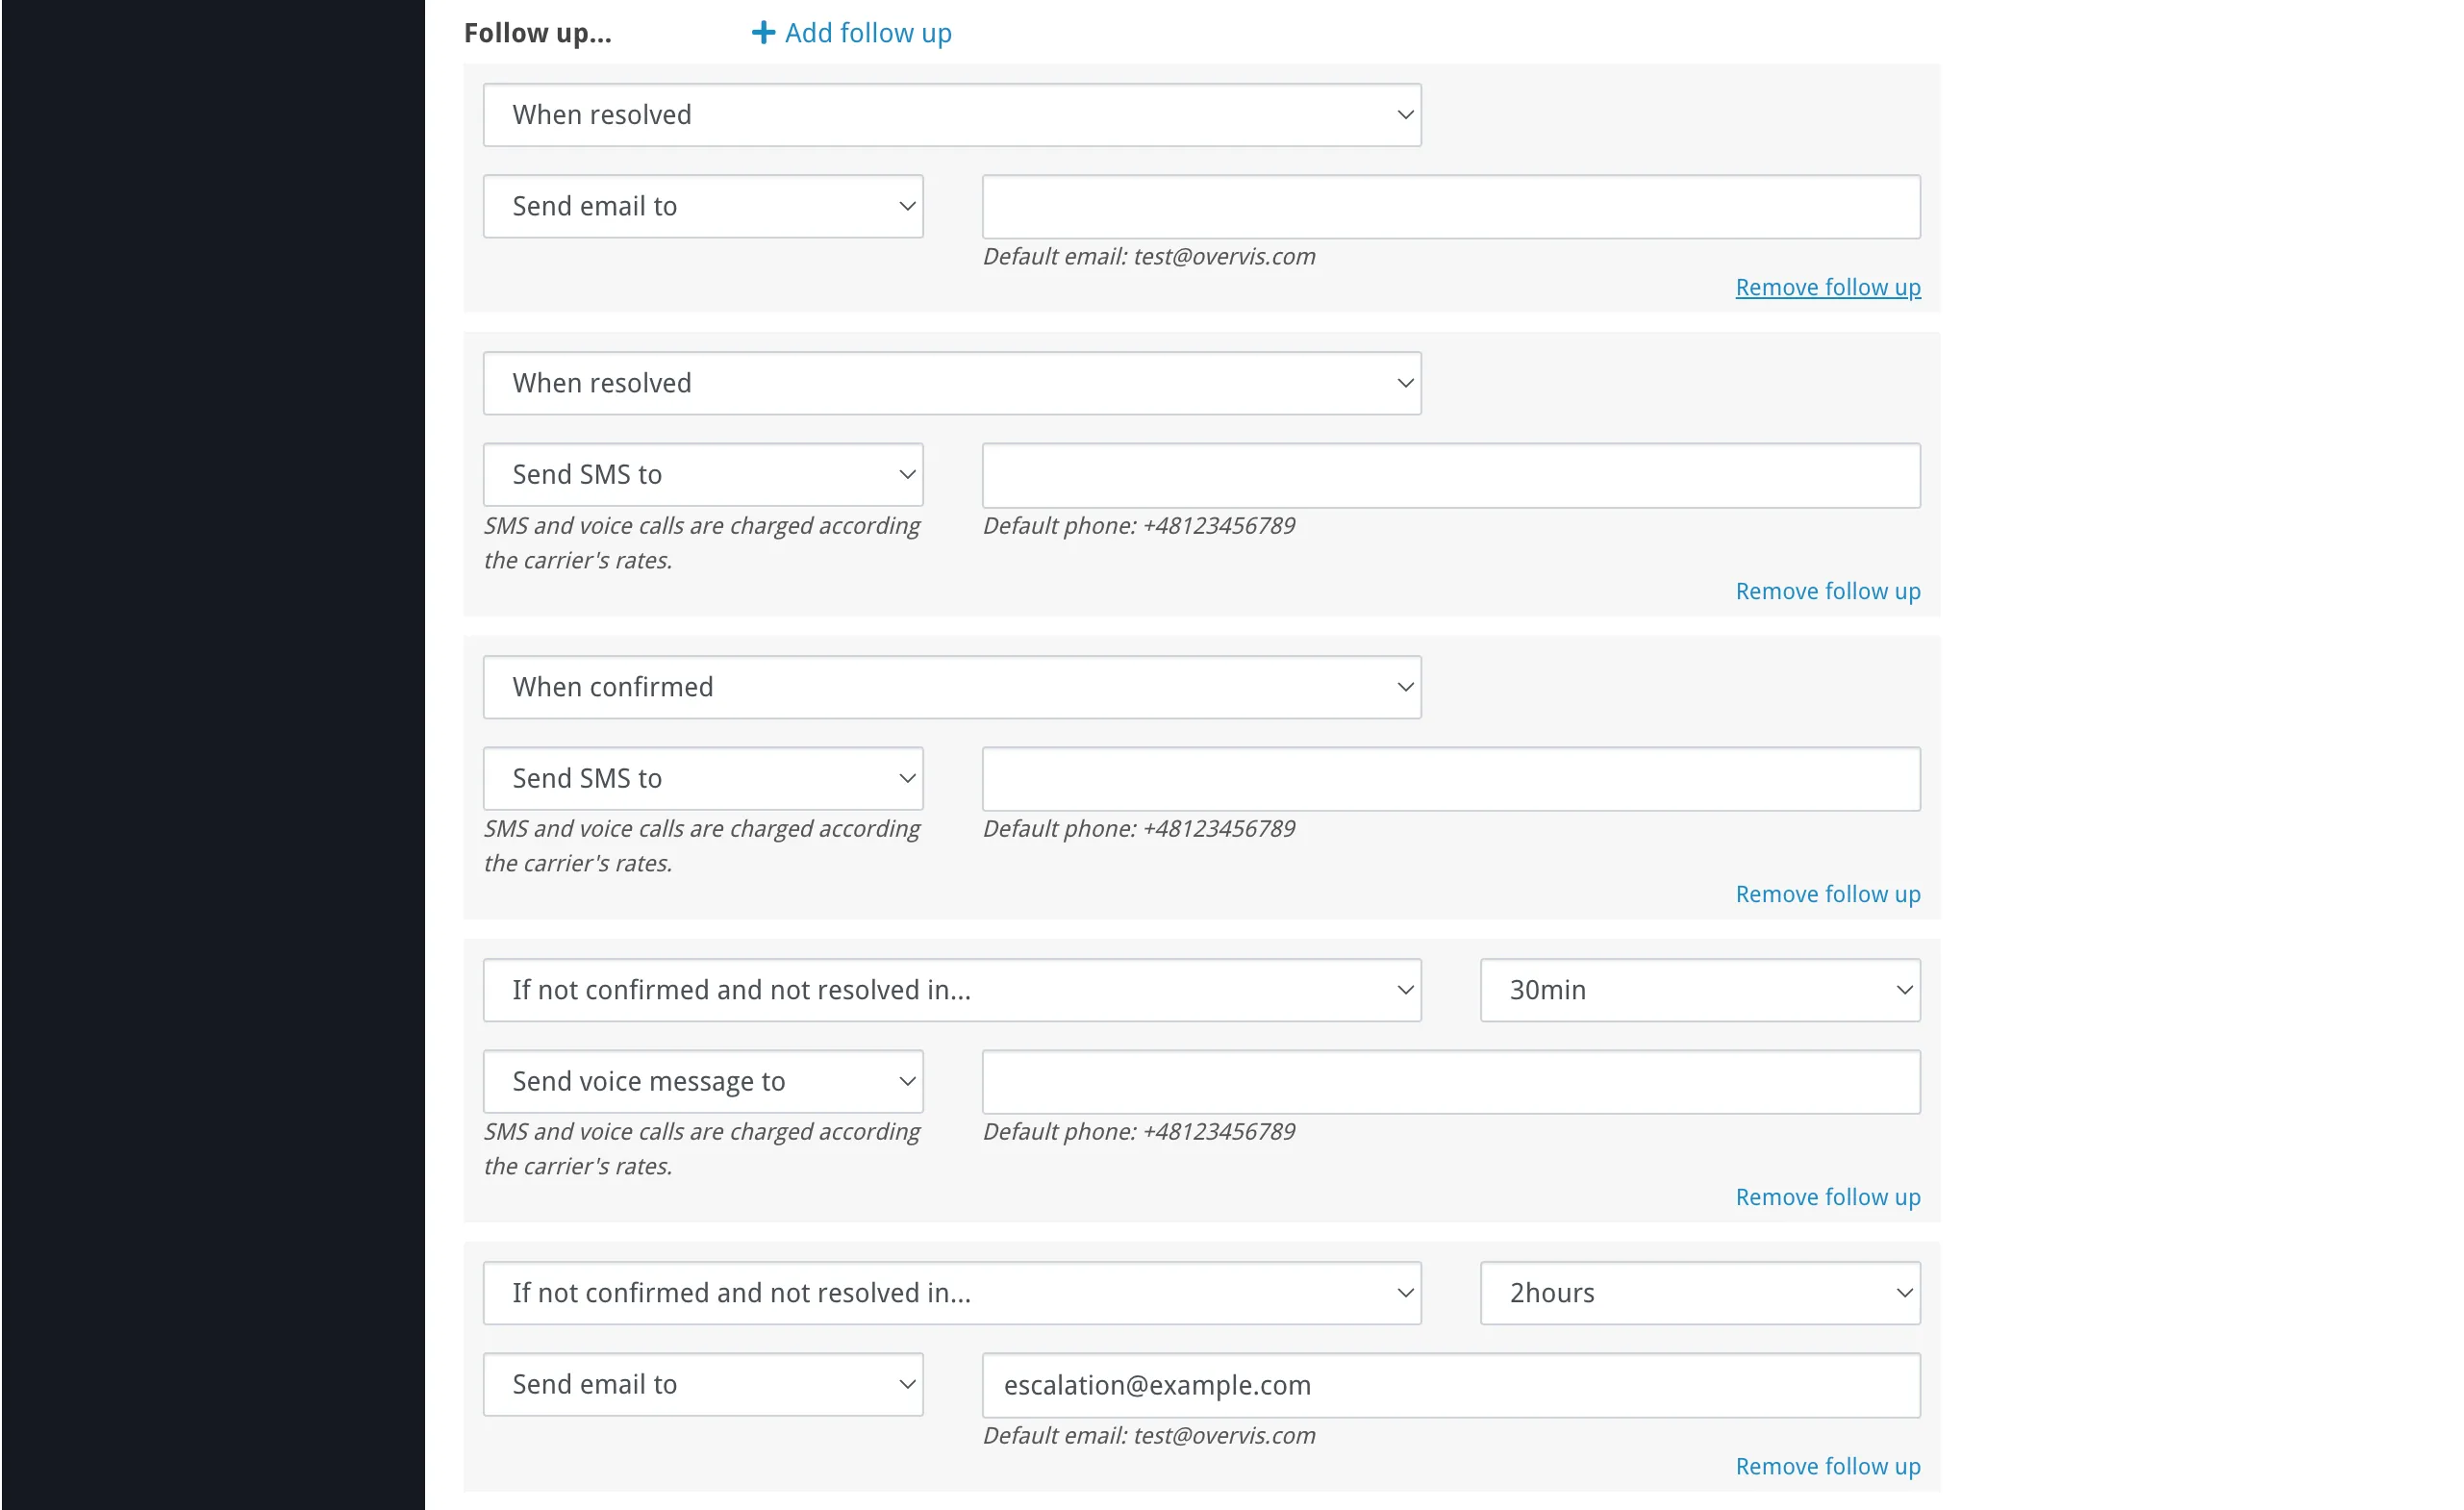
The delay is useful to avoid false alarms from brief fluctuations. If the alert resolves before the delay expires, the notification is never sent. Follow-ups — “Follow up…”Section titled “Follow-ups — “Follow up…””Follow-up actions let you escalate or notify at later stages of an incident:
For the “not confirmed” stage, you select a timeout (from 5 minutes to 48 hours). If the alert is confirmed or resolves before this timeout, the follow-up notification is cancelled. Each follow-up specifies a channel (email / SMS / voice call) and a recipient, same as actions. Log event asSection titled “Log event as”Log event as controls how the alert appears in the alert log and on the dashboard:
The level also determines the color of the bell icon on the alerts overview page when the alert is active. Alert lifecycleSection titled “Alert lifecycle”An alert goes through the following stages: flowchart LR
A["Inactive<br/>(monitoring)"] -->|"Conditions<br/>met"| B["Active<br/>(notifications sent)"]
B -->|"User<br/>confirms"| C["Confirmed"]
B -->|"Conditions<br/>clear"| D["Resolved"]
C -->|"Conditions<br/>clear"| D
D -.->|"Ready for<br/>next incident"| A
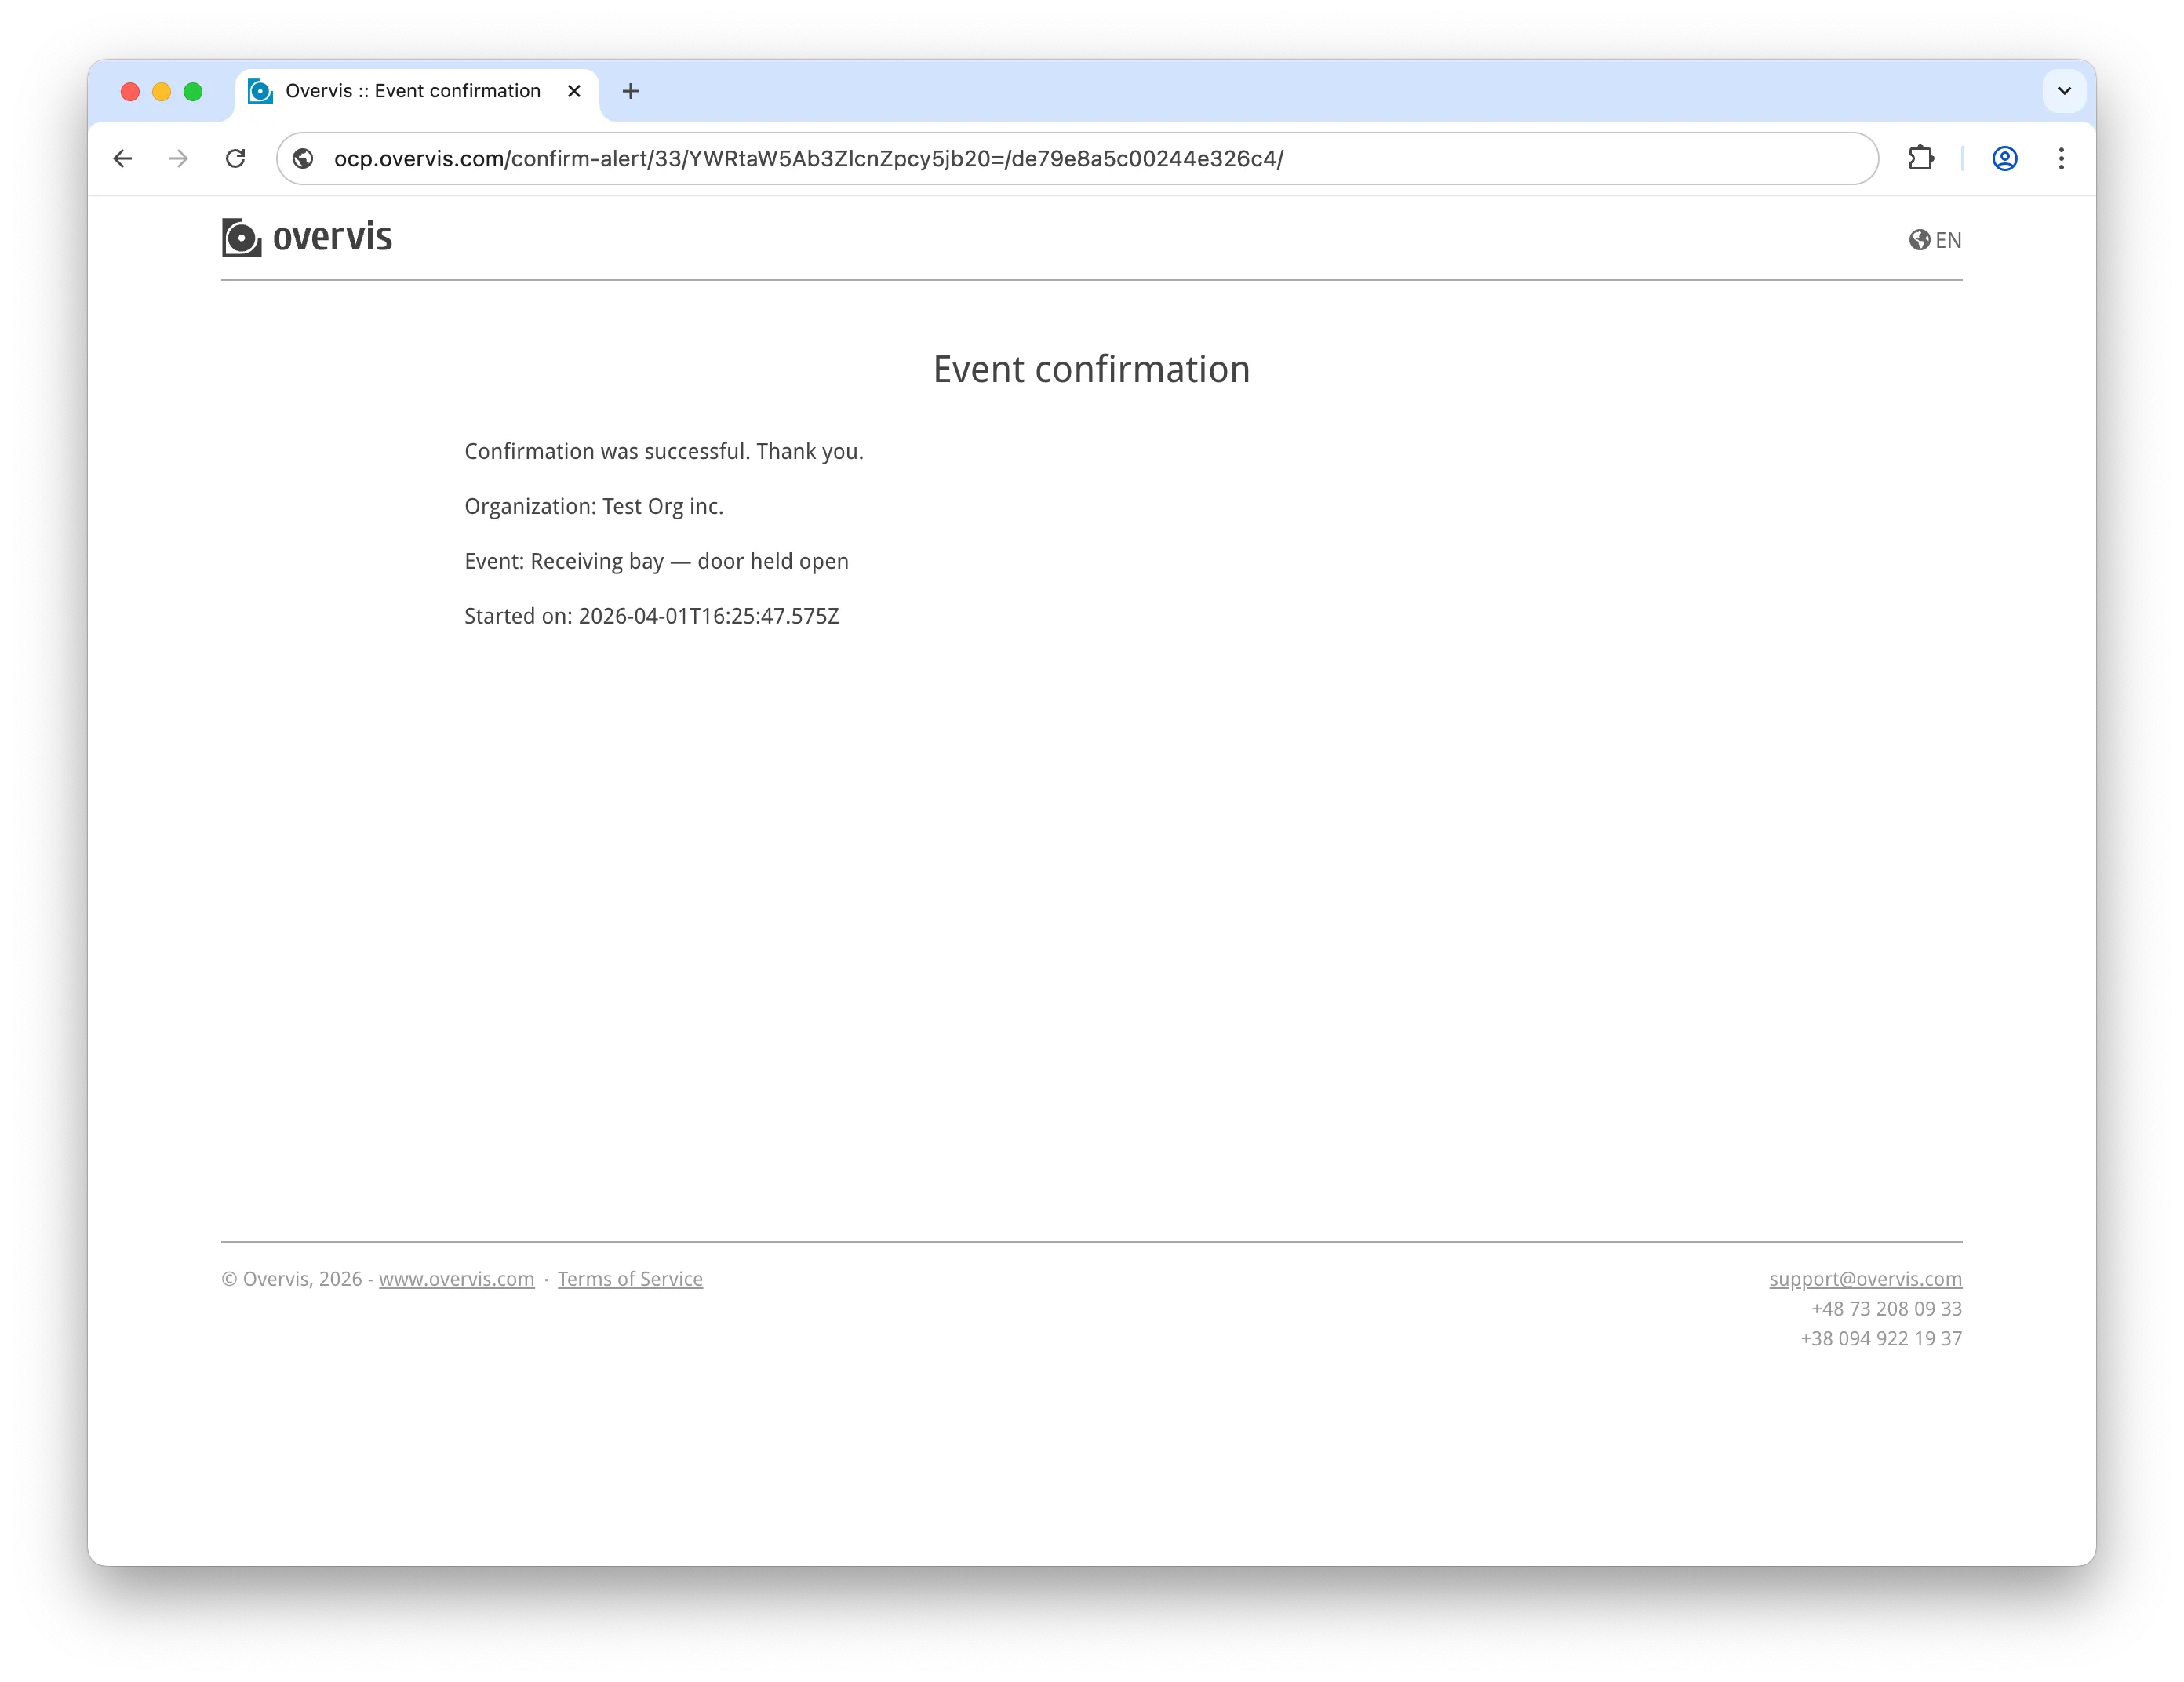
While the alert is Active and unconfirmed, escalation follow-ups (“If not confirmed and not resolved in…”) fire at their configured timeouts. This is not a separate state — the alert remains Active, and escalation can happen multiple times with different timeouts (e.g. SMS after 15 minutes, voice call after 1 hour). Each time an alert activates and later resolves, a separate alert record is created in the log. An alert can only have one active (unresolved) record at a time. Confirming alertsSection titled “Confirming alerts”When an alert fires, notifications include a way for the recipient to confirm (acknowledge) the alert:
Confirmation serves two purposes:
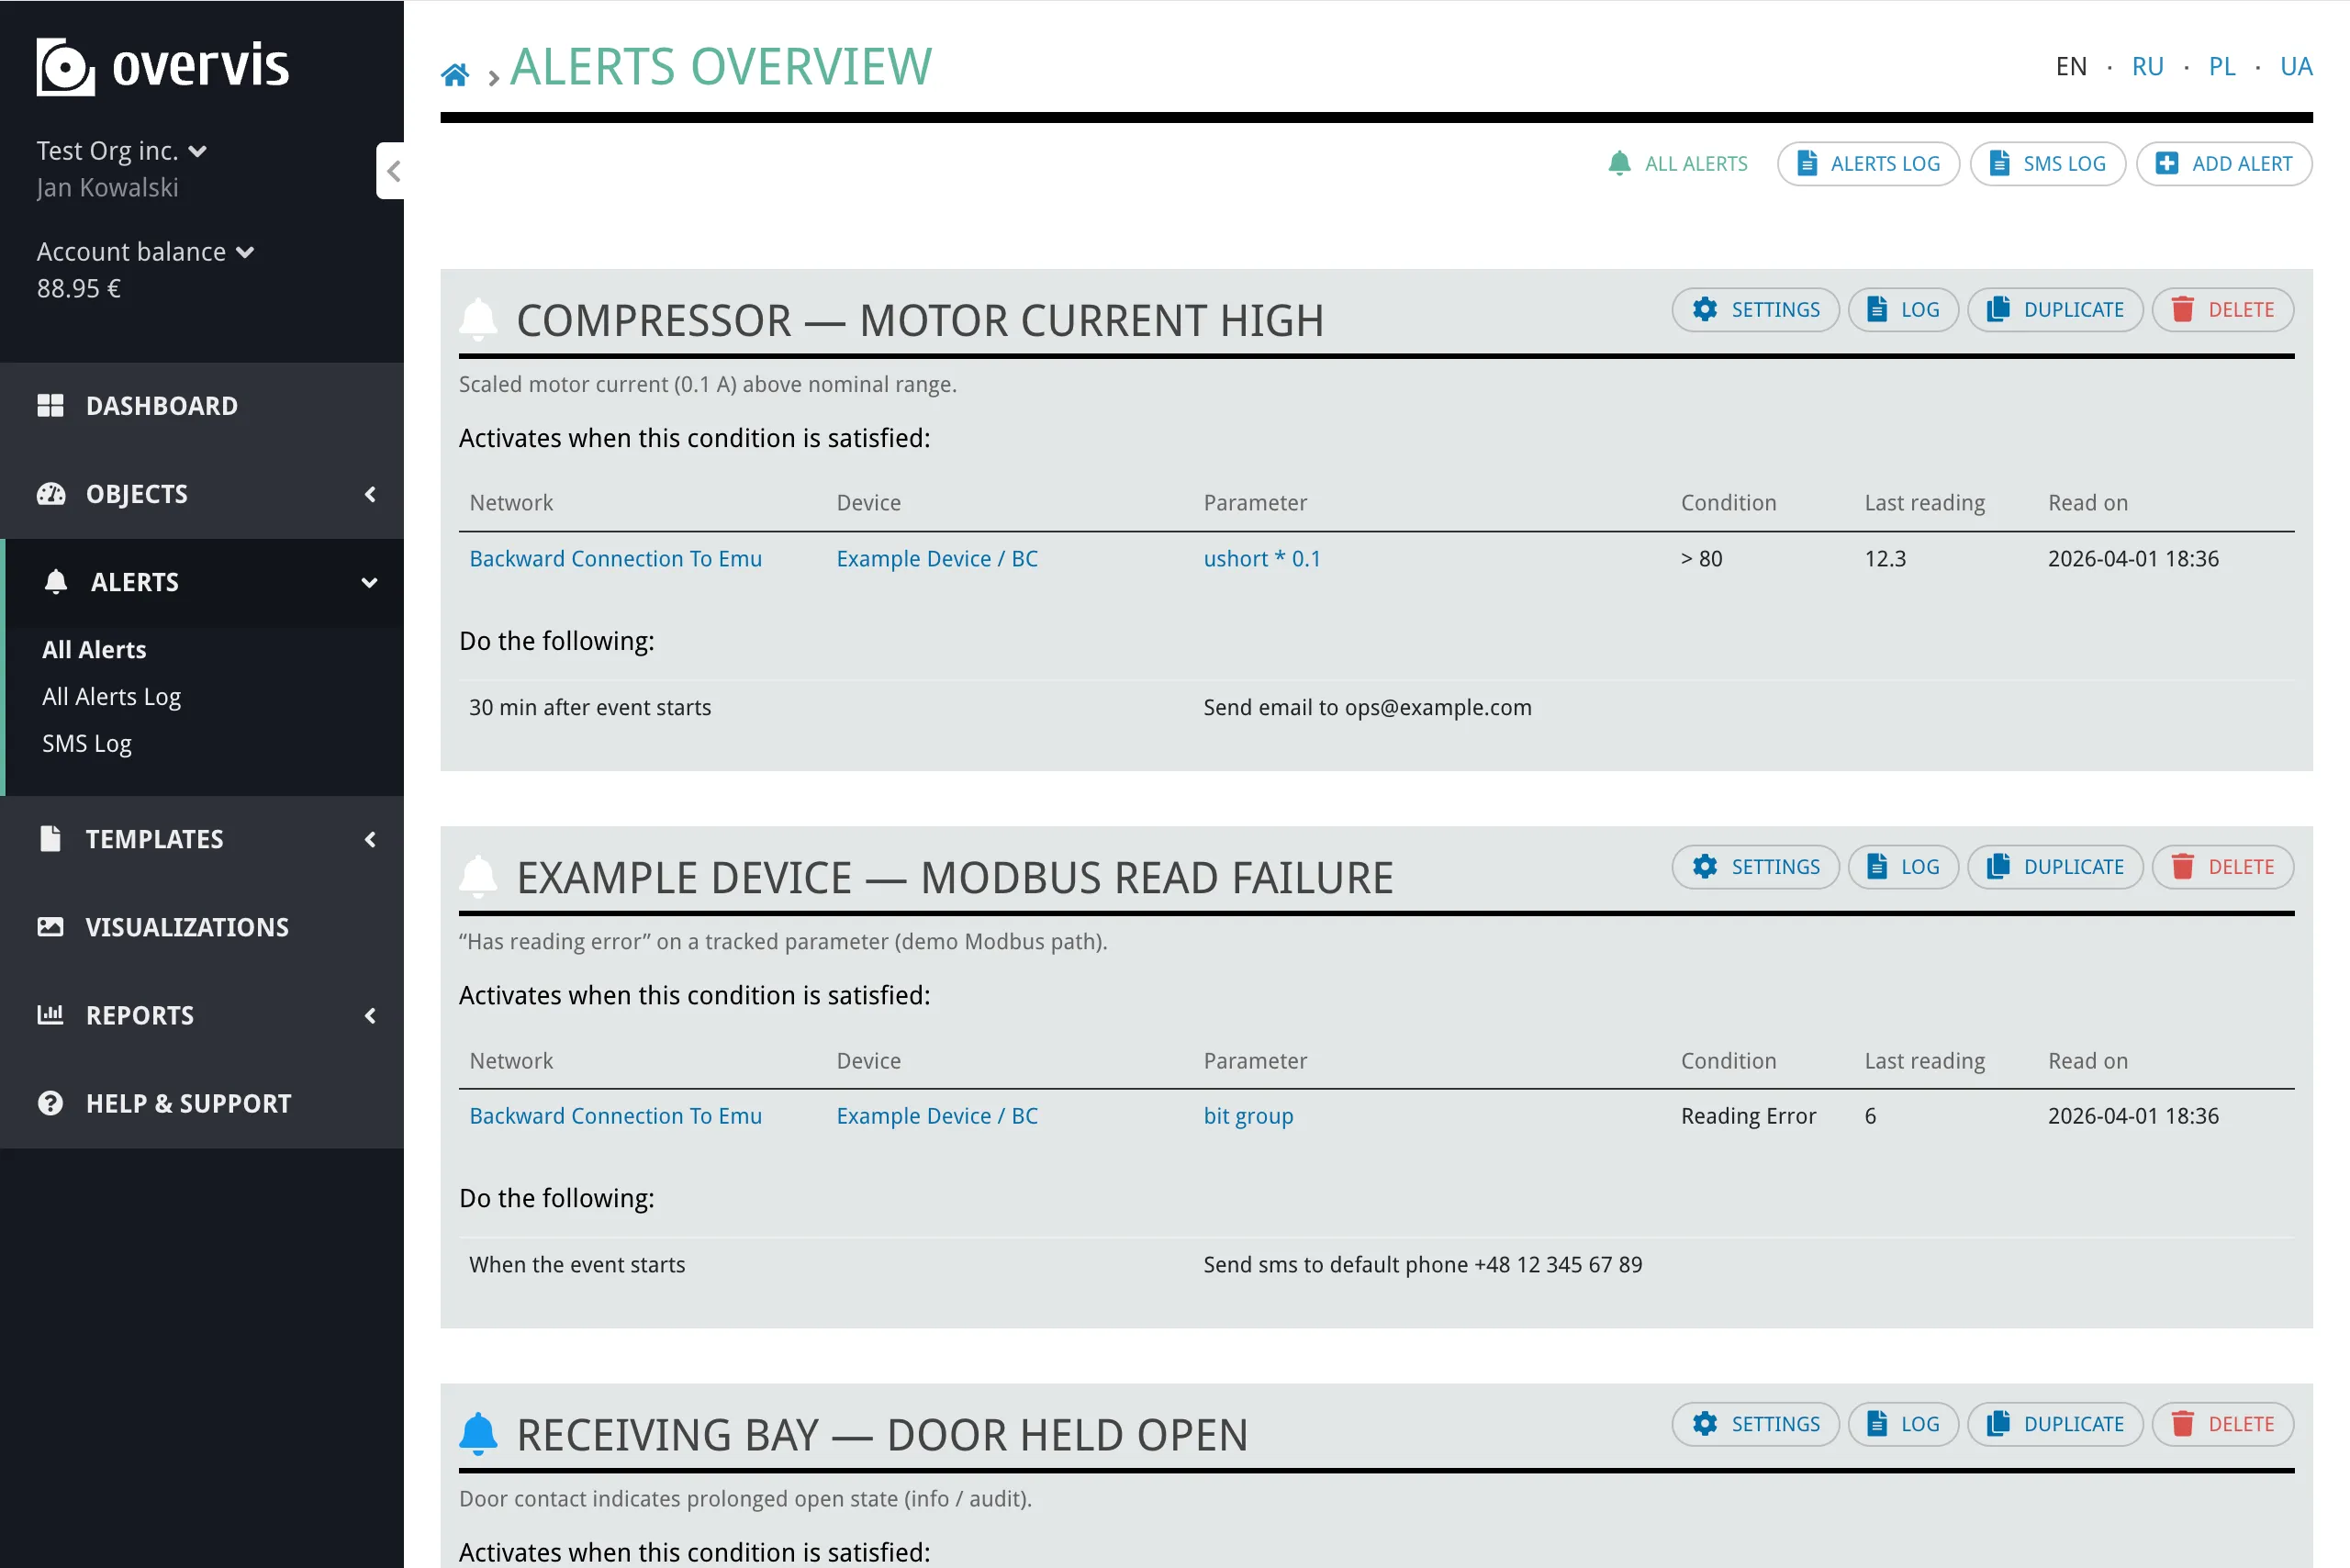
Once confirmed, the alert remains active until the conditions clear and it resolves automatically. Confirmation does not silence or resolve the alert — it only signals that a person is aware of the problem. Alerts overview pageSection titled “Alerts overview page”The Alerts page lists all alerts in the current organization. For each alert, you can see:
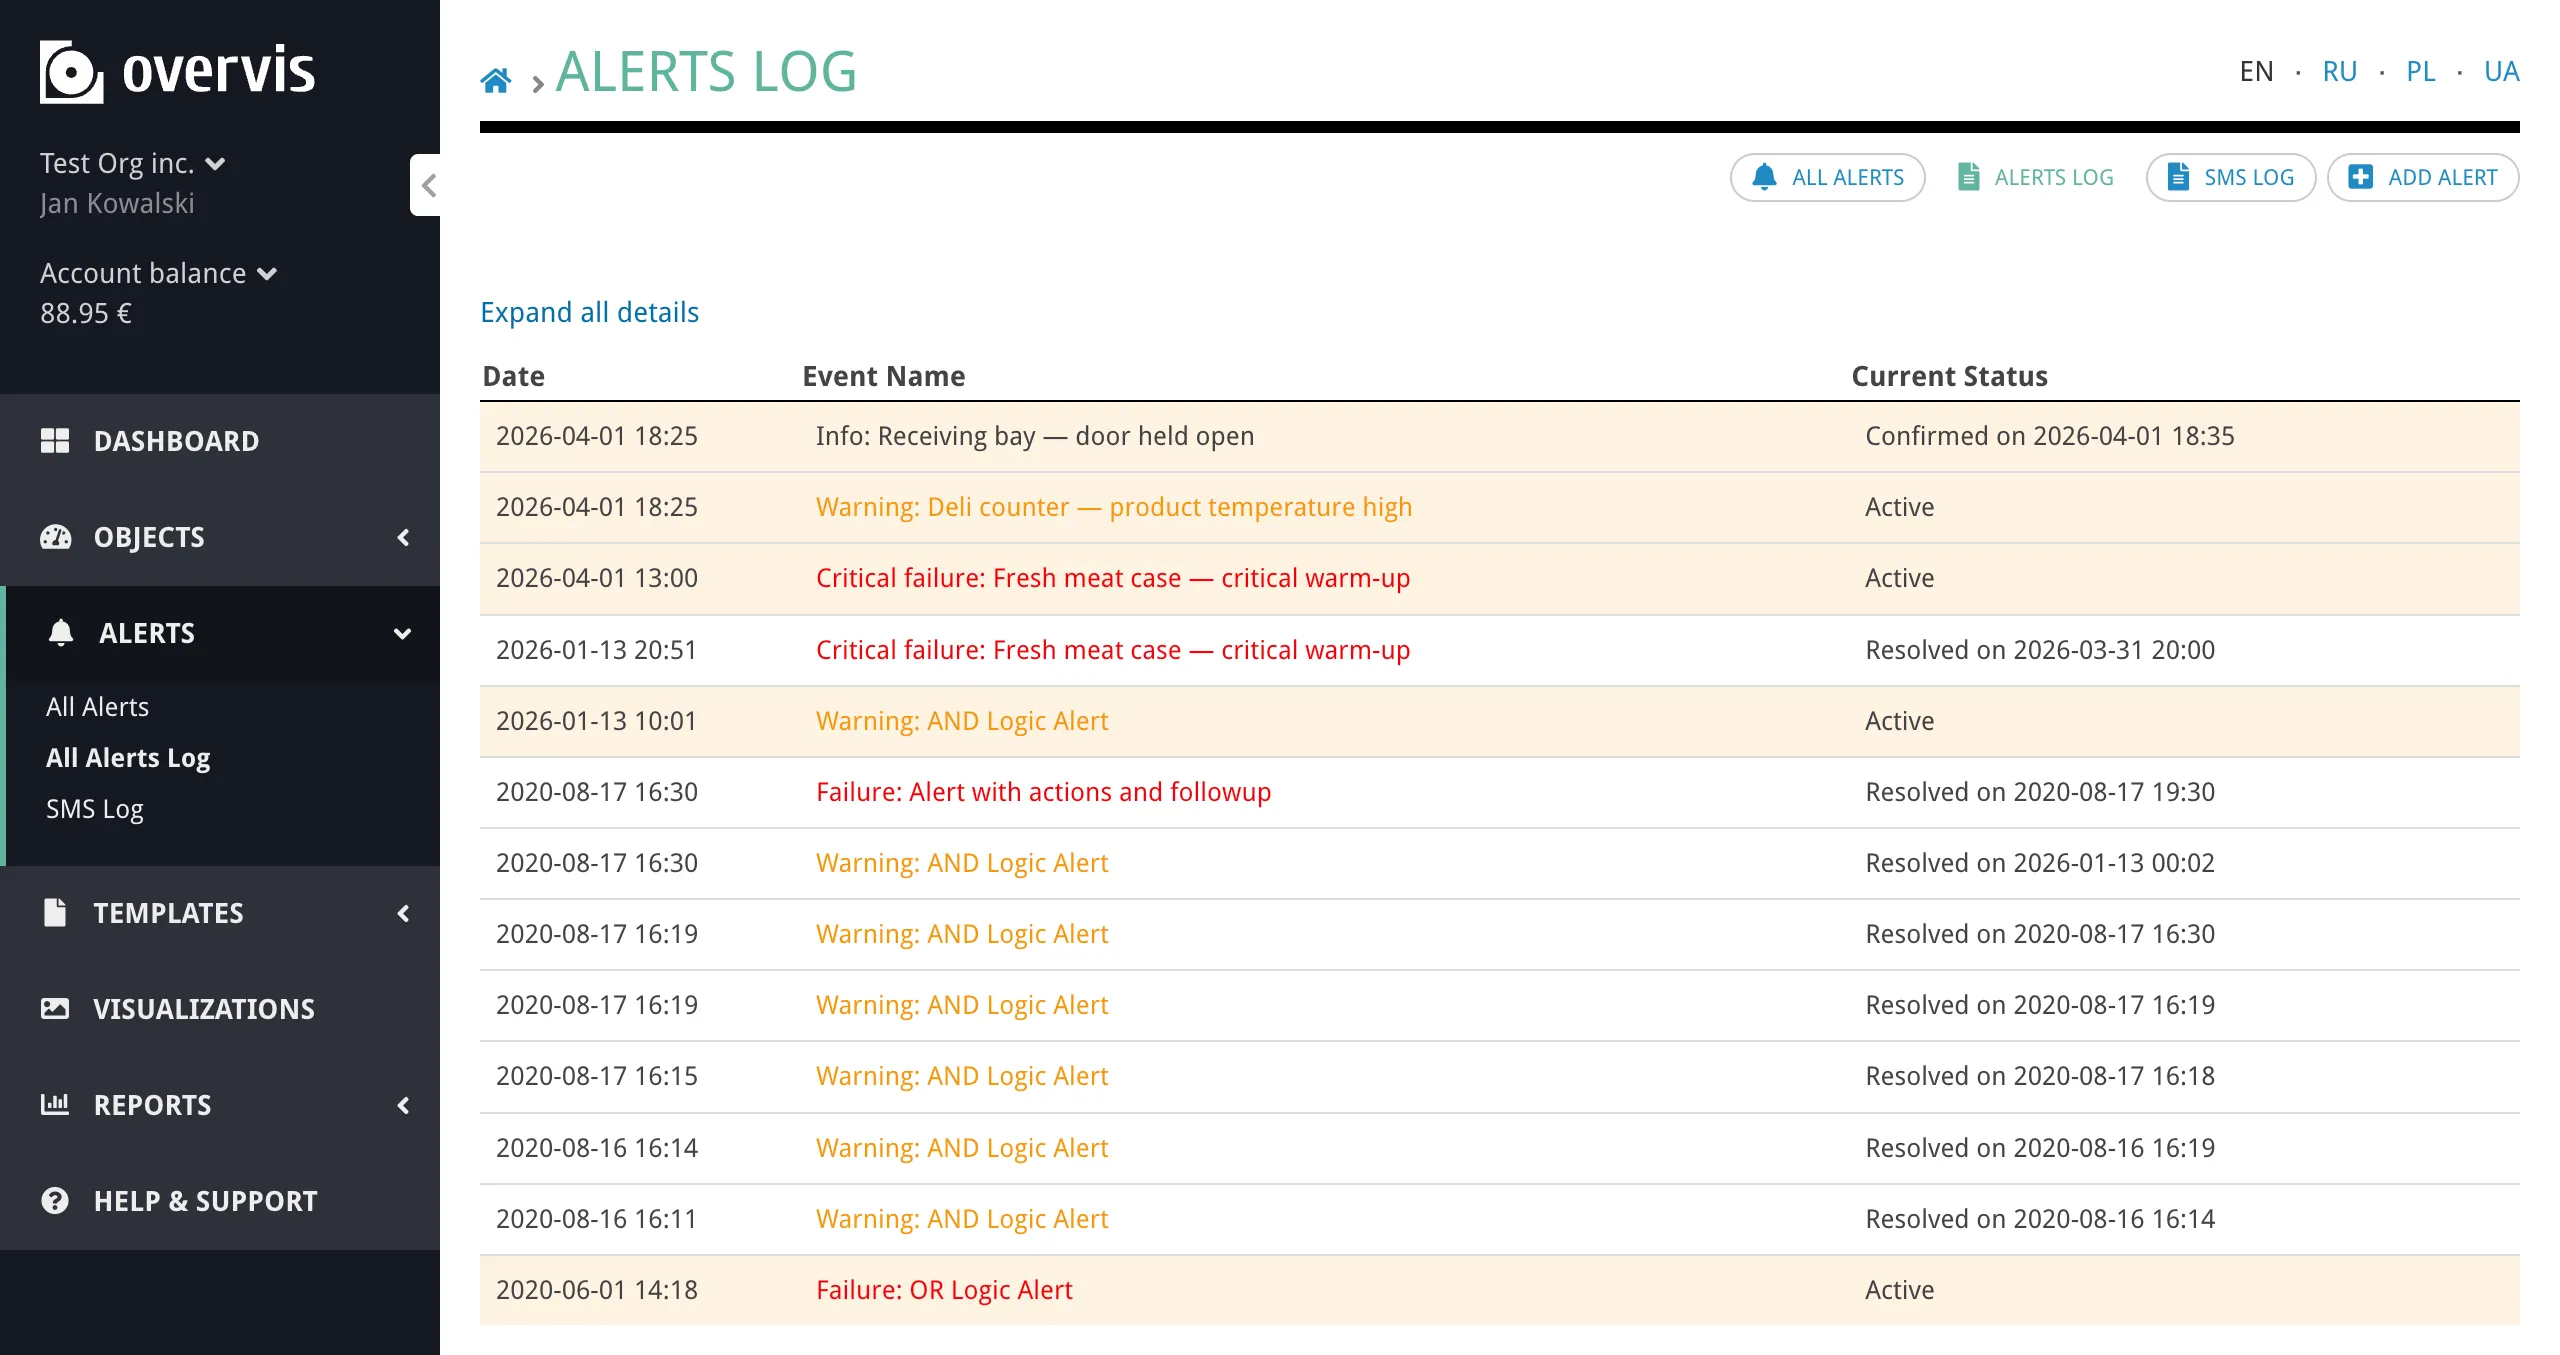
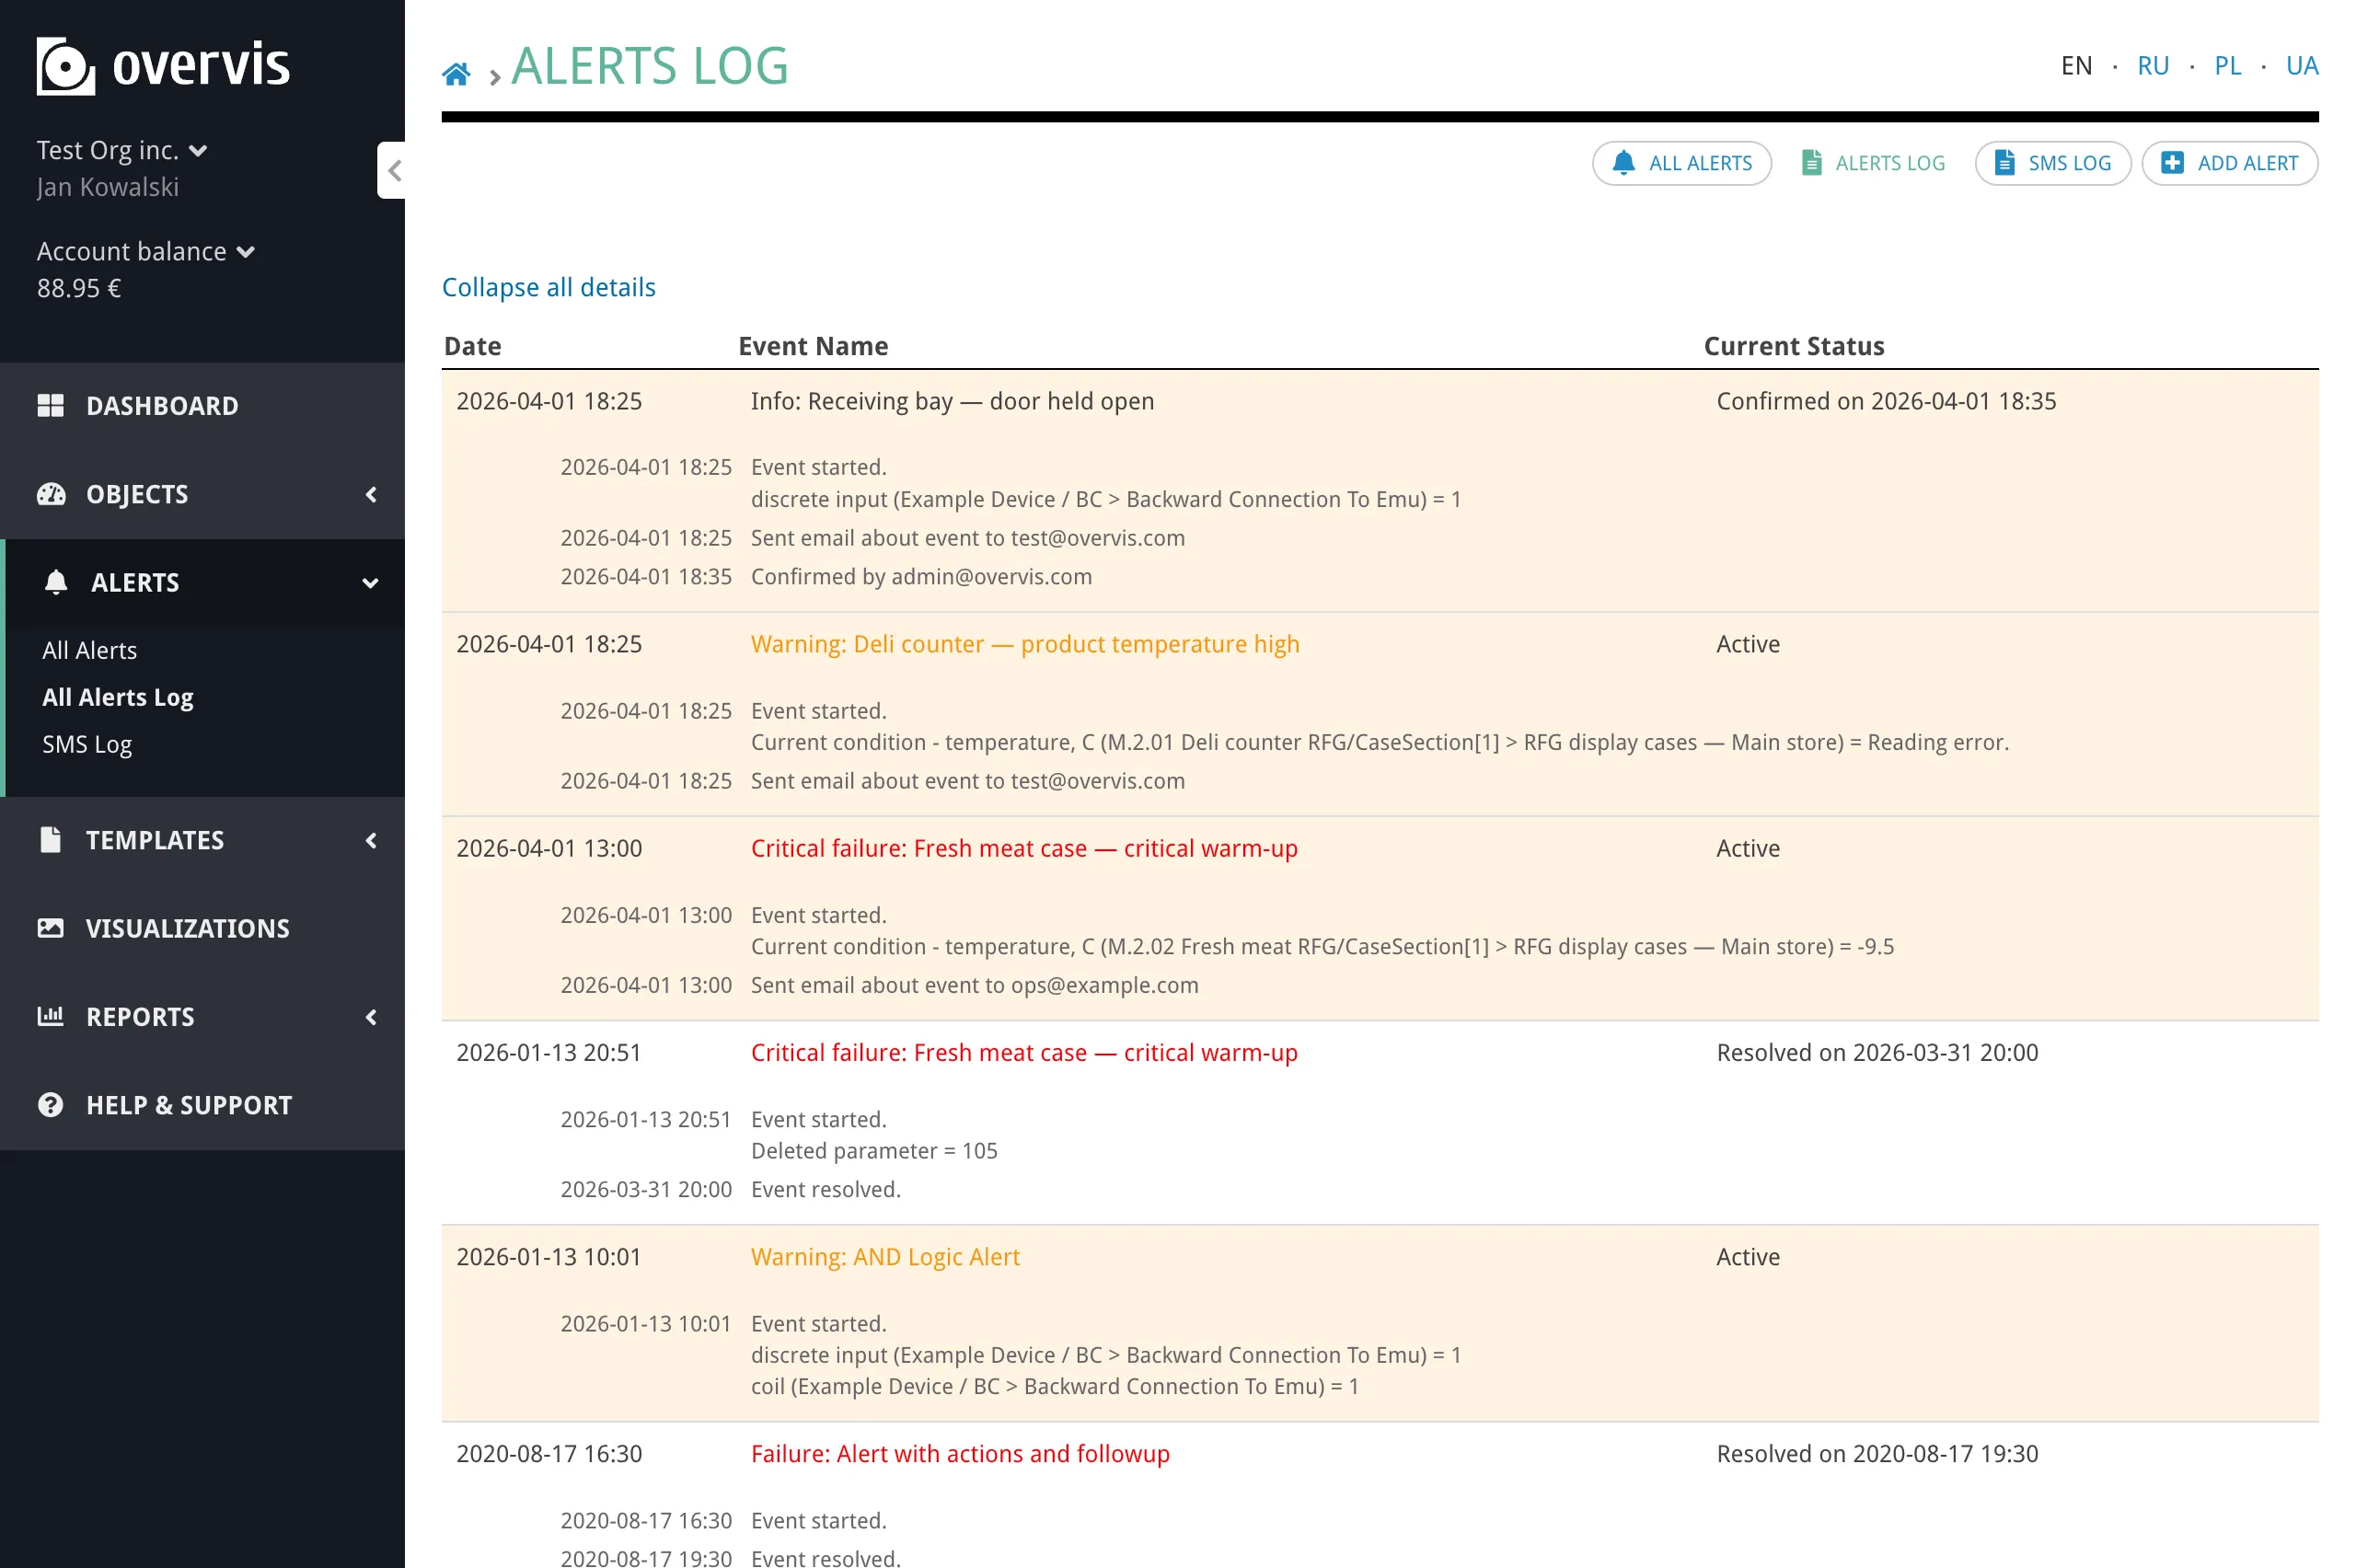
From this page, you can access each alert’s Settings, Log, Duplicate, or Delete actions. Alert logSection titled “Alert log”The alert log records every time an alert activated and resolved. There are two views:
Each log entry shows:
You can expand each entry to see timestamped details — a chronological list of what happened during the incident (conditions triggered, notifications sent, confirmation received, resolution).
Technical managers can clear the log for an alert — removing finished (resolved) records that are older than a chosen period: 1 day, 1 week, 1 month, 1 year, or all finished records. Managing alertsSection titled “Managing alerts”
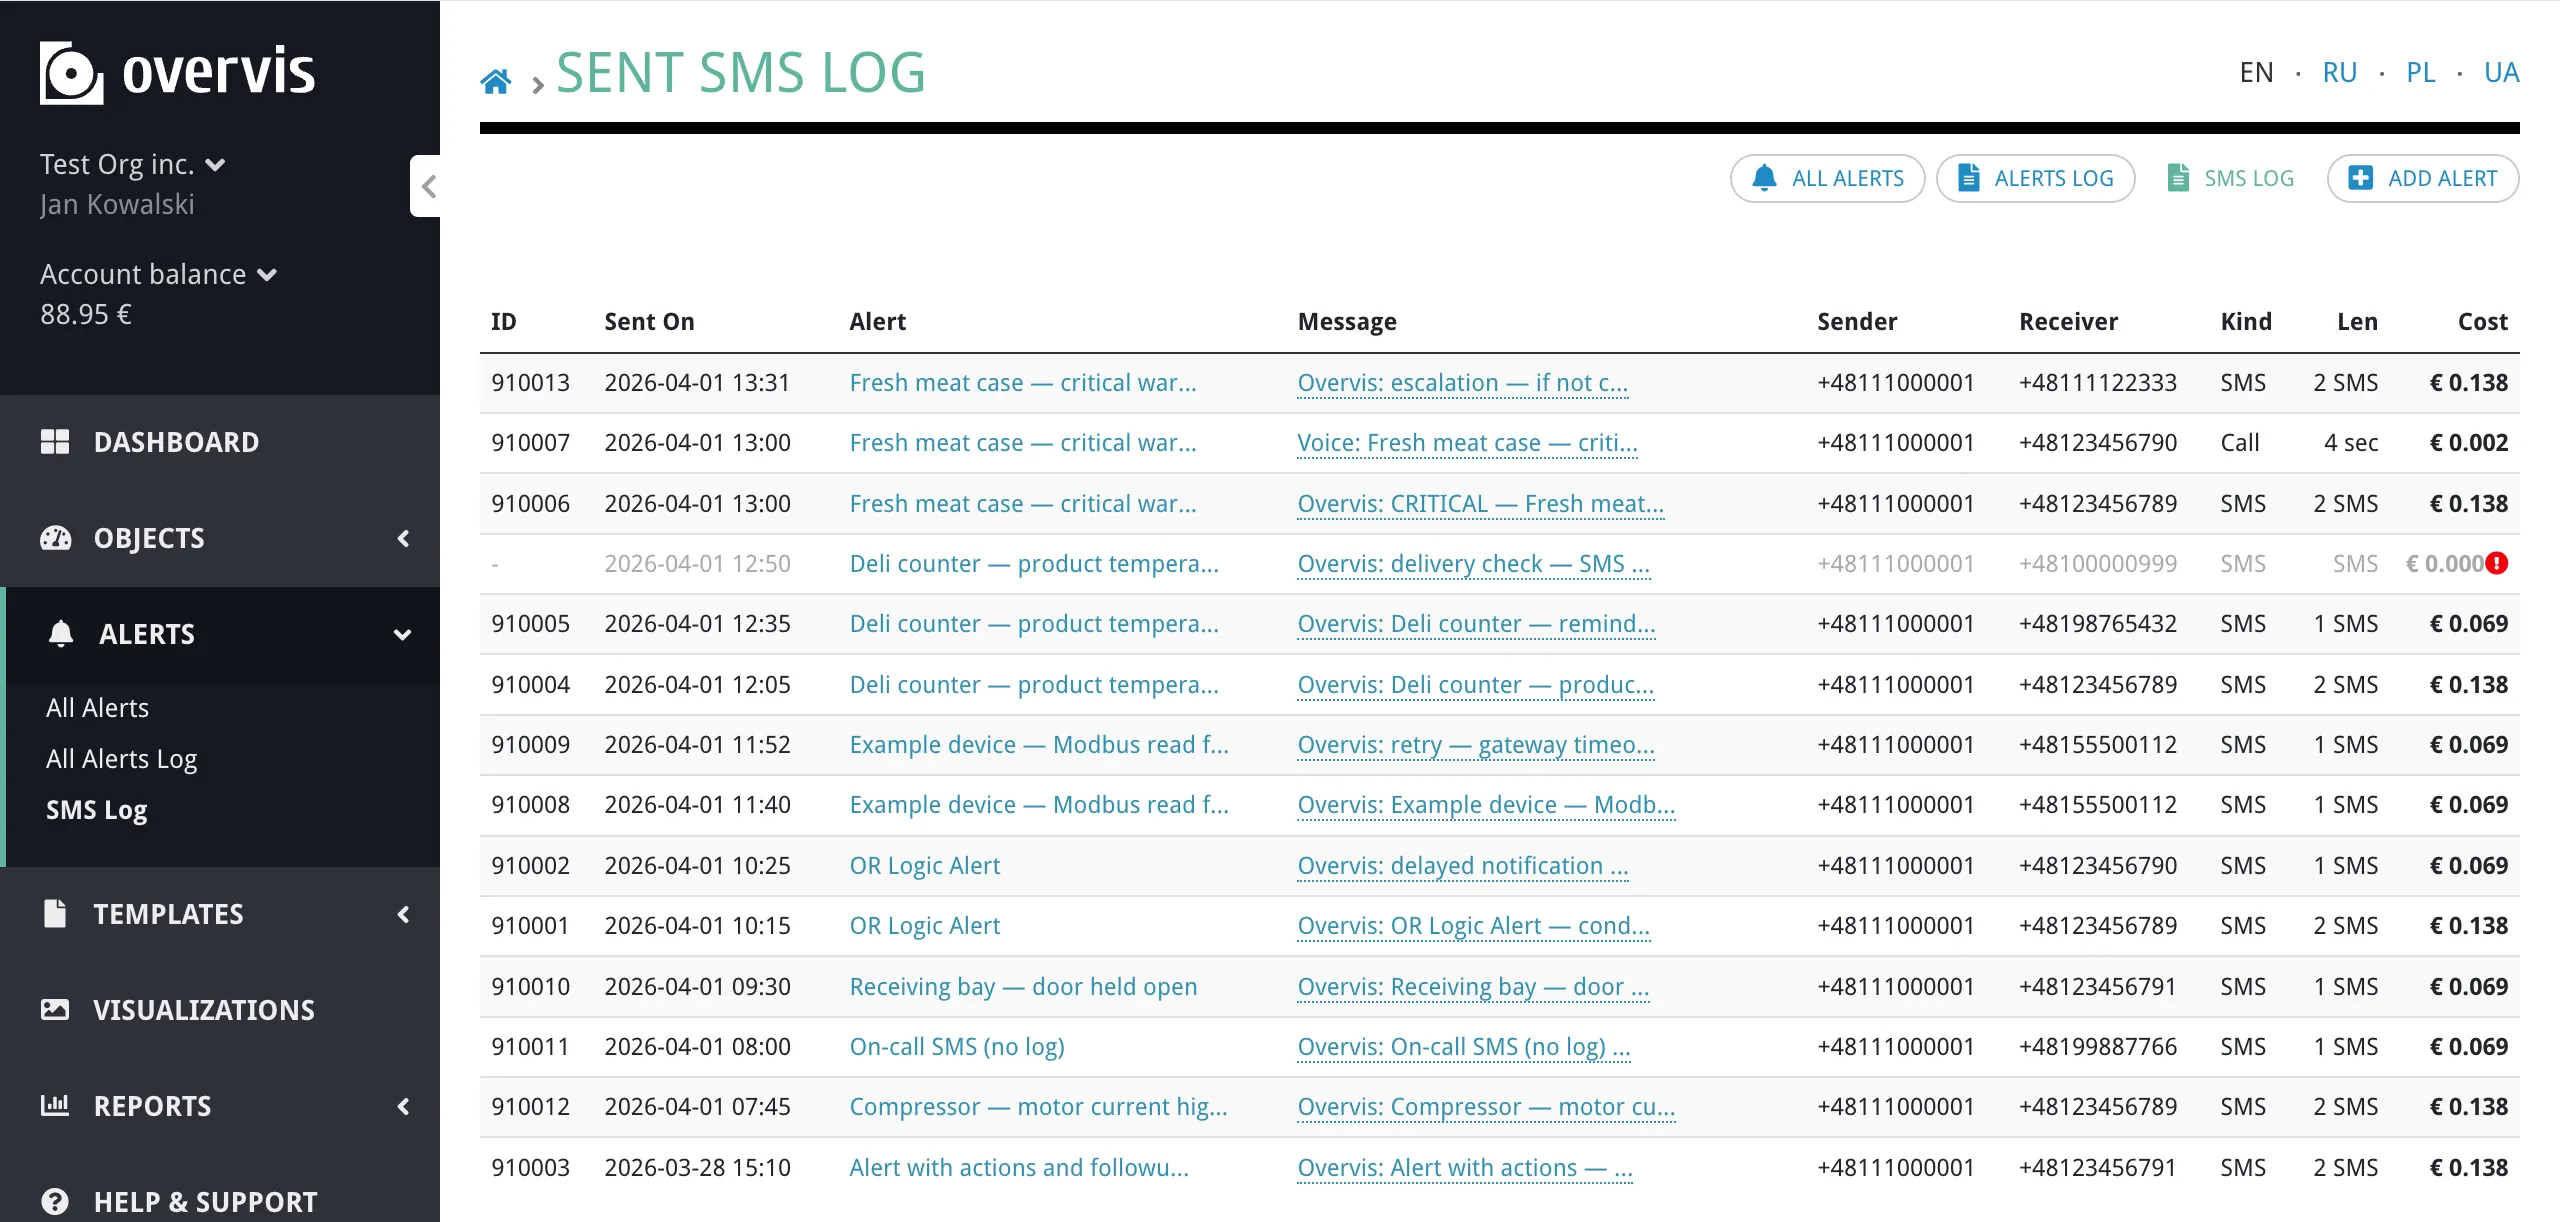
Duplicating, deleting, and clearing the log require the technical manager role. Alert templatesSection titled “Alert templates”If you manage many similar devices, you can include alert definitions in a device template. When the template is applied to a device, Overvis creates the alerts automatically — saving you from configuring the same thresholds and actions for each device individually. Alert templates are written in YAML and attached to the device template either through the web interface or in the template Excel file. See the Alerts Templates Reference for the YAML syntax and examples. SMS logSection titled “SMS log”The SMS log (accessible from the Alerts section in the sidebar as “SMS Log”) shows a record of all SMS and voice call messages sent by the alert system. Each entry includes:
This is useful for verifying that notifications were delivered and for tracking SMS and voice call usage and costs. TroubleshootingSection titled “Troubleshooting”Alert is not triggeringSection titled “Alert is not triggering”The parameter is not tracked. Only tracked parameters are polled for readings. If the parameter is not tracked, Overvis has no values to compare. Go to the device page and make sure the parameter has the “Tracked” flag enabled. See Behavior Flags. The device or network is disabled. Disabled devices and networks do not process alerts. Check that both the network and the device are enabled. The parameter has no recent readings. If the parameter has never been read (e.g. the device has not been polled yet), conditions cannot evaluate. Check the “Last reading” column on the alerts overview page — if it shows ”-”, the parameter has not been read yet. Threshold is in wrong units. The threshold is compared against the displayed value (after multiplier). If you enter a raw register value instead of the engineering value, the condition may never match. Make sure the threshold uses the same units shown on the device page. Condition logic mismatch. If you have multiple conditions with “Every condition should be satisfied” (AND), all of them must be true simultaneously. Check whether one condition is preventing the alert from activating. Not receiving notificationsSection titled “Not receiving notifications”No default recipient configured. If you left the recipient field empty, Overvis uses the organization’s default notification email or phone. If neither is configured, the notification is silently skipped. Set default recipients in organization settings, or enter an explicit recipient in the alert action. Email going to spam. Check your spam or junk folder. Add the Overvis notification sender address to your email whitelist. SMS is disabled for the organization. If SMS sending has been disabled (e.g. due to billing), SMS and voice call notifications will not be delivered. Check if a notice about disabled SMS appears at the top of the Alerts page. Delay has not expired yet. If you configured a delay (e.g. “If not resolved in 30 min”), the notification will not be sent until the delay period passes. If the alert resolves before that, the notification is cancelled. Too many false alarmsSection titled “Too many false alarms”Use action delays. Set a delay like “If not resolved in 5 min” or longer. Brief fluctuations that resolve quickly will not trigger notifications. Adjust thresholds. If the threshold is too close to the normal operating range, small variations will trigger the alert. Add a margin to account for normal fluctuation. Use AND logic for multiple conditions. Requiring all conditions to be satisfied simultaneously reduces false positives from isolated spikes. ”Resolved” notifications not being sentSection titled “”Resolved” notifications not being sent”“When resolved” follow-ups are only sent if at least one activation notification was already sent or scheduled. If the alert activated and resolved too quickly (before any “Do…” action fired), no resolution notification is sent. This is intentional — it avoids orphan “resolved” messages for events that were too brief to notify about. Alert confirmation not workingSection titled “Alert confirmation not working”Email confirmation link. Make sure you are clicking the confirmation link from the original notification email. Links are specific to each alert event — a link from a previous event will not work for a new one. SMS confirmation code. Reply with the 5-digit code to the same phone number that sent the SMS. The code is valid only while the alert is active and has not been confirmed yet. Alert already resolved. If the alert resolved before you confirmed, the confirmation page will indicate that the event has already been resolved. Confirmation is no longer needed in this case. Common questionsSection titled “Common questions”Can different people receive different alerts?Section titled “Can different people receive different alerts?”Yes. Each action and follow-up has its own recipient field. You can configure one alert to email an operator and another to SMS a manager. Within a single alert, you can add multiple actions to notify different people through different channels. What happens if the device goes offline?Section titled “What happens if the device goes offline?”If a device cannot be reached, parameters will have reading errors. You can use the “Has reading error” condition to be notified when a device stops responding. After the system starts, reading error conditions are silenced for approximately 2 minutes to avoid false alarms during startup. Can I temporarily disable an alert without deleting it?Section titled “Can I temporarily disable an alert without deleting it?”There is no “pause” button in the alert settings. To temporarily stop an alert from firing, you can either remove the conditions or actions and restore them later, or set all actions to “Nothing” (no notification). Alternatively, duplicating the alert before editing preserves the original configuration for easy restoration. How quickly does Overvis detect a condition?Section titled “How quickly does Overvis detect a condition?”Overvis evaluates alert conditions immediately after each parameter reading. The detection speed depends on the polling interval configured for the network — typically a few seconds to a minute. There is no additional delay between a parameter reading and the condition evaluation. What is the difference between actions and follow-ups?Section titled “What is the difference between actions and follow-ups?”Actions (“Do…”) fire when the alert first activates. They are the initial notifications. You can add a delay to them (e.g. “If not resolved in 10 min”) to filter out brief events. Follow-ups (“Follow up…”) fire at later stages: when the alert resolves, when someone confirms it, or when nobody has confirmed it within a timeout. They are used for escalation and resolution tracking. Does clearing the log affect active alerts?Section titled “Does clearing the log affect active alerts?”No. Clearing the log only removes resolved (finished) alert records that are older than the selected period. Active alert records and the alert configuration itself are not affected. Can I see what notifications were sent?Section titled “Can I see what notifications were sent?”Yes. Expand an alert log entry to see a detailed timeline of all notifications sent during the incident, including timestamps and recipients. For SMS and voice call delivery details, check the SMS Log page. Related documentationSection titled “Related documentation”
|
| | ||||||||||||||||||||||||||||||||
|---|---|---|---|---|---|---|---|---|---|---|---|---|---|---|---|---|---|---|---|---|---|---|---|---|---|---|---|---|---|---|---|---|
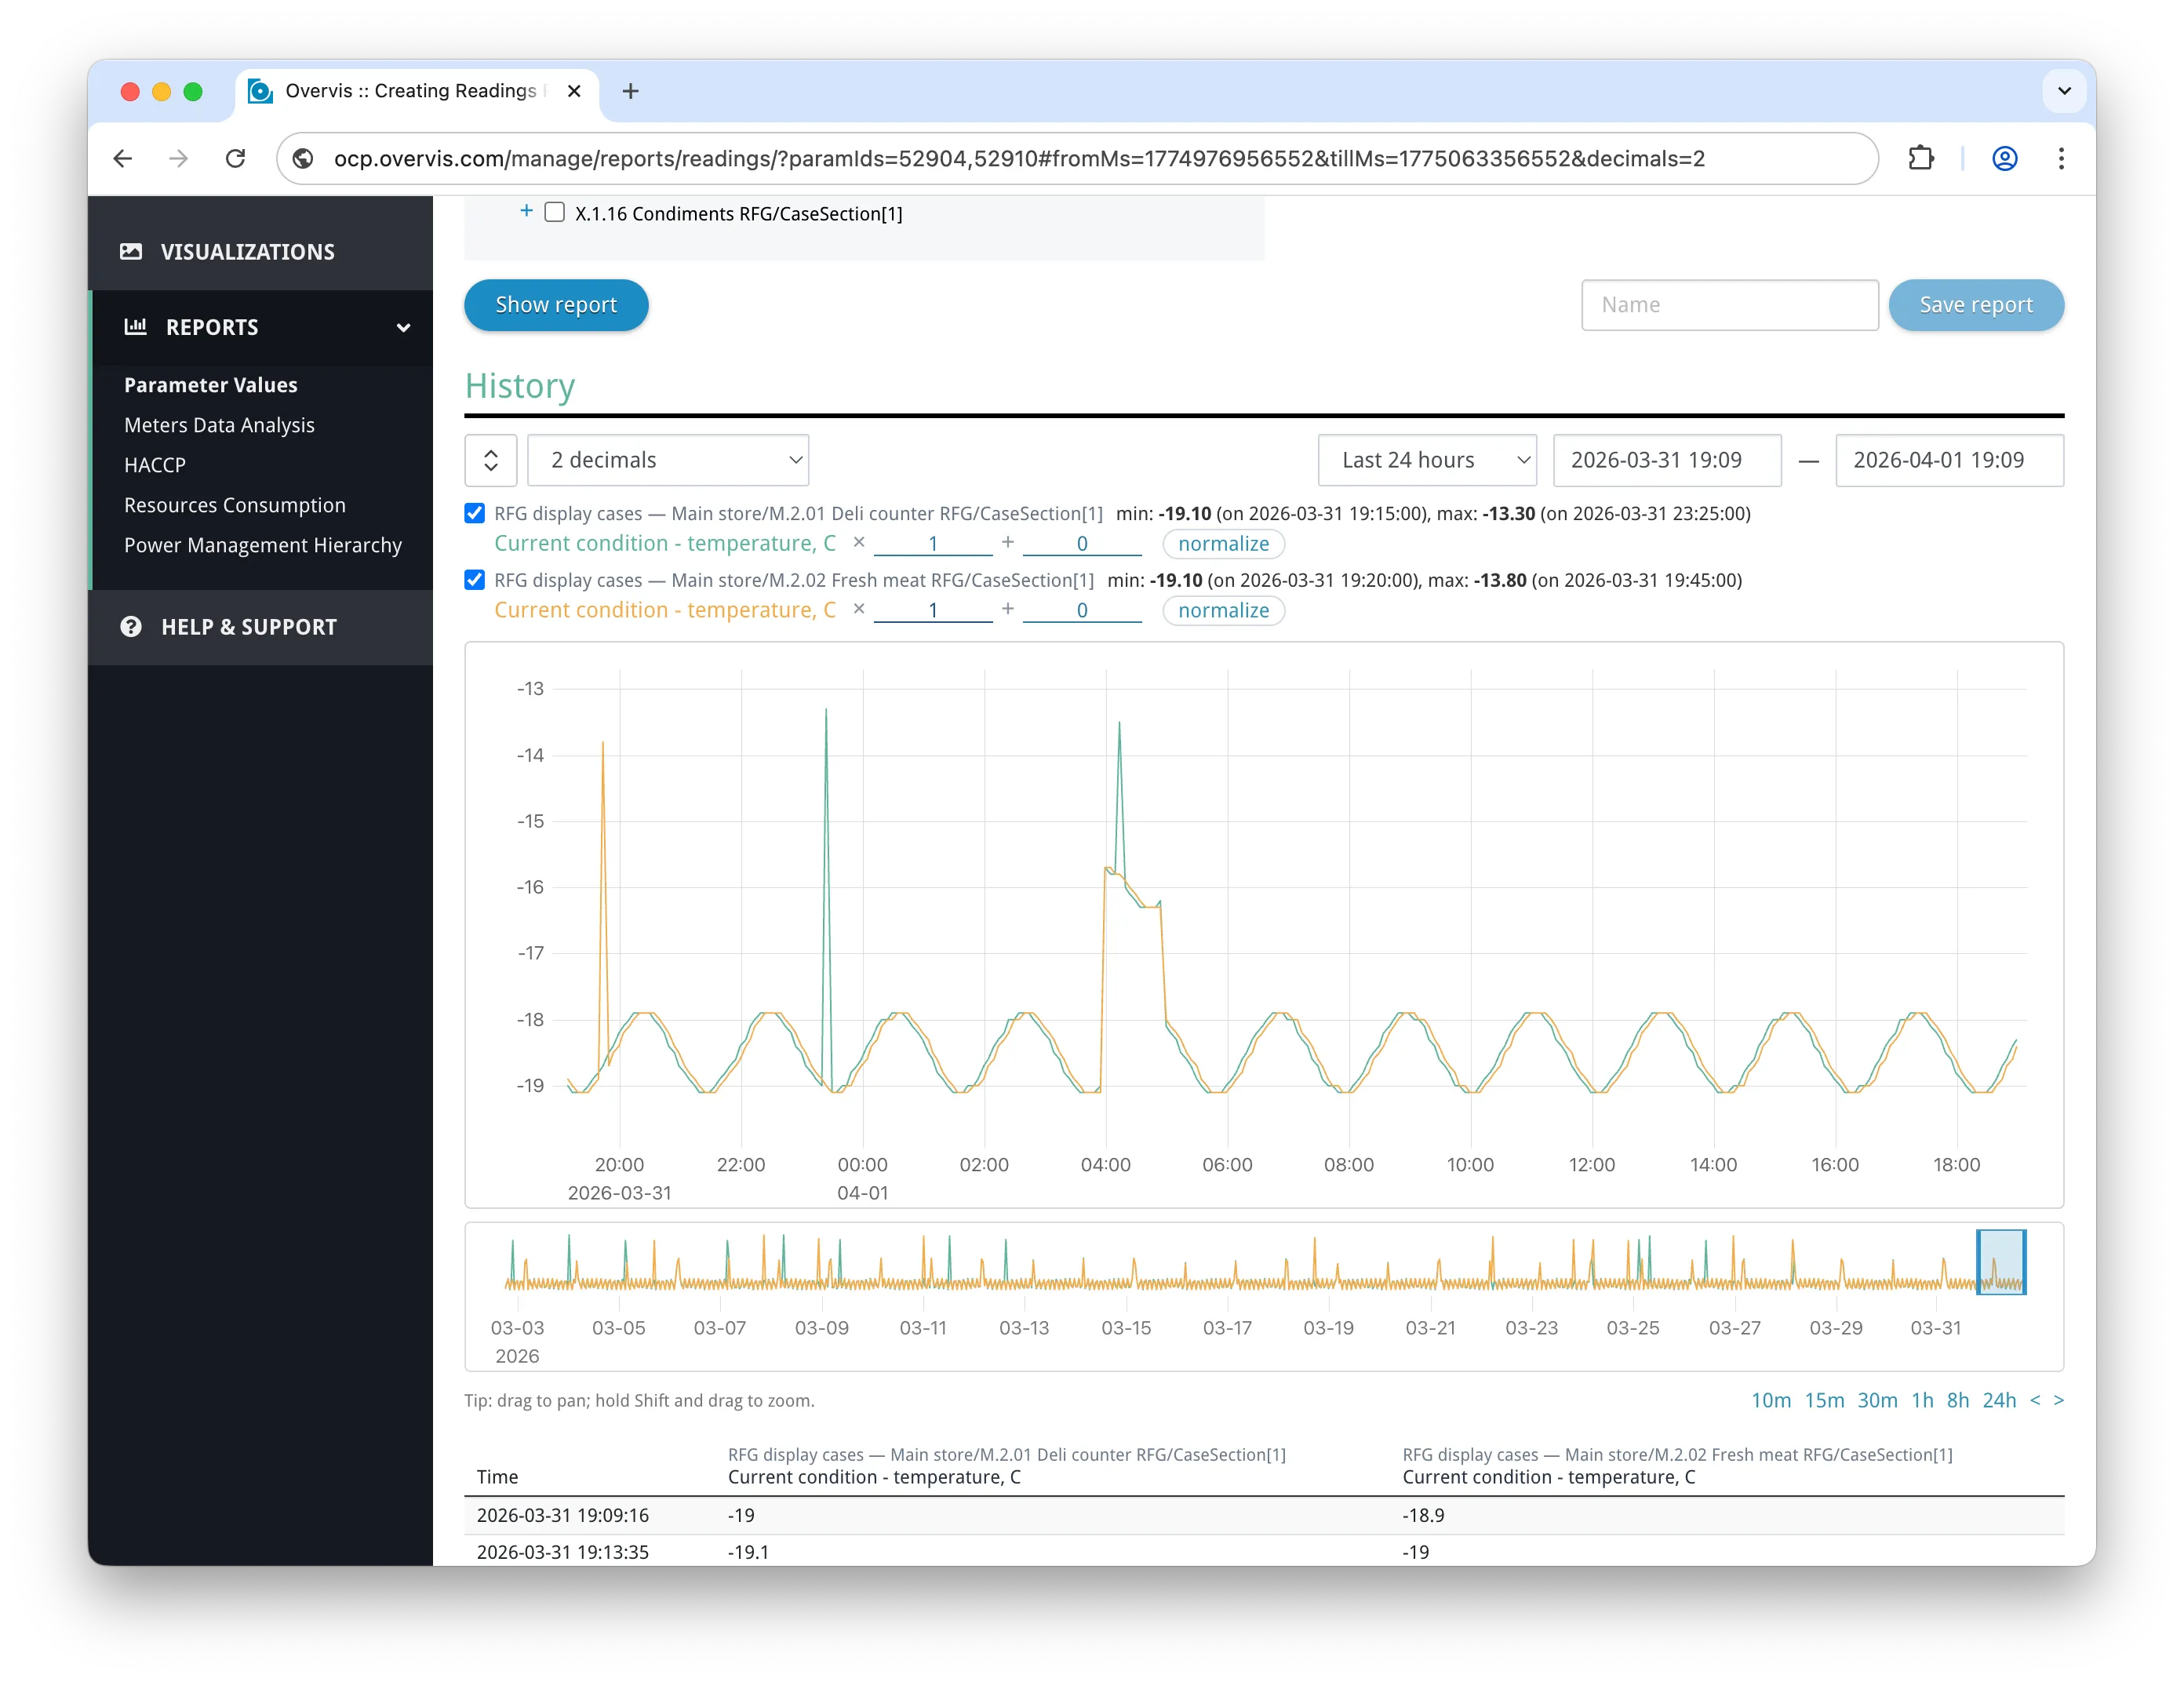
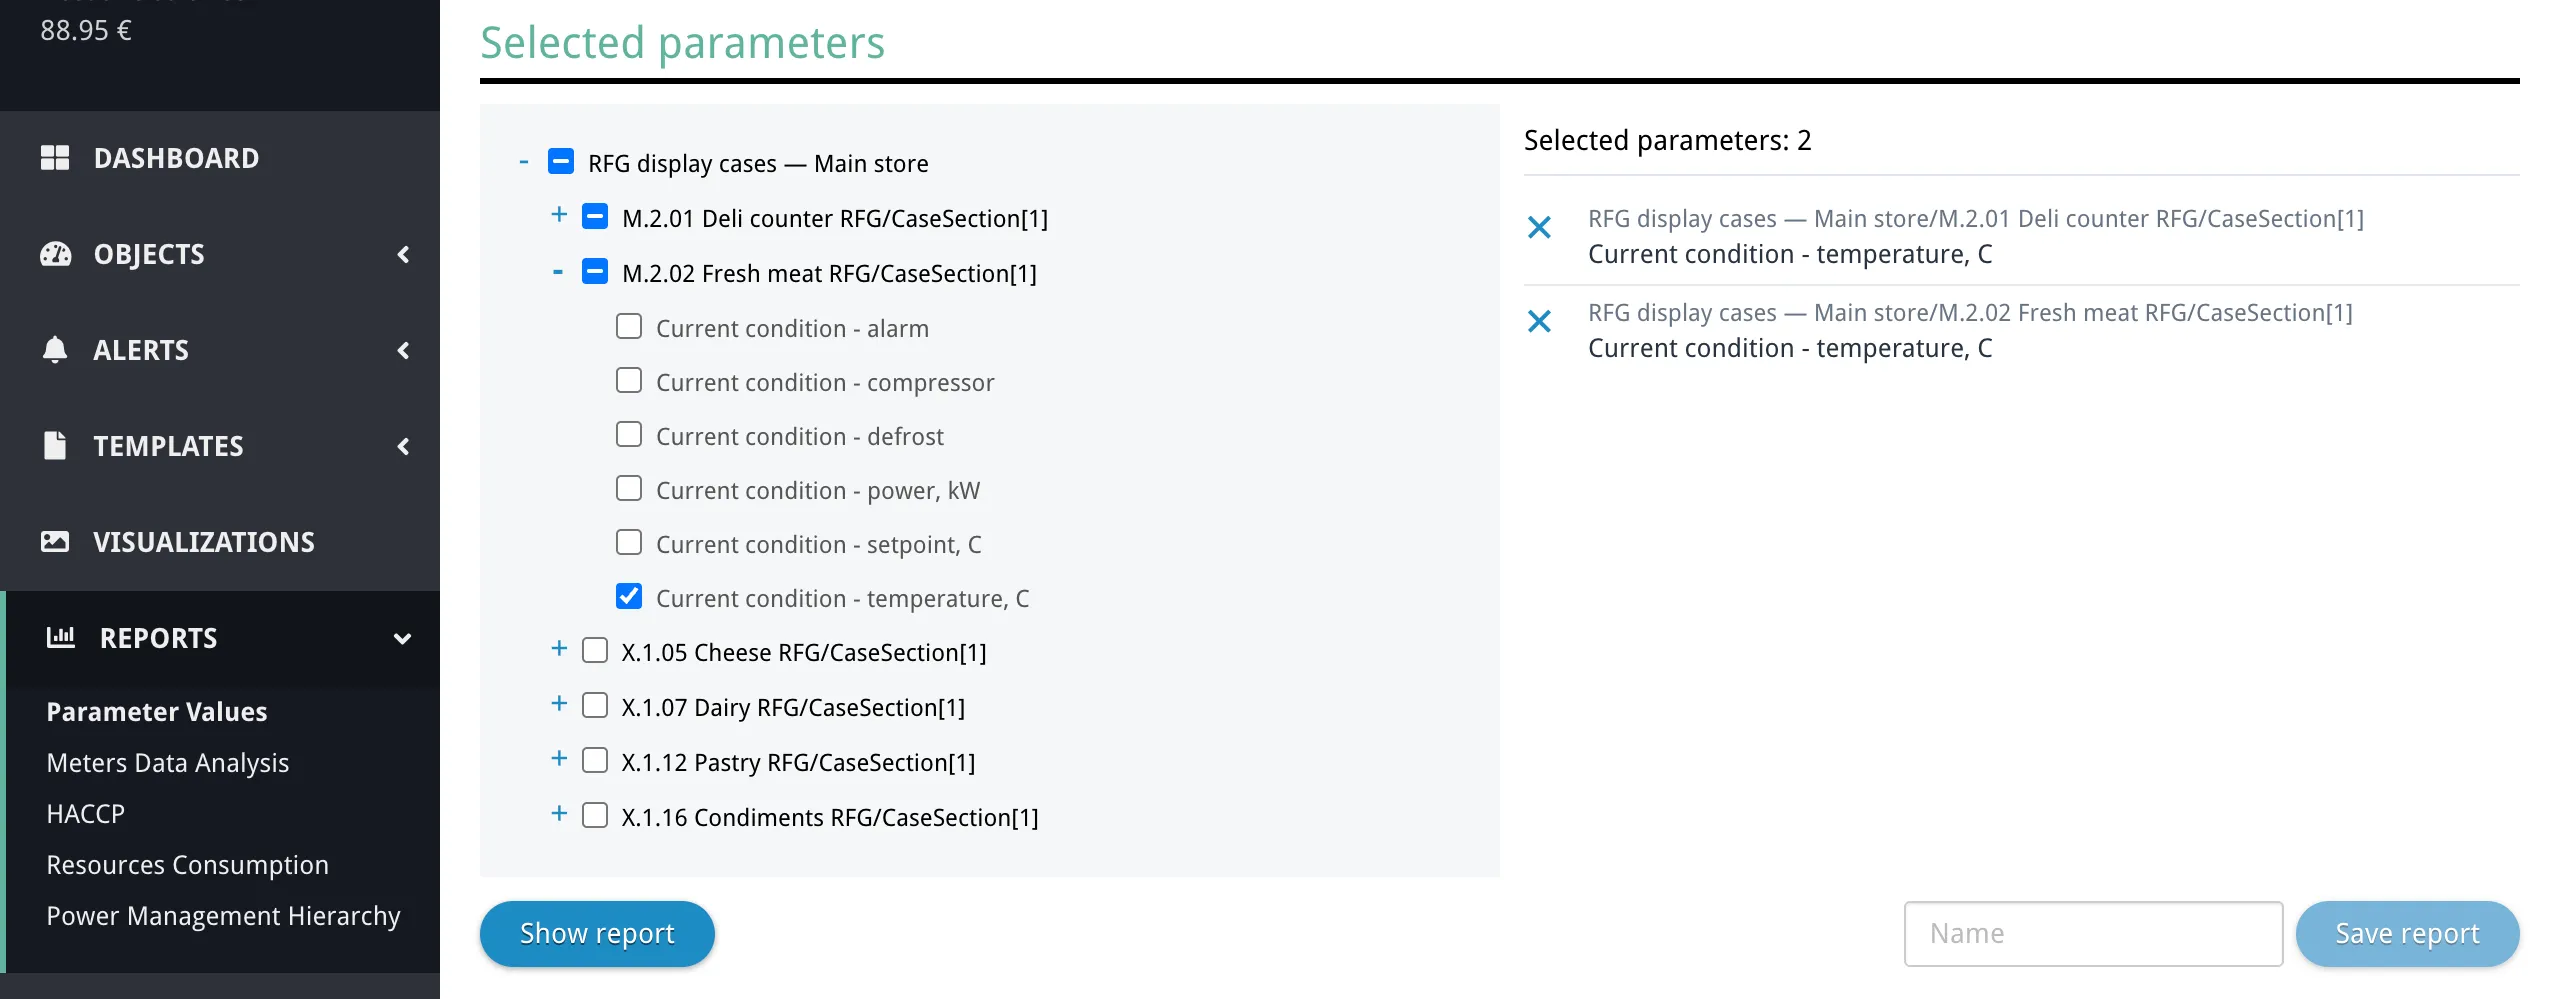
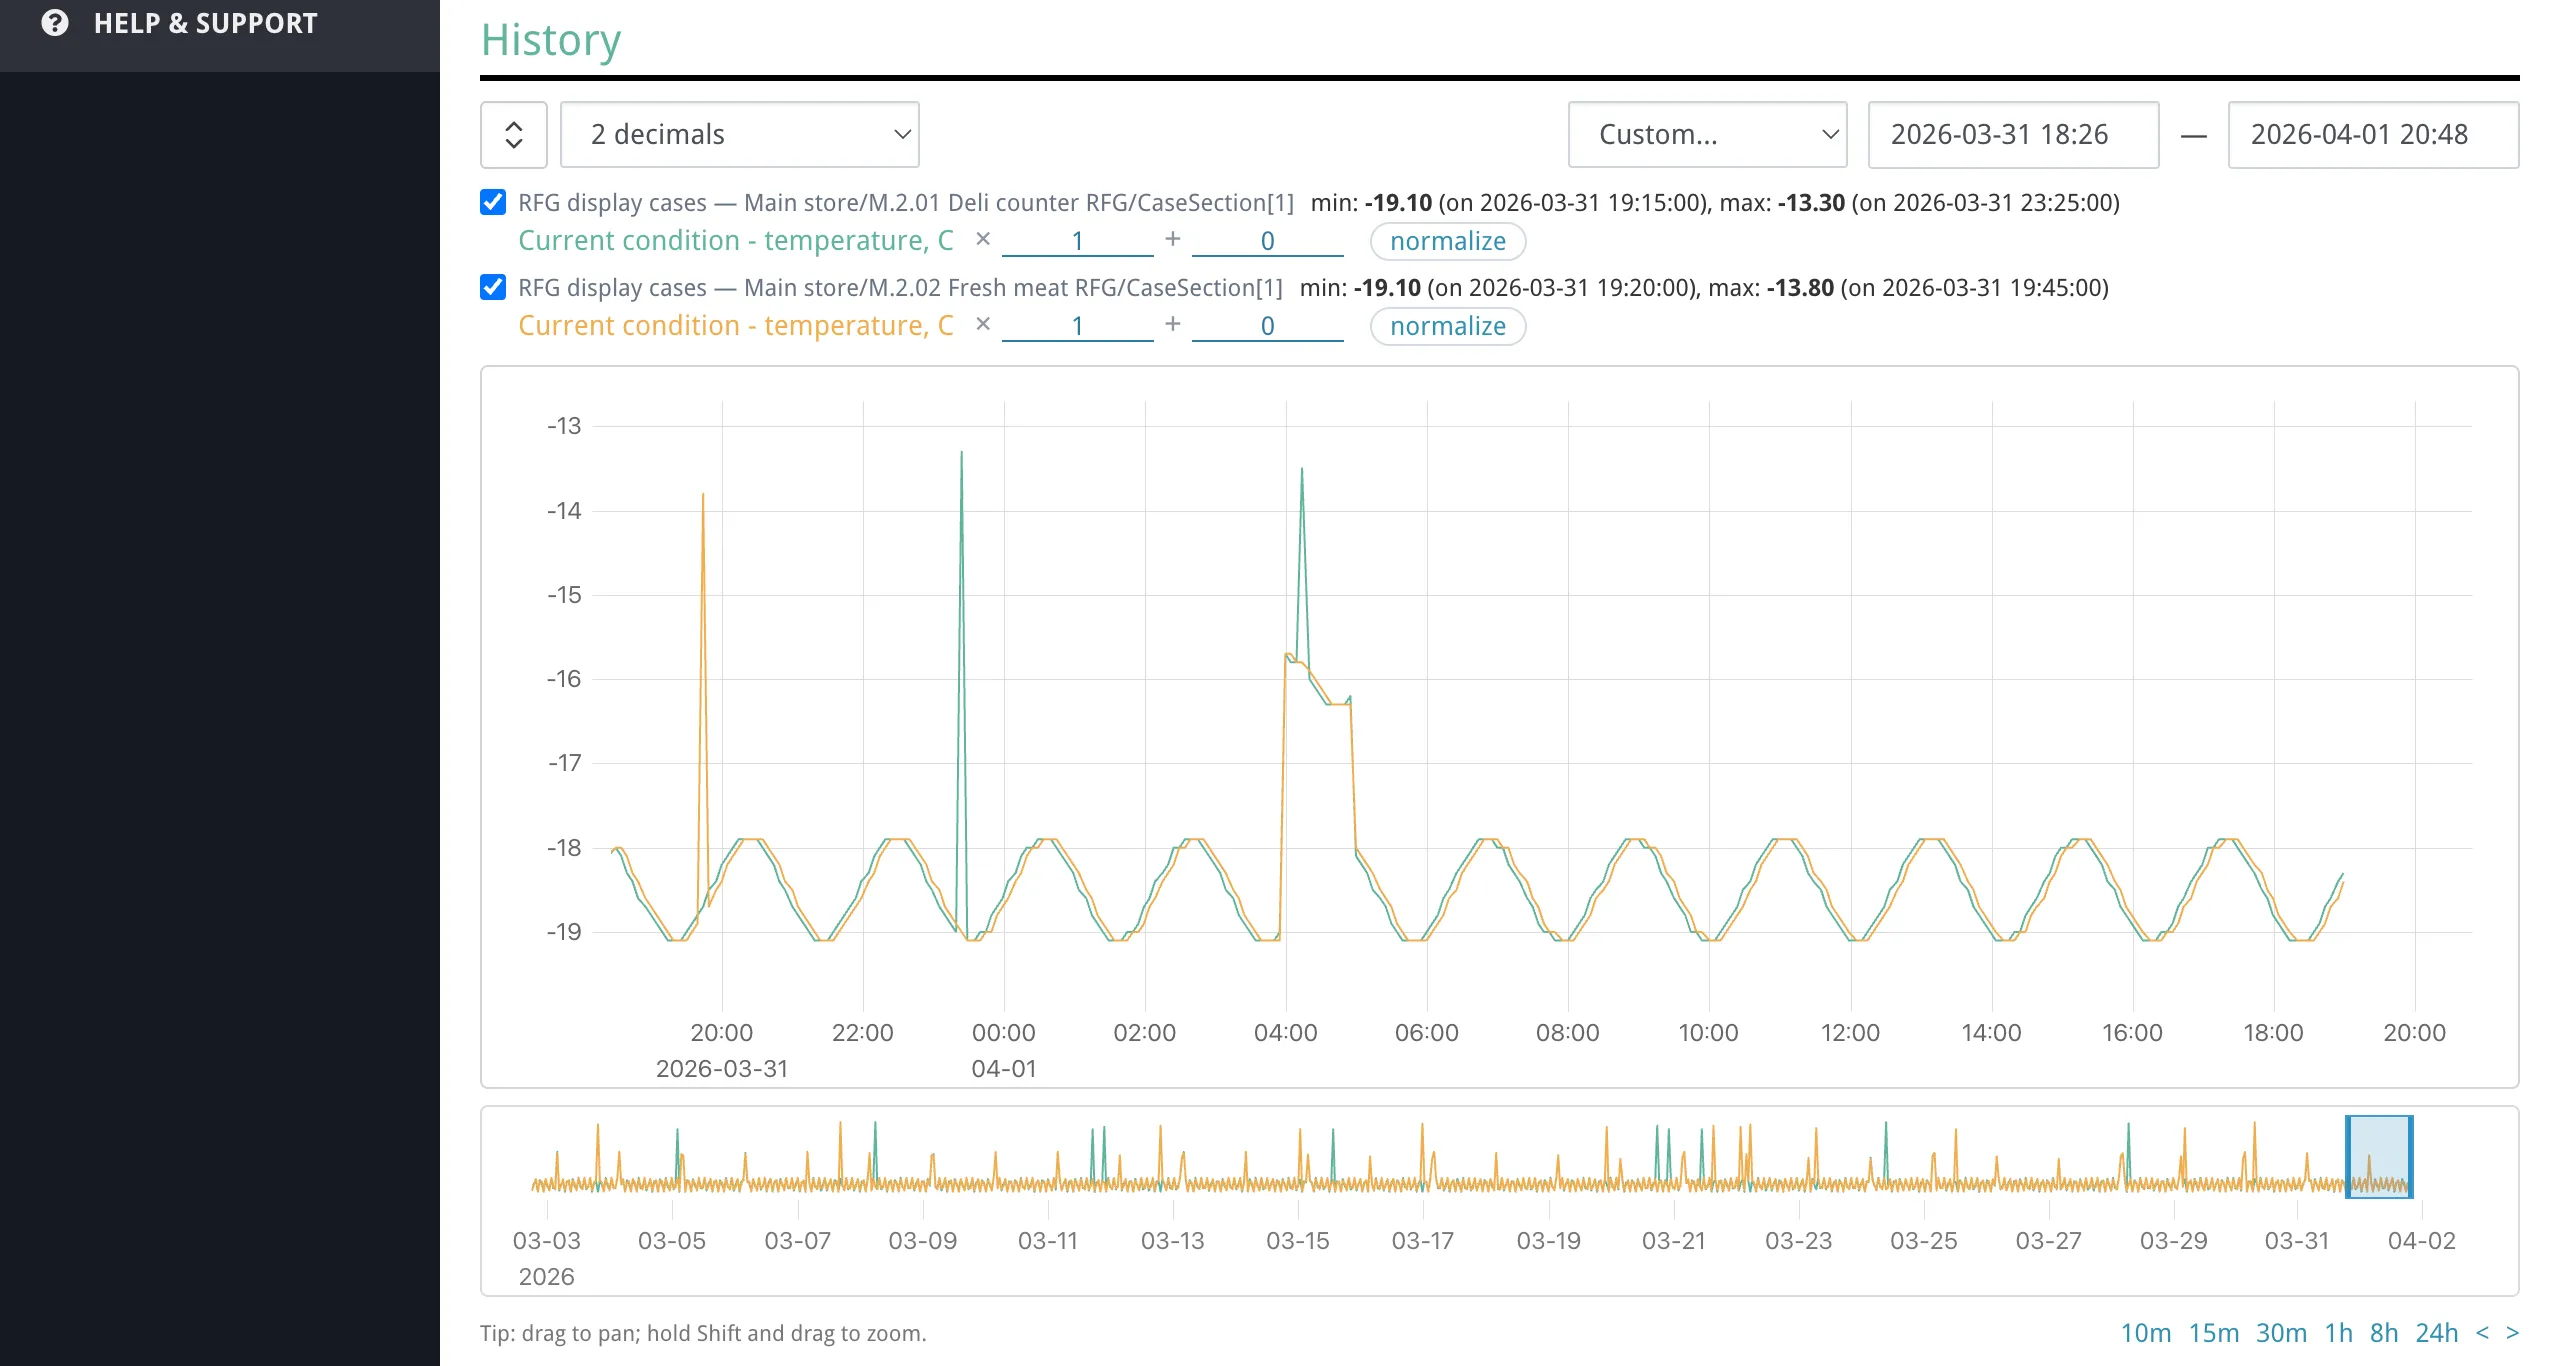
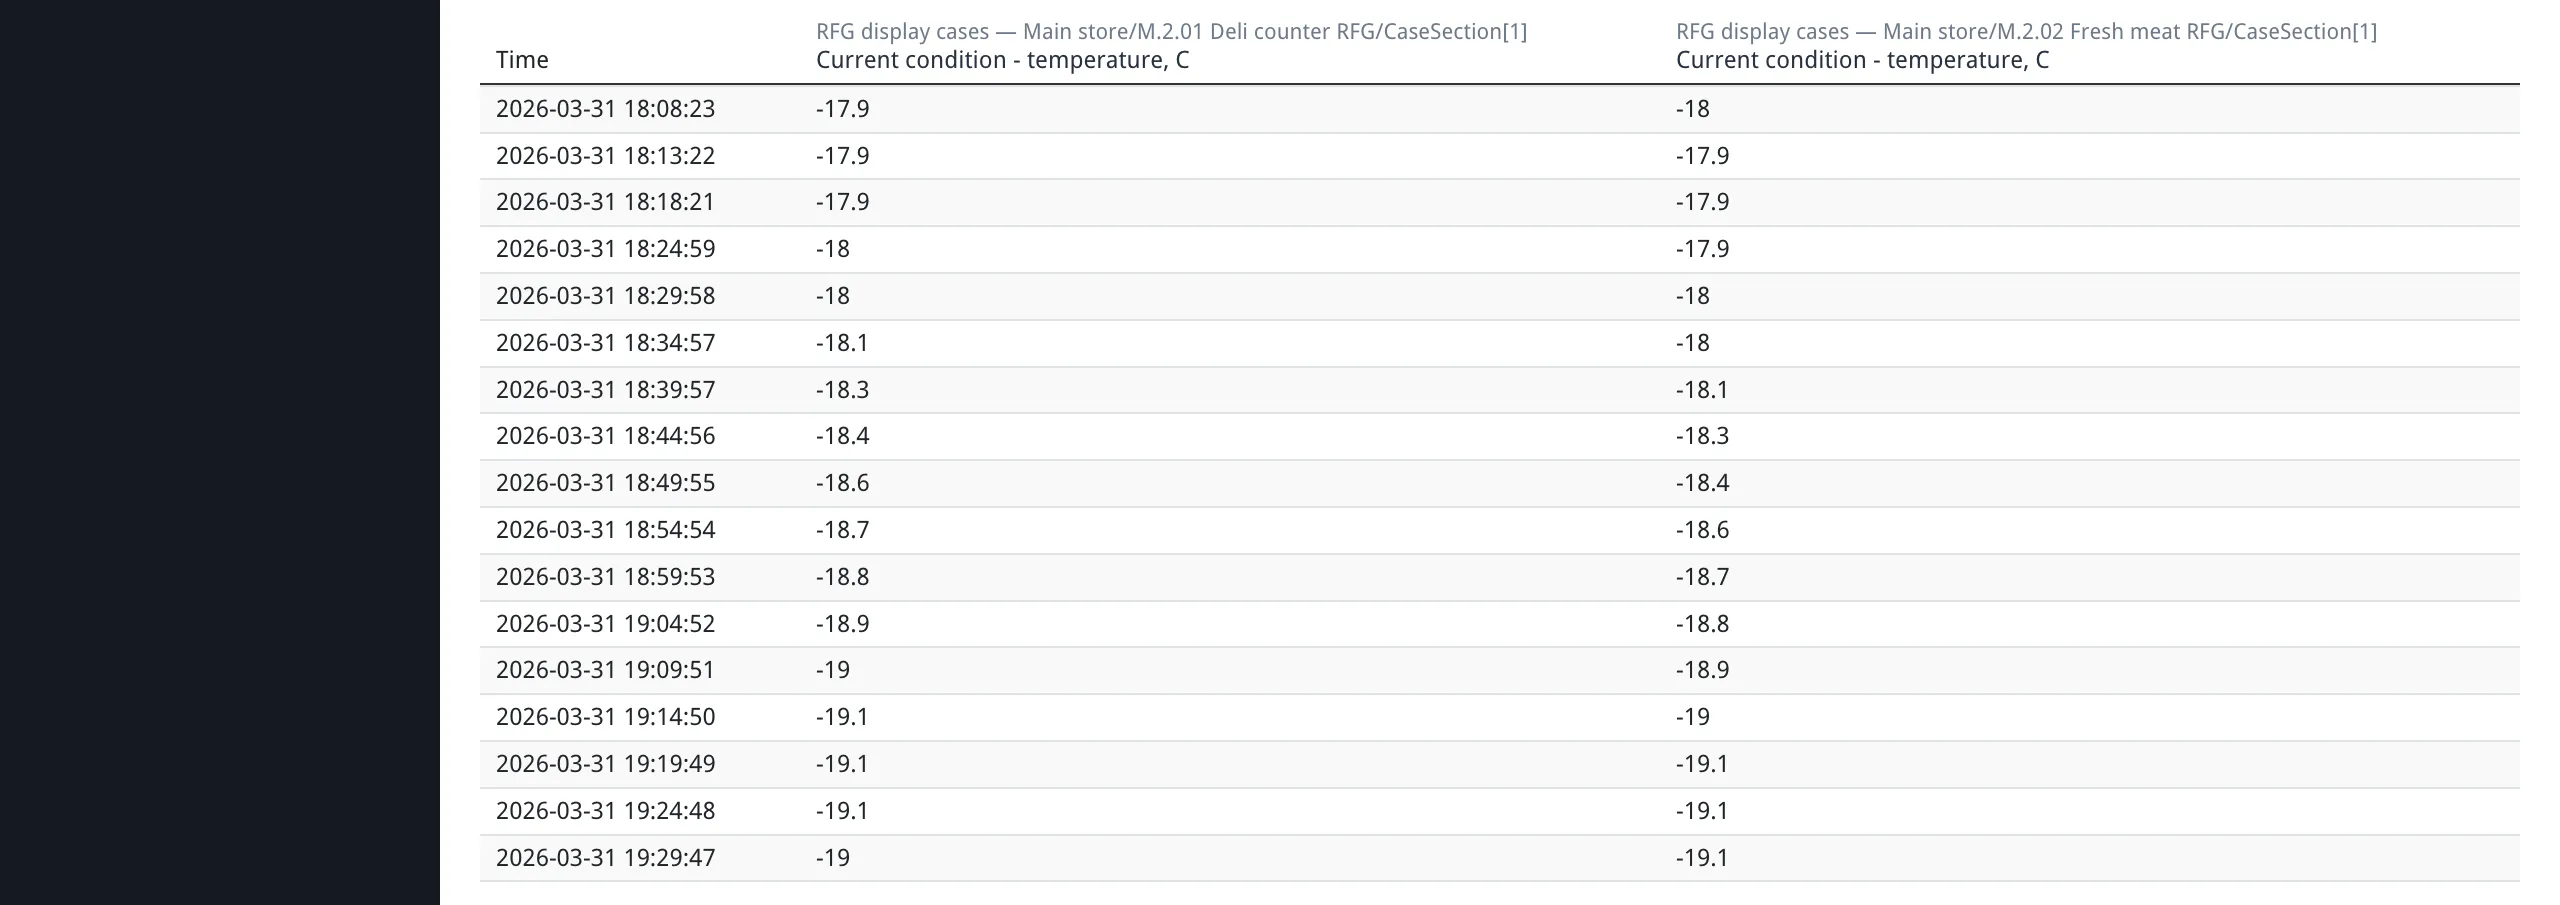
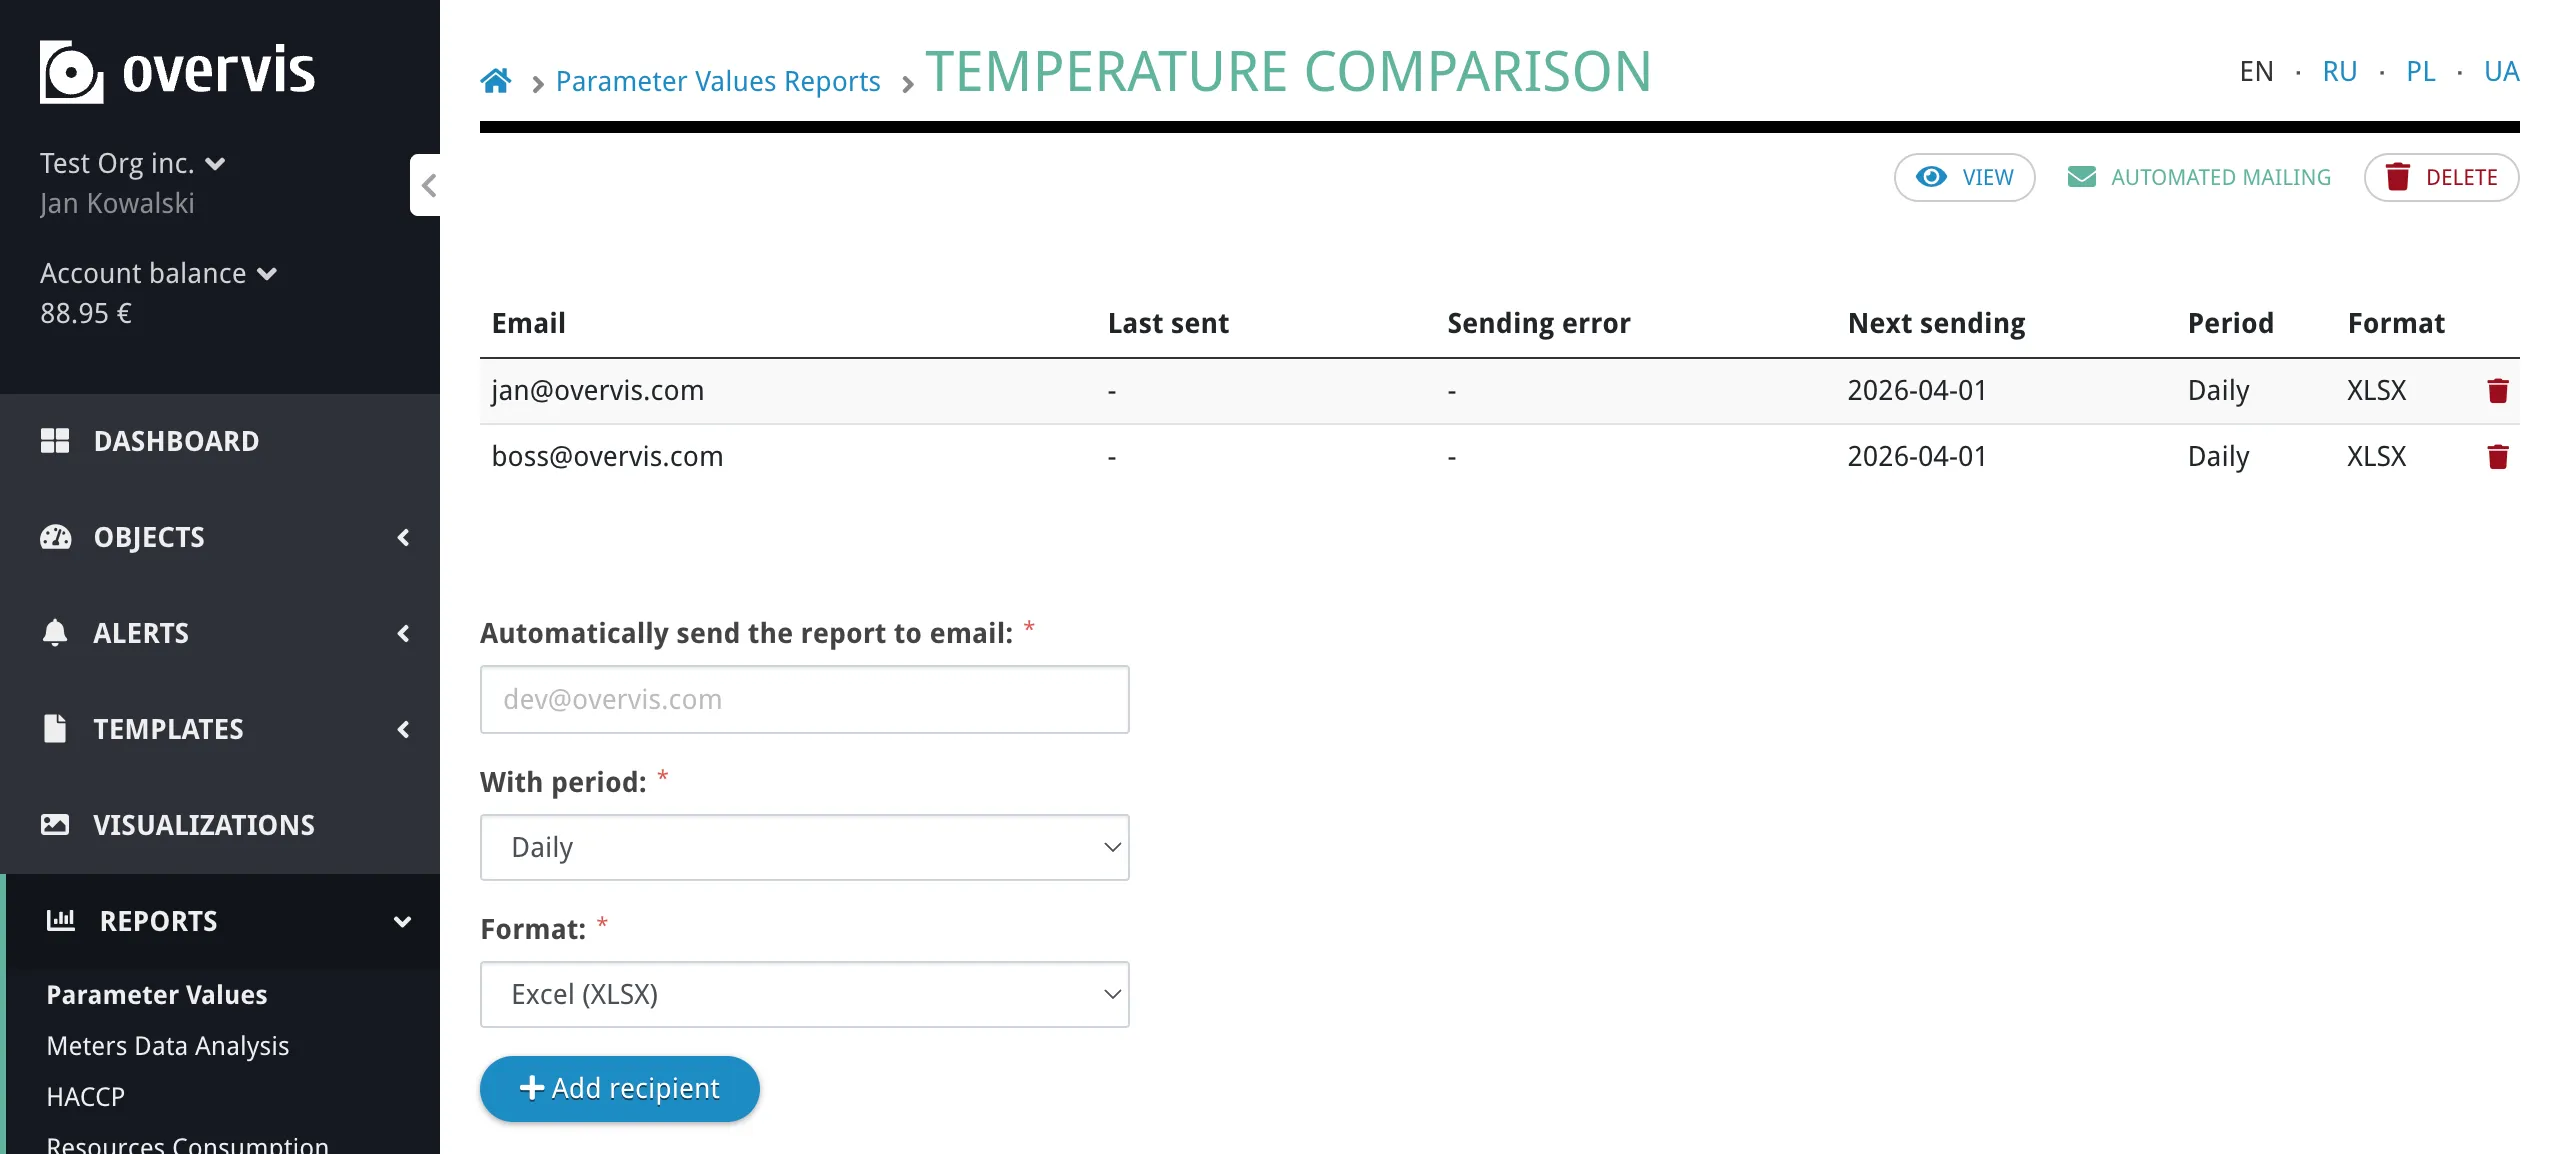
Parameter Values ReportThe Parameter Values Report is an interactive tool for exploring historical data from your tracked parameters. It combines a time series chart, a data table, and export capabilities on a single page. You can overlay multiple parameters from different devices, zoom into specific time intervals, and download the raw data as CSV or Excel.
Opening the ReportSection titled “Opening the Report”There are several ways to open the report:
When you open the report from a device or parameter page, the URL contains Selecting ParametersSection titled “Selecting Parameters”The parameter tree at the top of the page shows your organization hierarchy: networks, devices, and their parameters. Only tracked parameters (those with history recording enabled) appear in the tree.
When you change the parameter selection, the time range resets to the Last 24 hours preset if the current preset is Custom. If you already have a non-Custom preset selected, it keeps that preset. The chart and table reload with the new selection. Controls BarSection titled “Controls Bar”A controls bar above the chart lets you set the time window, adjust display options, and expand the chart. All changes take effect immediately.
Time PresetsSection titled “Time Presets”The preset dropdown lets you quickly jump to common time windows:
Selecting a preset immediately updates both the chart and the table. Custom RangeSection titled “Custom Range”Two date-time pickers ( When you pan or zoom on the chart (see below), the preset automatically switches to Custom and the date-time fields update to reflect the new range. Auto-RefreshSection titled “Auto-Refresh”When a rolling preset is selected, the report refreshes automatically to keep the view current:
Display OptionsSection titled “Display Options”
The chart displays parameter values over time as colored lines. Each selected parameter gets its own line with a distinct color (up to 10 colors, which then cycle). If a device was offline or polling was interrupted, the chart shows breaks in the line where no readings were recorded.
Hovering over the chart shows a tooltip with the timestamp and the value of each visible parameter at that point. The closest line is shown in bold. When the visible time window is under 10 minutes, timestamps include seconds. Navigating the ChartSection titled “Navigating the Chart”
All navigation updates the date-time fields and the data table in sync. NavigatorSection titled “Navigator”Below the main chart is a smaller navigator chart showing an overview of the full data range. A shaded window indicates the currently visible area.
You can:
The navigator automatically expands its range as you pan beyond its current bounds. LegendSection titled “Legend”The legend appears between the range controls and the chart. Each parameter is shown as a row with:
Line TransformsSection titled “Line Transforms”Each legend row has inline multiplier (×) and shift (+) controls. These let you visually rescale individual lines so that parameters with different units or magnitudes can be compared on the same chart.
Transforms are purely visual — they affect the chart display only, not the data table or exported data. Y-Axis ReferenceSection titled “Y-Axis Reference”By default, the Y-axis shows a scale that fits all visible lines. Clicking on a line in the chart pins the Y-axis labels to that specific parameter’s scale (the legend entry appears highlighted). Click again or click a different line to change the reference. Clicking away from any line (on the chart background) clears the reference and returns to the auto-fitting scale. Data TableSection titled “Data Table”Below the chart, a table lists readings within the current time window.
Columns are:
Readings from different parameters that occur within 60 seconds of each other are merged into the same row. As you pan or zoom the chart, the table updates to show only the rows within the visible window. Exporting DataSection titled “Exporting Data”The export form appears below the data table when parameters are selected. It has its own from/till date pickers (date only, no time — exports always cover full days) that are independent of the chart view range.
The exported file contains all raw readings (not sampled) for the selected parameters within the chosen date range. The date pickers default to the last 7 days. Timestamps in the exported file use your browser’s local timezone. Saving Reports and Automated MailingSection titled “Saving Reports and Automated Mailing”Saving a ReportSection titled “Saving a Report”When viewing the report with parameters selected, a save form appears inline next to the parameter tree’s action bar:
Updating a Saved ReportSection titled “Updating a Saved Report”When viewing a saved report, the save form is replaced with an update form (the page heading may read Update saved report). You can change the name, modify the parameter selection, adjust line transforms, and click Update report to save the changes. Saved Reports ListSection titled “Saved Reports List”Open Reports → Parameter Values, then use Saved reports in the readings section to open the list of saved reports (not a separate top-level menu item). The list shows each report’s name and creation date.
From here you can:
Automated MailingSection titled “Automated Mailing”For each saved report, you can set up automatic delivery of the readings data to email recipients:
You can add multiple recipients with different periods and formats. Each email-period-format combination must be unique per report. The mailing list table shows the following for each recipient:
The automated mailing sends data for the previous period: daily mailings include the previous day, weekly include the previous 7 days, and monthly include the previous month. Timestamps in mailed reports use UTC. Shareable LinksSection titled “Shareable Links”The report URL preserves the full view state in the URL hash, including the time range, decimal precision, and per-line visibility/transform settings. You can copy the URL from the browser address bar and share it — anyone with access to the organization will see the same view. TroubleshootingSection titled “Troubleshooting”No Data Appears on the ChartSection titled “No Data Appears on the Chart”Possible causes:
Solutions:
Chart Shows Gaps or Breaks in the LineSection titled “Chart Shows Gaps or Breaks in the Line”Gaps indicate periods when no readings were recorded. This typically happens when:
There is no corrective action for past gaps — they reflect the actual data availability. To prevent future gaps, ensure the gateway has a stable internet connection and the device is powered on. Export File Contains No Data or Fewer Rows Than ExpectedSection titled “Export File Contains No Data or Fewer Rows Than Expected”Possible causes:
Solutions:
Auto-Refresh Stopped WorkingSection titled “Auto-Refresh Stopped Working”Auto-refresh only works with rolling presets (Last 5 min through Last 365 days). It stops when:
To restart auto-refresh, select a rolling preset from the dropdown. Automated Mailing Not ReceivedSection titled “Automated Mailing Not Received”Solutions:
Report Is Slow to Load or UnresponsiveSection titled “Report Is Slow to Load or Unresponsive”Possible causes:
Solutions:
Common QuestionsSection titled “Common Questions”How many parameters can I display at once?Section titled “How many parameters can I display at once?”There is a per-deployment configurable limit. The exact number is shown in the placeholder message below the parameter tree when no parameters are selected (same wording as in the app, e.g. Please select up to {} parameters to display. — with the limit filled in, such as 10). If you need to compare more parameters, create multiple saved reports with different parameter sets. Does the chart show every single data point?Section titled “Does the chart show every single data point?”No. The chart shows up to 1000 sampled data points per parameter for the visible window. This sampling ensures the chart remains responsive even over long time ranges. For complete raw data without sampling, use Download on the export form, which includes all readings within the chosen date range. What timezone is used?Section titled “What timezone is used?”
Can I share a report view with a colleague?Section titled “Can I share a report view with a colleague?”Yes. Copy the URL from the browser address bar — it includes the current time range, decimal precision, and line transform settings in the URL hash. Anyone with access to the same organization can open the link and see the same view. They must be logged in to Overvis. What is the difference between chart data and exported data?Section titled “What is the difference between chart data and exported data?”The chart and table display sampled data — up to 1000 points per parameter, spread across the visible time window. This is sufficient for visual analysis but is not the full dataset. The export feature produces a file with all raw readings — every recorded value for the selected parameters within the export date range. Use exports when you need complete data for external analysis or archiving. Why are some table rows missing values for certain parameters?Section titled “Why are some table rows missing values for certain parameters?”The table merges readings from different parameters that occur within 60 seconds of each other into the same row. If a parameter did not report a value near that timestamp, its cell shows a dash ( What happens if I delete a saved report that has automated mailing?Section titled “What happens if I delete a saved report that has automated mailing?”Deleting a saved report also removes all associated mailing records. Recipients will stop receiving automated reports. A confirmation step is shown before deletion. Can I use the report in the monitoring (view-only) interface?Section titled “Can I use the report in the monitoring (view-only) interface?”Yes. The report is available in the monitoring interface at the same URL pattern. Users with view-only access can view charts, tables, and use the export feature. However, saving reports and configuring automated mailing require manage-level access. |
| | ||||||||||||||||||||||||||
|---|---|---|---|---|---|---|---|---|---|---|---|---|---|---|---|---|---|---|---|---|---|---|---|---|---|---|
Resource Consumption ReportThe Resource Consumption Report is a tool for analyzing accumulated counter and meter data, showing resource usage growth over selected time periods segmented into half-hour, hourly, or daily intervals. This report helps you analyze readings from parameters that represent continuous resource usage like energy meters (kWh), water meters (m³), gas meters, and any accumulating counter values. If a parameter value continuously grows over time, this report can analyze its growth patterns. How it worksSection titled “How it works”The report divides the selected time range into segments (half-hour, hour, or day). For each segment, it finds the highest recorded reading within that segment and subtracts the latest reading recorded before the segment started. This difference — the delta — represents how much the counter grew during that interval. If the parameter has a multiplier or shift configured, those are applied to the delta (delta × multiplier + shift). Reports are organized as a tree. Main branches (top-level) each produce a separate chart. Branches can contain child nodes — other branches, individual parameter values, formulas, or links to branches from other reports. A branch’s value equals the sum of all its children, so you can group meters by department, building, or resource type and see both the total and the breakdown. Example scenarioSection titled “Example scenario”Consider a facility with multiple departments, each with their own meters:
You can structure a report to analyze this data: With this structure, the report shows total energy and water consumption for the entire company, broken down by department, down to individual meters. You can compare departments side by side and identify which department or meter contributes most to overall usage.
Viewing a reportSection titled “Viewing a report”The report view page shows interactive bar charts — one per main branch. Each bar represents a time segment, and its height shows the consumption delta for that period. If level markers are configured, they appear as horizontal reference lines on the chart and the bars are color-coded when they exceed a threshold. A legend above the charts lists all main branches as checkboxes. Uncheck a branch to hide its chart. A dropdown at the top lets you switch between reports in the same organization.
ExportingSection titled “Exporting”Below the charts, three export buttons are available: Download as Excel, Download as PDF, and Send PDF to e-mail. Only the branches currently visible (checked in the legend) are included in exports. Detailed report — a checkbox next to the export buttons (visible to managers only). When checked, the exported file includes the full hierarchy of branches, sub-branches, individual meter readings, and formula calculations. When unchecked (or when viewing as a monitor), the export shows only the main (top-level) branches — a summary suitable for executive reports.
Short report — generated when the detailed checkbox is off. Shows only top-level branches with their aggregated values.
Send PDF to e-mail — click the button, enter the recipient’s email address, and the report is generated and delivered immediately. This uses the same time range, segmentation, and branch selection as the regular PDF export. Creating a reportSection titled “Creating a report”Navigate to Reports → Resources Consumption and click Create new to open the report constructor. A report is defined by its tree structure — you build a hierarchy of branches that describes how your consumption data should be grouped and calculated. Node typesSection titled “Node types”Each node in the tree has a type that determines where its value comes from:
To build the tree, start by clicking Add main branch to create a top-level (root) branch. Within each branch, click Add branch to add children of any type. The tree grows from top to bottom — main branches at the top, leaf nodes (Value, Calculate, Link) at the bottom. Main branch settingsSection titled “Main branch settings”Main (top-level) branches have two additional settings that affect the online view: Category — an optional label that groups related branches under a heading. For example, you might group all energy branches under “Energy” and all water branches under “Water”. Branches without a category appear first, followed by category groups. Categories are only used in the online view and do not appear in Excel/PDF exports. Level markers — up to 4 threshold values, each with a color. On the chart, these appear as horizontal reference lines and as color-coded stacked bar segments. For example, you might set a yellow marker at 50 kWh and a red marker at 100 kWh to highlight when consumption exceeds expected levels. Level markers are only used in the online view and do not appear in Excel/PDF exports. Time range and segmentationSection titled “Time range and segmentation”When viewing a report, you choose the time range and segmentation interval using the controls above the charts. The time range determines which period to analyze. The preset dropdown offers Last day, Last 7 days, and Last 30 days, or you can select Custom and pick specific dates with the date pickers. The segmentation determines how the time range is divided into intervals: By half-hour (30-minute intervals), By hour, or By date (daily intervals). Smaller intervals produce more detail but also more data points — on large date ranges with many parameters, you may need a larger interval to avoid hitting export limits. Charts and exports use the timezone detected from your browser. All segment boundaries are aligned to your local timezone. Using formulasSection titled “Using formulas”The Calculate node type uses formulas to combine multiple parameters. Formulas reference parameters by their ID (prefixed with Example formula: This formula takes the delta of parameter If a referenced parameter has no data for a given segment (e.g. the device was offline or the parameter was deleted), its value is treated as Supported operatorsSection titled “Supported operators”Overvis uses the math-expression-evaluator library:
Example FormulasSum of two meters: Difference between meters: Apply scaling factor: Weighted combination (example): Finding parameter IDsSection titled “Finding parameter IDs”Go to the device page and hover over any parameter to see its ID in the tooltip:
When you enter a formula, the parameter names appear below the input field. Missing or incorrect IDs are highlighted:
Access controlSection titled “Access control”Users with the manager role can create, edit, and delete reports, and have access to the Detailed report checkbox for exports. Monitors can be granted view-only access to a specific resource consumption report. They can view the charts and download exports, but only the short (non-detailed) version — the detailed checkbox is hidden. Monitors cannot create or edit reports. Monitor access is configured when inviting a user to the organization, where you can bind the monitor role to a specific report. TroubleshootingSection titled “Troubleshooting”“Segment limit exceeded” error when exportingSection titled ““Segment limit exceeded” error when exporting”The requested combination of date range, segmentation, and number of parameters exceeds the export limit. The error message shows the nearest available date for your chosen segmentation. Solutions:
All values show as zeroSection titled “All values show as zero”The parameters you selected are likely not accumulating counters. This report calculates the difference (delta) between readings within each segment. If the parameter value doesn’t change between readings (e.g. it’s an instantaneous measurement like temperature), all deltas will be zero. Solutions:
Unexpected or negative valuesSection titled “Unexpected or negative values”Negative deltas can occur when a meter counter resets or rolls over. Solutions:
Charts show no data for some segmentsSection titled “Charts show no data for some segments”The device may have been offline or not polling during those time periods. Segments with no readings are skipped in the chart. Solutions:
Formula shows 0 for all segmentsSection titled “Formula shows 0 for all segments”Possible causes:
Solutions:
Exported report is empty or missing branchesSection titled “Exported report is empty or missing branches”Only the branches visible in the online view (checked in the legend) are included in exports. Solutions:
Chart data looks different from the exportSection titled “Chart data looks different from the export”The online chart may clamp the start date if the requested range would exceed the chart data point limit. The export uses the full requested date range. This means you may see a shorter time range in the chart than what appears in the downloaded XLSX/PDF. Common questionsSection titled “Common questions”What types of parameters work with this report?Section titled “What types of parameters work with this report?”Any parameter that represents an accumulating counter — the value grows over time. Common examples: energy meters (kWh), water meters (m³), gas meters, run-hour counters, production counters. Parameters that represent instantaneous values (temperature, pressure, voltage) are not suitable for this report; use the Parameter Values Report instead. Can I include parameters from different devices in one report?Section titled “Can I include parameters from different devices in one report?”Yes. The tree structure lets you combine parameters from any devices across any networks in the same organization. This is useful for aggregating consumption across multiple meters or locations. How does the delta calculation work exactly?Section titled “How does the delta calculation work exactly?”For each time segment, the system finds the highest recorded reading within that segment and subtracts the latest reading recorded before the segment started. If there is no prior reading, zero is used. The result is then multiplied by the parameter’s multiplier and adjusted by its shift value (if configured). Can I reuse parts of one report in another?Section titled “Can I reuse parts of one report in another?”Yes, use the Link node type when creating a report. It lets you reference any branch from any report in the same organization, so you don’t have to rebuild common structures. Can I schedule automatic report delivery?Section titled “Can I schedule automatic report delivery?”No. Resource Consumption Reports can only be sent via email manually using the Send PDF to e-mail button. For scheduled automatic report delivery, see the Parameter Values Report. What is the maximum report tree depth?Section titled “What is the maximum report tree depth?”You can nest branches up to 5 levels below the root (main) branches. The root branch is level 0, and child branches can go down to level 5. Why can’t I see the “Detailed report” checkbox?Section titled “Why can’t I see the “Detailed report” checkbox?”The detailed export option is only available to users with the manager role. Monitors see only the short (summary) version of exports. What happens if I delete a device or parameter used in a report?Section titled “What happens if I delete a device or parameter used in a report?”If a parameter referenced by a Value node is deleted, that node will show no data (empty deltas). If a parameter referenced in a Calculate formula is deleted, its value is treated as 0 in the formula. The report structure itself is preserved — you can edit it to replace the missing parameter. Is there a limit on how much data I can export?Section titled “Is there a limit on how much data I can export?”Yes. Exports are limited by the total number of data points (segments × parameters). The exact limits depend on the format — PDF has a lower limit than Excel. If you exceed the limit, you’ll see a “Segment limit exceeded” error with a suggested date range. Reduce the date range or use a larger segmentation interval. Related documentationSection titled “Related documentation” |
| |
|---|
Overvis Hazard Analysis and Critical Control Points (HACCP) ReportHACCP (Hazard Analysis and Critical Control Points) is a systematic food safety management approach that identifies, evaluates, and controls hazards throughout the food production and storage chain. In refrigeration and cold chain operations, HACCP requires continuous temperature monitoring at critical control points, with documented evidence that safety limits are maintained. The Overvis HACCP Report tool automates temperature monitoring compliance for refrigeration and freezer control points. It pulls temperature readings from monitored devices and produces structured reports that:
This tool supports temperature monitoring documentation requirements under common HACCP frameworks, including Codex Alimentarius principles and EU food hygiene regulations (EC 852/2004). It is designed specifically for refrigeration and freezer HACCP review and is not a general-purpose HACCP system covering all hazard types. Each report is scoped to a single organization. If you manage multiple facilities, generate separate reports for each organization. All temperatures are treated as Celsius. All date and time calculations use the organization’s configured timezone, including correct handling of daylight saving time transitions. Quick StartSection titled “Quick Start”
NavigationSection titled “Navigation”
To open the HACCP report, go to Reports > HACCP in the main navigation menu (1) (tab HACCP report; builder page heading HACCP). The feature is organized into three sections (2), accessible via navigation tabs at the top of the page:
The navigation tabs remain visible on all HACCP pages, including template detail, delete confirmation, and reviewed report detail pages. Report BuilderSection titled “Report Builder”The report builder is the main working area of the page whose heading is HACCP (the action tab label is HACCP report). It allows you to configure which temperature parameters to monitor, set the reporting period and time interval, define acceptable temperature thresholds, and generate the report. The builder is always visible at the top of that page. After you generate a report, the results appear below the builder. You can freely adjust builder settings without losing the generated report or any draft corrective action notes — changes only take effect when you click Generate report again. Regenerating the report replaces the previous results and discards all draft corrective action notes.
Report SettingsSection titled “Report Settings”
Temperature ParametersSection titled “Temperature Parameters”The temperature parameters list defines which control points are included in the report. Each entry represents one monitored temperature parameter along with its optional supporting parameters and thresholds. You must configure at least one temperature parameter before the report can be generated. Up to 100 parameters can be included in a single report. To add a parameter, click Add temperature parameter below the list. To edit an existing parameter, click its name in the list. To remove a parameter, click the trash icon on its row. To reorder parameters, drag using the handle on the left side of each row — the list previews the new position while dragging.
Parameter Configuration DialogSection titled “Parameter Configuration Dialog”The parameter configuration dialog opens when you add or edit a temperature parameter. It contains the following sections:
Temperature parameter (required) — the primary temperature reading for this control point. Select the network, then the device, then the specific parameter. Only tracked parameters are available for selection — these are device parameters that Overvis reads periodically in the background and stores in the database. If a parameter you need is not listed, make sure it is set up as tracked in the device configuration. Setpoint parameter (optional) — a reference setpoint value used for deviation coloring in the report table. When configured, each cell is colored on a blue-to-white-to-orange gradient based on how far the temperature deviates from the setpoint. The deviation scale uses steps of 1°C per color level. The setpoint does not affect exception detection — it is used for visual indication only. To add a setpoint, click Setpoint parameter to expand the section, then select the network, device, and parameter. To remove it, click the trash icon next to the section name. Defrost parameter (optional) — indicates whether the equipment is in a defrost cycle. When defrost is active, the corresponding cells are highlighted with a yellow background in the report table. Defrost status is shown for informational context only — it does not create exceptions and does not suppress threshold violations. On/off parameter (optional) — indicates whether the equipment is running. When the equipment is off, the corresponding cells are shown with a grey background. Equipment being off is informational and does not create exceptions on its own. However, threshold violations are still detected even when equipment is off. If the equipment is on (or its state is unknown) and the temperature reading is missing, this is flagged as an unknown status exception. For both defrost and on/off parameters, two additional controls are available:
ThresholdsSection titled “Thresholds”Each temperature parameter can have up to four threshold values configured. Thresholds define the acceptable temperature ranges for a control point and drive exception detection in the generated report. Operational thresholds define the normal operating range:
Operational deviations indicate that the temperature has drifted outside the desired range but has not yet reached a safety-critical level. These typically require investigation and corrective action to prevent further drift. Critical thresholds define the absolute safety limits:
Critical limit breaches indicate a direct food safety risk and require immediate corrective action and documentation. Set critical thresholds based on the critical limits established in your HACCP plan. Operational thresholds should be set tighter than critical limits to provide early warning before a critical breach occurs — this gives your team time to take corrective action before food safety is compromised. All threshold values are optional. When a threshold is not configured, the corresponding exception type is not checked for that parameter. Within each pair (operational or critical), the low value must not exceed the high value. Threshold violations are detected based on the computed segment value (as determined by the Temperature value setting), not from raw individual readings within the segment. If a critical threshold is violated, it takes precedence over an operational threshold violation for the same segment. Generated ReportSection titled “Generated Report”After clicking Generate report, the report appears below the builder. It consists of three areas: a header block (with legend, exception totals, and review form), an exception summary table, and a detailed table that loads on demand. Header and LegendSection titled “Header and Legend”
The header displays the report name, selected date range, and interval size. Next to the metadata, a color legend shows the meaning of all visual styles used in the report:
Below the legend, exception totals are shown:
Exception SummarySection titled “Exception Summary”The exception summary table is the primary HACCP review surface. It lists every detected exception interval across all configured parameters, sorted by parameter and time.
Each row shows:
Exception TypesSection titled “Exception Types”The report detects three types of exceptions. When multiple exception conditions apply to the same time segment, the highest-priority type takes precedence. Critical limit breach (highest priority) — the computed temperature value for a segment is below the configured critical low threshold or above the configured critical high threshold. This represents a direct food safety hazard that requires immediate corrective action and documentation. In the detailed table, critical breaches are shown with bold text and a thicker colored inset border (blue for low, red for high). Operational deviation (medium priority) — the computed temperature value is outside the operational threshold range but has not reached a critical limit. This indicates the system is drifting from its target operating conditions and may require adjustment to prevent a critical breach. Operational deviations use the same blue/red inset colors as critical on that side, but a thinner border and no bold text. Unknown status/data (lowest priority) — temperature data is missing or an equipment status parameter has an unknown state. This can occur when:
This exception type covers two distinct situations under one label: missing temperature readings (a monitoring failure) and unresolved equipment states (an equipment status question). Both appear as “unknown status/data” in the exception summary, but the detailed reason is shown in the tooltip or cell annotation. If the equipment is confirmed to be off and the temperature reading is missing, this is not flagged as an unknown status exception. How exception intervals are formed: the report examines each time segment independently, classifies it according to the rules above, and then merges consecutive segments of the same exception type into continuous intervals. When the exception type changes between adjacent segments, a new interval begins. For example, two hours of operational deviation containing a 20-minute critical breach in the middle produces three separate intervals: operational deviation, critical limit breach, and operational deviation. Important: defrost and off states are informational only — they do not create exceptions on their own and do not suppress threshold violations. If a critical or operational threshold is violated during a defrost cycle or while equipment is off, the exception is still detected and reported. In the detailed table, threshold violation indicators (borders and bold text) are overlaid on top of the defrost or off background color, so both states remain visible simultaneously (see Cell visual styling). Corrective Action NotesSection titled “Corrective Action Notes”You can attach corrective action notes to any exception interval in the summary. Notes serve as documentation of what action was taken in response to a detected exception. To add a note, click the corrective action cell for the relevant exception row. Each note records the text you enter, your display name, and the timestamp when it was created. You can edit or delete notes freely while working on the generated report.
Once the report is submitted for review, all corrective action notes become part of the immutable reviewed snapshot and can no longer be modified. Detailed TableSection titled “Detailed Table”The detailed table shows the full time-segment matrix for all configured parameters. It is hidden by default and is not loaded until you explicitly expand it by clicking Show detailed table. This keeps the initial report generation fast, since the detailed table can be large.
Each row in the table represents one configured temperature parameter (identified by network, device, and parameter name). Columns are organized by day, with each day containing:
Cell visual styling uses the following precedence (highest priority first):
Threshold violations are overlaid on top of the background color:
Missing or unknown values are shown in italic text with a At the bottom of each day column group, a footer row shows summary counts: total segments, segments with operational deviations, segments with critical breaches, and segments with unknown values. Excel ExportSection titled “Excel Export”You can export the report to an Excel file ( The exported workbook contains two sheets: Sheet 1 — “HACCP Report” contains:
Sheet 2 — “Details” contains:
The workbook is formatted for printing with landscape A4 page layout, header rows repeated on every printed page, and a page footer showing page numbers and “Generated by Overvis (www.overvis.com)”. Report TemplatesSection titled “Report Templates”Templates save a report configuration for reuse, so you can quickly generate reports for new date ranges without reconfiguring parameters and thresholds each time. Templates are organization-level — all users in the organization can see and use them. A template stores:
A template does not store the date range, generated report data, corrective action notes, or review metadata. When you load a template, the date range defaults to the last 7 days.
Saving a template. After configuring the builder on the main HACCP report page, click Save template. The template is saved with the current report name and configuration. You are redirected to the template detail page. (When the builder is already opened in a template context, the control may read Save new template — see below.) Loading a template. Open the Templates tab to see the list of saved templates. Click a template name to open the builder with the template’s configuration prefilled. From there, adjust the date range if needed and click Generate report. Updating a template. When viewing a template’s builder page, modify the settings as needed and click Update template to save the changes. You can also click Save new template to create a separate template with the modified configuration. Deleting a template. In the template list, click the trash icon next to a template. A confirmation page appears before the template is permanently deleted. The template list shows each template’s name (as a clickable link) and creation date. Saving, updating, and deleting templates requires edit permissions on the organization. Report ReviewSection titled “Report Review”After generating a report and documenting any corrective actions, an authorized user can submit the report for review. This creates a permanent, immutable record of the report. The review form appears in the header area of the generated report and contains:
Click Submit review to finalize the report. The system captures a complete snapshot of all readings, exception intervals, and corrective action notes as they existed at generation time. After submission, you are redirected to the reviewed report detail page. Submitting a review requires edit permissions on the organization. The review cannot be undone — once submitted, the snapshot and all its contents are permanent. Reviewed ReportsSection titled “Reviewed Reports”The Reviewed Reports tab shows all submitted report snapshots for the organization. The list displays:
Click a report name to open the detail page. The detail page shows the same report view as a generated report — header, legend, exception summary with corrective action notes, and an expandable detailed table — but in read-only mode. The builder form is not shown on this page. All data comes from the stored snapshot, not from live readings.
Reviewed reports are stored indefinitely. You can export a reviewed report to Excel from its detail page. The exported file uses the stored snapshot data, ensuring the export always matches exactly what was reviewed. Organization owners can delete a reviewed report by clicking the delete action in the list. Deleting removes the report from the list and makes its detail page inaccessible. If a deleted report needs to be restored (for example, during an audit), contact Overvis support at support@overvis.com. Frequently Asked QuestionsSection titled “Frequently Asked Questions”My temperature parameter is not listed in the dialog. What should I do? Only tracked parameters appear in the selection lists. Make sure the parameter is configured as tracked in the device settings. Once it is tracked, Overvis will begin reading and storing its values, and it will appear in the HACCP parameter selection dialog. Equipment exceeds thresholds during defrost cycles. How do I handle this? Defrost cycles do not suppress threshold exception detection. If your equipment routinely exceeds thresholds during defrost, the report will show these as exceptions each time. You can document them with a standard corrective action note explaining that the deviation occurred during a planned defrost cycle. If defrost-related exceptions are expected and do not represent a food safety risk, consider adjusting the threshold values to account for normal defrost behavior, or leave the thresholds unconfigured for parameters where defrost spikes are routine. I submitted a reviewed report with incorrect information. Can I fix it? Reviewed reports are immutable and cannot be edited after submission. To correct the record, generate a new report for the same date range with the correct settings, add appropriate corrective action notes, and submit it for review. Organization owners can delete the incorrect reviewed report from the list. What happens if there is only one reading in a segment? All temperature value modes (Start of interval, average, minimum, maximum) return the same value when only one reading exists in the segment. The mode only affects the result when multiple readings fall within the same segment. How does daylight saving time affect the report? The report uses the organization’s configured timezone and handles DST transitions correctly. On days when clocks change, the number of segments may differ from other days — a 23-hour day will have fewer segments and a 25-hour day will have more. Segment boundaries always align to local clock time. Can I schedule automatic report generation? No. HACCP reports are generated on demand. You can save a template to speed up repeated configuration, but you must manually set the date range and click Generate report each time. How often should I generate reports? This depends on your HACCP plan requirements. Some facilities generate daily reports, others weekly. Use the date range and template features to match your review schedule. What if my device goes offline for an extended period? Missing readings are flagged as “unknown status/data” exceptions in the report. The exception summary will show the exact time intervals with missing data so you can investigate the cause and document corrective actions. If the equipment was intentionally turned off, configure the on/off parameter to avoid false alerts. Can multiple users work on corrective actions for the same report simultaneously? No. The generated report exists only in the browser of the user who generated it. Each user must generate their own instance of the report. Only one user can submit the report for review. What is the maximum date range I can report on? There is no fixed limit on the date range. The system enforces a total dataset size limit based on the combination of date range, interval size, and number of configured parameters. If the report would be too large, you will see an error message when attempting to generate. In that case, reduce the date range, use a longer interval, or split the report into multiple smaller reports. Can I attach supporting documents (photos, calibration certificates) to the report? Attachments are not supported directly in the HACCP report. If you need to include supporting documents, export the report to Excel and combine it with your attachments in your document management system. Similarly, if a reviewed report requires an electronic signature, export it to Excel and sign it through your organization’s electronic document system. How long are reviewed reports stored? Reviewed reports are stored indefinitely. They can be viewed, exported, and used for audits at any time. Organization owners can delete reviewed reports that are no longer needed; deleted reports can be restored by contacting Overvis support at support@overvis.com. GlossarySection titled “Glossary”
|
| |
|---|
VisualizationsVisualizations in Overvis Cloud are custom, interactive pages (HTML/SVG/JavaScript) that display the current state of your equipment and provide remote control capabilities. They are the same feature labeled Visualizations in the app navigation. While Overvis handles device connectivity, data collection, and alarm processing automatically, visualizations give you the flexibility to present this information exactly how you need it.
What Are Visualizations?Section titled “What Are Visualizations?”Visualizations are HTML/SVG/JavaScript code embedded into Overvis pages. You create the visual design using any vector graphics editor, export it as SVG, and then add special attributes to bind live data from your devices to the graphics. How They WorkSection titled “How They Work”The visualization engine:
PrerequisitesSection titled “Prerequisites”Before you start building visualizations, make sure you have the necessary tools and environment set up.
Getting StartedSection titled “Getting Started”This section walks you through creating your first visualization, from accessing the editor to displaying a simple example. Creating Your First VisualizationSection titled “Creating Your First Visualization”Navigate to the visualizations page in the Overvis menu. If you haven’t created any visualizations yet, the list will be empty.
Click Create new visualization to open the visualization editor:
The editor has two main fields:
A Simple ExampleSection titled “A Simple Example”Let’s start with a basic example to understand how it works:
After clicking “Create visualization” the result is:
You can even add it to the Dashboard in Overvis:
This visualization is static. To display actual device data, you need to use data bindings - special HTML/SVG attributes that connect visual elements to device parameters. Step-by-Step TutorialSection titled “Step-by-Step Tutorial”This tutorial walks through creating a complete visualization for refrigeration equipment monitoring. You’ll learn how to display live temperatures, add interactive setpoint controls, show alarm indicators, and implement toggle switches.
Step 1: Design the GraphicsSection titled “Step 1: Design the Graphics”Create the visualization design in your vector graphics editor. For this example, we’ll create a storage room layout with freezer units showing:
When designing your visualization, follow these guidelines: Use placeholder values. Insert representative placeholder values for all dynamic data. For temperatures expected to be negative with one decimal place, use “-12.3”. This helps with layout and positioning during design. Separate dynamic from static elements. Keep dynamic values as separate objects from static labels. For example, “-12.3” and “°C” should be separate text objects, so only the number gets updated with live data. Keep text as text. Don’t convert dynamic text elements to curves or paths. Static text can be converted to reduce file size, but dynamic elements must remain editable text. Use compatible fonts. Stick to web-safe fonts (Arial, Times New Roman, Courier) or use Droid Sans, which Overvis provides to all visualizations. Custom fonts require additional CSS configuration. Position everything upfront. Draw all elements in their final positions, including elements that will be hidden initially (like alarm indicators in both triggered and normal states, or switches in both on/off positions). Name your layers descriptively. Use clear layer names in your graphics editor. These names often become element IDs in the SVG, making it much easier to locate specific elements when adding data bindings.
Step 2: Export as SVGSection titled “Step 2: Export as SVG”Export your design as SVG with settings that preserve editability:
After exporting, open the SVG file in a text editor and remove the XML declaration and DOCTYPE tags at the beginning: These tags must be removed because the SVG will be embedded directly into an HTML page. Step 3: Upload the Static VisualizationSection titled “Step 3: Upload the Static Visualization”Copy the cleaned SVG code into the Overvis visualization editor and save it:
View the result to confirm the graphic displays correctly:
At this point, the visualization is purely visual with no live data. The next steps will add data bindings. Step 4: Prepare Device InformationSection titled “Step 4: Prepare Device Information”You’ll need the network controller MAC address and device addresses to create data bindings. Find these in your network settings:
In this example, the network MAC address is Step 5: Add Data BindingsSection titled “Step 5: Add Data Bindings”With the static visualization in place, you can now connect it to live device data by editing the SVG code and adding special attributes. Display Parameter ValuesSection titled “Display Parameter Values”To display a device parameter value as text, add the Find the text element in your SVG code (look for layer names you set earlier):
Modify the The
Replace the placeholder text content with a dash or other temporary indicator that displays until data loads. After updating all temperature displays, the visualization shows live data:
Data refreshes automatically every 10 seconds, or users can click the refresh icon for immediate updates. Add Interactive ControlsSection titled “Add Interactive Controls”To let users modify device parameters by clicking on values, combine
Modify the setpoint text element: The
Adding Show/Hide Elements ConditionallySection titled “Show/Hide Elements Conditionally”Use
Find the alarm indicator group in your SVG:
Modify the container The
Set the default
Change Colors Based on ValuesSection titled “Change Colors Based on Values”The same This reads bit 2 of register 500 from device 11. When the value is 0 (door open), the stroke color is red. When 1 (door closed), it’s green.
Create Toggle SwitchesSection titled “Create Toggle Switches”Combine Each state has
Store Custom TextSection titled “Store Custom Text”To allow users to edit labels or names that aren’t stored in device registers, use the visualization’s own database storage. First, enable this feature by adding an attribute to the root Then mark text elements that should be editable and stored: The
Step 6: Complete the VisualizationSection titled “Step 6: Complete the Visualization”Complete the visualization by adding the remaining data bindings. For the energy meter, display the value from the database rather than reading it directly from the device: Notice there’s no The completed visualization displays live equipment data, allows user interaction, and updates automatically:
Common TechniquesSection titled “Common Techniques”Configuration SettingsSection titled “Configuration Settings”You can configure visualization behavior by adding attributes to the first Available settings:
Database vs. Real-Time ReadsSection titled “Database vs. Real-Time Reads”By default, Use database reads (no
Use real-time reads (
Error CodesSection titled “Error Codes”If a parameter value cannot be retrieved, special error codes are displayed:
These codes help diagnose issues with data bindings and device connectivity. Available Click ActionsSection titled “Available Click Actions”The
The Custom FontsSection titled “Custom Fonts”While web-safe fonts and Droid Sans are available by default, you can add custom fonts with inline CSS: Responsive LayoutsSection titled “Responsive Layouts”Make visualizations adapt to different screen sizes by using percentage-based sizing and the Multiple Alarm IndicatorsSection titled “Multiple Alarm Indicators”When displaying multiple alarms simultaneously, create separate indicator elements for each alarm type and position them to avoid overlap. Use individual Advanced: JavaScript IntegrationSection titled “Advanced: JavaScript Integration”While data bindings handle most common scenarios, you can use JavaScript for advanced functionality. Visualizations run in the context of the Overvis web page, giving you access to the full browser API and Overvis-specific functions. Accessing the Overvis APISection titled “Accessing the Overvis API”To make authenticated API calls from your visualization, you need to include the session token. The token is stored in browser storage and accessible via JavaScript. Use the Handling Real-Time UpdatesSection titled “Handling Real-Time Updates”The Writing Parameter Values ProgrammaticallySection titled “Writing Parameter Values Programmatically”Use the Fetching Historical DataSection titled “Fetching Historical Data”To display charts or analyze trends, fetch historical readings from the API: Example: Google Maps IntegrationSection titled “Example: Google Maps Integration”You can embed interactive Google Maps to display equipment locations with real-time status indicators. Status IndicatorsSection titled “Status Indicators”The example uses color-coded markers:
You can customize marker appearance using custom icons, SVG graphics, or the Google Maps marker customization API. Common IssuesSection titled “Common Issues”Visualization doesn’t update Check that the refresh interval is configured correctly, verify parameter addresses match your device configuration, and confirm devices are online and responding. Use your browser’s developer console (F12) to check for JavaScript errors. Data shows error codes (NOLR, NOPR, NORV, etc.)
Interactive elements don’t work Verify Styling looks wrong Confirm your SVG export didn’t convert text to curves. Use inline styles within SVG elements to avoid conflicts with page CSS. Validate SVG structure using an SVG validator tool. Refresh is slower than expected If you’re reading many parameters with the Frequently Asked QuestionsSection titled “Frequently Asked Questions”Can I use external JavaScript libraries like Chart.js or D3.js? Yes. Include them via CDN in a Can I create multi-page visualizations? Visualizations are single-page by design, but you can simulate multiple pages using JavaScript to show/hide different sections, or create multiple separate visualizations and link between them using How do I debug visualization JavaScript? Use your browser’s Developer Tools (F12). Console logs, breakpoints, and network inspection work normally. Check the console for errors related to API calls or data binding issues. Can visualizations access data from multiple organizations? No. Each visualization belongs to one organization and can only access data from networks and devices within that organization. The API enforces this through authentication tokens. What’s the difference between parameter system ID and parameter address? Parameter address is the Modbus register address on the device (e.g., Can I style visualizations with custom CSS frameworks? Yes, but include the framework’s CSS file in a How do I handle time zones? All dates from the Overvis API are in UTC. Use JavaScript’s Technical ReferenceSection titled “Technical Reference”For complete technical details on all available attributes, parameter reference formats, and advanced options:
Related DocumentationSection titled “Related Documentation”
Get HelpSection titled “Get Help”If you need assistance creating Overvis visualizations, contact us at support@overvis.com. We’re happy to help with custom visualizations, answer questions about advanced features, or clarify documentation. |
| | ||||||||||||||||||||||||||||||||||||||||||||||||||||||||||||||||
|---|---|---|---|---|---|---|---|---|---|---|---|---|---|---|---|---|---|---|---|---|---|---|---|---|---|---|---|---|---|---|---|---|---|---|---|---|---|---|---|---|---|---|---|---|---|---|---|---|---|---|---|---|---|---|---|---|---|---|---|---|---|---|---|---|
Organizations & UsersOvervis Cloud uses organizations to separate equipment, data, and billing between different customers or projects. Each user account can belong to one or more organizations, and each membership has a specific role that determines what the user can do. OrganizationsSection titled “Organizations”An organization is the top-level container in Overvis. All networks, devices, parameters, alerts, visualizations, reports, and billing belong to a specific organization. Data is fully isolated between organizations — users only see the data of the organization they are currently working in. What an organization containsSection titled “What an organization contains”Each organization has:
Organization settingsSection titled “Organization settings”Organization owners and managers can edit the following settings. In the sidebar, this page is opened via Details under your organization name; the page title is Organization settings.
Owners additionally see member management options on the organization pages. How organizations are createdSection titled “How organizations are created”An organization is created automatically when you register a new Overvis account. The organization name is set during registration. If you leave it blank, the default name is derived from your email:
You always belong to at least one organization. If an owner removes you from an organization and you have no other memberships, a new empty organization is automatically created for you. Working with multiple organizationsSection titled “Working with multiple organizations”If you belong to several organizations (for example, as an owner of your own and as a viewer in a client’s organization), you work in one organization at a time. You can switch between them using the organization selector in the top navigation bar.
When you log in, Overvis automatically selects an organization where you have an owner or manager role. If you have no owner or manager role in any organization, the first available organization is selected. User AccountsSection titled “User Accounts”A user account represents one person. Each account has a unique email address and an auto-generated username, and belongs to one or more organizations. RegistrationSection titled “Registration”To create an account, go to the sign-up page and provide:
A username is generated automatically from your email address at registration. You can log in using either your email or username. If you received an invitation link, you can register through it — your account will be added to the inviting organization instead of creating a new one. You can log in at cloud.overvis.com using either your email or username along with your password. Email confirmationSection titled “Email confirmation”After registration or changing your email, you receive a confirmation email. You have 24 hours to confirm the new email address. During this grace period, the platform treats the email as confirmed and you can use all features normally. After 24 hours without confirmation, some actions (like managing devices or creating alerts) are restricted until you confirm your email. Account settingsSection titled “Account settings”
In your account settings (User settings > Personal info in the sidebar), you can change:
Additional account actions available from the sidebar:
The interface language is changed using the language switcher in the navigation bar (English, Ukrainian, Polish, Russian). This setting is saved to your account. Deleting your accountSection titled “Deleting your account”You can delete your account from User settings > Delete account. This permanently removes your user account, API keys, and associated data. Account deletion may be blocked in the following cases:
If you are the only member of an organization, that organization and all its networks and devices are deactivated upon account deletion. Roles and PermissionsSection titled “Roles and Permissions”Each organization membership has exactly one role. The role determines what the user can do within that organization. There are eight roles, split into two groups: full-interface roles (access the complete Overvis management interface) and monitor roles (access only the simplified monitoring interface at Full-interface rolesSection titled “Full-interface roles”These roles give access to the full Overvis management interface with varying levels of permissions. Owner is the highest role. An owner has full control over the organization, including:
Only owners can manage organization members. There is no limit on the number of owners per organization, but typically there is one. Manager has the same capabilities as the owner, except they cannot manage organization members. Managers can:
Technical Manager is similar to Manager but without billing or organization settings access. Technical managers can:
They cannot access billing or payment information, cannot manage members, and cannot edit organization settings. Operator can view data and send write commands to devices, but cannot change the organization structure. Operators can:
They cannot create, edit, or delete networks, devices, alerts, or other objects. Viewer has read-only access. Viewers can:
They cannot write to devices or modify anything. This role is useful for stakeholders, executives, or anyone who needs to see the data without changing it. Monitor rolesSection titled “Monitor roles”Monitor roles provide access to the simplified monitoring interface only (the Monitor Operator can view monitoring dashboards and send write commands to devices. Monitor Viewer has read-only access to monitoring dashboards. Monitor No Parameters can view monitoring dashboards but cannot see the parameters list. This role is only assignable by platform administrators and is not available in the standard invitation or member edit forms. Binding monitor users to a specific viewSection titled “Binding monitor users to a specific view”Monitor roles can optionally be bound to a specific visualization or resource report. When bound, the user is automatically redirected to that specific view when they log in or navigate outside allowed pages. This is useful for setting up a dedicated display screen that always shows one dashboard or report. A monitor user can be bound to either a visualization or a resource report, but not both. Permissions summarySection titled “Permissions summary”
Managing MembersSection titled “Managing Members”Only the organization owner can manage members — invite new users, change roles, or remove existing members. Inviting a new memberSection titled “Inviting a new member”
To invite someone to your organization:
The invited person receives an email with a link. The link is valid for 2 days. If they already have an Overvis account, they will be asked to log in and then the invitation is applied. If they don’t have an account, they are taken to the registration page first. You cannot invite someone directly as an Owner — ownership can only be assigned by editing an existing member’s role. Viewing membersSection titled “Viewing members”
Go to Organization > Members to see all current members and pending invitations. Each entry shows the member’s name (or email if no name is set), their role, and management actions. Changing a member’s roleSection titled “Changing a member’s role”
To change a member’s role:
Changes take effect immediately. This is the only way to grant the Owner role to another user — by editing their existing membership. Removing a memberSection titled “Removing a member”To remove a member from your organization:
The removed user loses access to the organization immediately and receives an email notification. If they have no other organization memberships, a new empty organization is created for their account automatically. You cannot remove yourself from the organization through the member management interface. API KeysSection titled “API Keys”API keys provide programmatic access to the Overvis REST API. They belong to your user account (not to a specific organization) and inherit all your organization memberships and roles.
Creating an API keySection titled “Creating an API key”
You can have up to 10 API keys per account. Authenticating with an API keySection titled “Authenticating with an API key”To use the API, first authenticate by sending a POST request: The response contains a session token and its expiration time. Use this token to authenticate subsequent API requests. The token expires after a period of inactivity — each API request extends the token’s lifetime automatically. Managing API keysSection titled “Managing API keys”From the User settings > API Keys page you can:
TroubleshootingSection titled “Troubleshooting”I didn’t receive the confirmation emailSection titled “I didn’t receive the confirmation email”
My email confirmation expiredSection titled “My email confirmation expired”If more than 24 hours have passed since registration or email change without confirming, your access to most features is restricted. Go to User settings > Change email, re-enter your email address, and a new confirmation email will be sent. You get another 24-hour window to confirm. I can’t access billing or organization settingsSection titled “I can’t access billing or organization settings”Only owners and managers can access billing information and edit organization settings. If you need access, ask the organization owner to change your role. You can check your current role in the top navigation bar next to the organization name. I can’t invite or remove membersSection titled “I can’t invite or remove members”Member management (inviting, editing roles, and removing members) is restricted to the owner role. Managers and other roles cannot manage members. If you need to invite someone, ask the organization owner. The invitation link has expiredSection titled “The invitation link has expired”Invitation links are valid for 2 days. If the link has expired, ask the organization owner to send a new invitation. The old invitation can be deleted from the members page. I was removed from an organization and lost my dataSection titled “I was removed from an organization and lost my data”When you are removed from an organization, you lose access to that organization’s data. The data itself is not deleted — other organization members still have access. If you were removed by mistake, ask the organization owner to re-invite you. If you had no other organization memberships, a new empty organization was created for your account automatically. I can’t delete my accountSection titled “I can’t delete my account”Account deletion is blocked if:
A monitor user sees the wrong pageSection titled “A monitor user sees the wrong page”If a monitor user is bound to a specific visualization or resource report, they are automatically redirected to that view. To change or remove the binding, the organization owner should edit the member’s settings and update the bound visualization or report. Common QuestionsSection titled “Common Questions”Can I belong to multiple organizations?Section titled “Can I belong to multiple organizations?”Yes. You can be a member of as many organizations as needed, with a different role in each. Use the organization switcher in the top navigation bar to switch between them. Each organization’s data, billing, and settings are completely separate. Can an organization have multiple owners?Section titled “Can an organization have multiple owners?”Yes. There is no limit on the number of owners. However, most organizations have one owner. To make another member an owner, the current owner edits their role from the members page. How do I transfer ownership of an organization?Section titled “How do I transfer ownership of an organization?”There is no dedicated “transfer ownership” action. To transfer ownership:
What happens if I’m the only owner and I leave?Section titled “What happens if I’m the only owner and I leave?”You cannot remove yourself from an organization through the member management interface. If you want to leave, first assign the Owner role to another member, then ask them to remove you. What is the difference between Operator and Monitor Operator?Section titled “What is the difference between Operator and Monitor Operator?”Both can view data and send write commands to devices. The difference is in the interface they access:
Can I change the interface language?Section titled “Can I change the interface language?”Yes. Use the language switcher in the navigation bar to change the interface language. Available languages: English, Ukrainian, Polish, Russian. This setting is saved to your account and applies on your next login. What is the notification language?Section titled “What is the notification language?”The notification language is an organization-level setting that controls the language of automated emails and SMS (alert notifications, system messages). It is separate from your personal interface language. Owners and managers can change it in Organization > Settings. How do API keys relate to organizations?Section titled “How do API keys relate to organizations?”API keys belong to your user account, not to a specific organization. When you authenticate with an API key, you get a session that has access to all organizations where your account is a member, with the same roles and permissions as your user account. Related DocumentationSection titled “Related Documentation”
|
| | ||||||||||||||||||||||||||
|---|---|---|---|---|---|---|---|---|---|---|---|---|---|---|---|---|---|---|---|---|---|---|---|---|---|---|
BillingOvervis Cloud uses a prepaid balance model. Your organization has an account balance in EUR, and the system deducts the cost of services from it automatically each day. When the balance runs low, you receive email warnings. When it is exhausted, all your networks are disabled until the balance is replenished. There are no subscription tiers or monthly plans — you pay only for the services you use. The billing pages are available to organization managers (owners and managers); viewers do not have access. How Pricing WorksSection titled “How Pricing Works”Overvis charges for the following services:
The daily network processing charge is deducted once per day for the previous day’s service. If a network was enabled for any part of the previous calendar day, a charge is applied. All prices are net (VAT excluded). See the Overvis pricing page for full pricing details. Account BalanceSection titled “Account Balance”Each organization has two balances:
Both balances are visible in the sidebar of every page. Click the Account balance area in the sidebar to open a dropdown menu with quick links to:
Topping Up Your BalanceSection titled “Topping Up Your Balance”Navigate to Top Up Balance from the sidebar balance menu. The top-up page shows your current account and bonus balances, a link to the pricing page, and a link to the account balance report.
Online card payment (Visa/MasterCard)Section titled “Online card payment (Visa/MasterCard)”Enter the desired amount in EUR (minimum €1) and click Topup. You will be redirected to a secure payment page powered by Stripe. After a successful payment:
The maximum top-up amount depends on your current account balance — the system caps the total account balance at a configured limit (e.g. €1,000). If your current balance is already near this limit, the available top-up amount will be reduced accordingly, and the card top-up form may be temporarily unavailable. Cash or bank transferSection titled “Cash or bank transfer”For payments by bank transfer or cash, contact your assigned personal manager (shown on the page if assigned) or Overvis support. The support contact details are displayed on the top-up page. Account Balance ReportSection titled “Account Balance Report”The Account Balance Report page (accessible from the sidebar balance menu) is the central place for understanding your expenses. It has two main sections: estimated expenses and expenses history. Estimated expensesSection titled “Estimated expenses”This section shows a projection of your upcoming charges based on currently enabled networks. It is displayed as a table with three tabs:
For each network, the table shows:
A totals row at the bottom sums all networks. Expenses historySection titled “Expenses history”Below the estimates, a monthly expenses history table shows all actual charges and credits for a selected month. Use the Month dropdown to switch between months (data is available from the month your organization’s first charge occurred).
Rows are grouped by category. Click on a category row to expand it and see individual records:
Each row shows four columns:
At the bottom of the table, the report shows:
Payment HistorySection titled “Payment History”The Payment History page shows a list of all payment receipts for your organization. Each entry includes:
Click the .PDF link next to any payment to download the receipt document.
Low Balance NotificationsSection titled “Low Balance Notifications”The system monitors your balance and sends email notifications when it drops below certain thresholds. Notifications are sent when your remaining balance can cover approximately 30 days, 10 days, and 5 days of service at the current daily rate. When the balance is fully exhausted (reaches zero or below), a final balance exhausted email is sent with a direct link to the top-up page. You can configure who receives billing notifications by setting the billing email in organization settings. What happens when the balance runs outSection titled “What happens when the balance runs out”If your organization’s balance (account + bonus) drops to zero or below during the daily billing run:
Historical data remains safely stored according to your organization’s data retention settings, even after networks are disabled. To restore service: top up your account balance. Once the balance is positive again, re-enable your networks manually from the network settings page. The system does not re-enable them automatically. Discount CodesSection titled “Discount Codes”Overvis supports promotional and referral discount codes that reduce the daily network processing rate. A discount code is applied to a specific network and sets a custom (lower) cost per day for that network. Discount codes have the following properties:
When a discount code expires, the network’s daily rate is automatically reset to the default rate. Referral cashbackSection titled “Referral cashback”Some discount codes include a referral cashback — a daily credit paid to the referring organization’s account balance for each day the referred network is active. The cashback is calculated from the non-bonus portion of the daily charge only. Cashback entries appear in the Account Balance Report under the Cashback category. Billing InformationSection titled “Billing Information”Organization settings include a Billing Information section where managers can provide details used on receipts and invoices:
To update these fields, go to Organization settings (click the organization name in the sidebar, then Organization settings) and scroll to the Billing Information section.
TroubleshootingSection titled “Troubleshooting”My networks were disabled unexpectedlySection titled “My networks were disabled unexpectedly”Your organization’s balance (account + bonus) dropped to zero or below during the daily billing run. The system automatically disables all networks when the balance is exhausted. Solution: Check the Account Balance Report to see the charges that led to the zero balance. Top up your balance and manually re-enable your networks from each network’s settings page. Card payment is not going throughSection titled “Card payment is not going through”Possible causes:
Solution: Try a smaller amount. If the card form is unavailable, use bank transfer or contact support. I don’t see billing pages or the balance in the sidebarSection titled “I don’t see billing pages or the balance in the sidebar”Only organization managers (owners and managers) have access to billing pages. If you are a viewer, the balance display and billing menu are not shown. Solution: Ask an organization manager to upgrade your role, or contact support. Balance is being charged but I disabled my networkSection titled “Balance is being charged but I disabled my network”The daily charge covers the previous calendar day. If your network was enabled for any part of yesterday, a charge will appear today. After disabling a network, you may see one final charge the following day. Solution: This is expected behavior. No further charges will appear for this network after the final day’s charge. SMS notifications stopped workingSection titled “SMS notifications stopped working”SMS notifications require sufficient balance. When the balance is too low, SMS sending is blocked. Solution: Check your balance and top up if needed. Verify that the SMS notification is still configured in your alert settings. You can switch to email notifications, which are free and unlimited. Balance dropped faster than expectedSection titled “Balance dropped faster than expected”Possible causes:
Solution: Open the Account Balance Report, select the month in question, and expand the SMS notifications and Network processing categories to see individual charges. Common QuestionsSection titled “Common Questions”When exactly are daily charges applied?Section titled “When exactly are daily charges applied?”The billing system runs once per day and charges each enabled network for the previous calendar day’s service. The exact time of the billing run may vary, but charges always appear for the previous day. Can I get a refund for unused account balance?Section titled “Can I get a refund for unused account balance?”Contact Overvis support regarding refunds for account balance. Bonus balance (such as the registration bonus) is non-refundable. How do I see what I was charged for?Section titled “How do I see what I was charged for?”Go to the Account Balance Report from the sidebar balance menu. The Expenses history section shows all charges grouped by category. Click on any category row to expand it and see individual records with dates and amounts. Will I lose my data if my balance runs out?Section titled “Will I lose my data if my balance runs out?”No. When the balance runs out, networks are disabled and stop collecting new data, but all previously recorded data remains stored according to your organization’s data retention settings. Once you top up and re-enable your networks, data collection resumes. Can I pause billing temporarily?Section titled “Can I pause billing temporarily?”You can disable individual networks from their settings page. Disabled networks do not incur daily processing charges. Your data, device configurations, and alert settings remain intact. Re-enable the network at any time to resume service. How do I apply a discount code?Section titled “How do I apply a discount code?”Discount codes are applied per network. Open the network details page and click Apply discount code. Enter the code, review the price change on the confirmation page, and click Confirm. Once applied, the code and its effect on pricing are shown on the network details page. You can remove a manually applied code at any time from the same page. Why is the top-up form showing a lower maximum than expected?Section titled “Why is the top-up form showing a lower maximum than expected?”The maximum top-up amount is calculated as the configured limit minus your current account balance. For example, if the limit is €1,000 and your current balance is €800, you can top up at most €200. How are SMS costs determined?Section titled “How are SMS costs determined?”SMS costs depend on the destination phone number’s country. The cost per message is deducted from your balance at the time the SMS is sent. You can see all SMS charges itemized in the Account Balance Report under the SMS notifications category. Related DocumentationSection titled “Related Documentation”
|
| | ||||||||||||||||||||||||||||||||||||
|---|---|---|---|---|---|---|---|---|---|---|---|---|---|---|---|---|---|---|---|---|---|---|---|---|---|---|---|---|---|---|---|---|---|---|---|---|
API ReferenceBasicsSection titled “Basics”Overvis provides REST-like HTTP API with request payload and response encoded in JSON format. Base API URL is All API requests require All POST requests require HTTP payload to be a UTF-8 encoded plain-text with semantically-correct
JSON content. Empty payload is not allowed for AuthenticationSection titled “Authentication”All requests except Authorization HTTP header has the following format: Here Session token expires after 1 hour and is not automatically prolonged when being used. ErrorsSection titled “Errors”All requests return HTTP status code
Common errorsSection titled “Common errors”These errors can be returned by any endpoint:
All dates in all API requests and responses use ISO 8601 format with or without microseconds. All dates returned in responses are in UTC. Example: EndpointsSection titled “Endpoints”
Section titled “POST /activation-code/:code/get-info/ - Get Activation Code Info” |
| | ||||||||||||||||||||||||||||||||||||||||||||||||||||||||||||||||||||||||||||||||||||||||||||||||||||||||||||||||||||||||||||||||||||||||||||||||||||||||||||||||||||||||||||||||||||||||||||||||||||||||||||||||||||||||||||||||||||||||||||||||||
|---|---|---|---|---|---|---|---|---|---|---|---|---|---|---|---|---|---|---|---|---|---|---|---|---|---|---|---|---|---|---|---|---|---|---|---|---|---|---|---|---|---|---|---|---|---|---|---|---|---|---|---|---|---|---|---|---|---|---|---|---|---|---|---|---|---|---|---|---|---|---|---|---|---|---|---|---|---|---|---|---|---|---|---|---|---|---|---|---|---|---|---|---|---|---|---|---|---|---|---|---|---|---|---|---|---|---|---|---|---|---|---|---|---|---|---|---|---|---|---|---|---|---|---|---|---|---|---|---|---|---|---|---|---|---|---|---|---|---|---|---|---|---|---|---|---|---|---|---|---|---|---|---|---|---|---|---|---|---|---|---|---|---|---|---|---|---|---|---|---|---|---|---|---|---|---|---|---|---|---|---|---|---|---|---|---|---|---|---|---|---|---|---|---|---|---|---|---|---|---|---|---|---|---|---|---|---|---|---|---|---|---|---|---|---|---|---|---|---|---|---|---|---|---|---|---|---|---|---|---|---|---|---|---|---|---|---|---|---|---|---|---|---|
Device Templates ReferenceThis reference covers the technical specification of the device template Excel file format used for import and export in Overvis Cloud. For a general overview of how templates work, see the Device Templates guide. File formatSection titled “File format”Device templates use the Microsoft Excel A template workbook contains two required sheets and two optional sheets. The sheet names are exact and case-sensitive — any unrecognized sheet name causes an import error.
Info sheetSection titled “Info sheet”The Info sheet stores device-level metadata and communication defaults. Values are read from fixed cell positions (not by column headers).
Description is stored in column D (4), starting from row 2. If the description is longer than 32,000 characters, it is split across multiple cells in that column (row 2, row 3, etc.). On import, all cells in column D below row 1 are concatenated. Field detailsSection titled “Field details”Template name (row 2) is the primary identifier. Together with manufacturer and version, it forms a unique identity within a scope (global or per-organization). Importing a template with the same name+manufacturer+version as an existing one in your organization replaces the existing template. Read group size controls how many consecutive Modbus registers Overvis combines into a single read request. A value of Write function determines which Modbus function code is used when writing parameter values:
Params sheetSection titled “Params sheet”The Params sheet defines all device parameters. Row 1 is the header row; data starts from row 2. Columns are matched by header name (not by position), so column order does not matter. Required columnsSection titled “Required columns”Every parameter row must provide values for these columns. Missing values cause an import error for that row.
Optional columnsSection titled “Optional columns”
Translation columnsSection titled “Translation columns”Parameter text fields can be translated into additional languages. Add translation columns by appending a space and a language code to the base column name:
Supported language codes: A translation column requires the corresponding English column to have a non-empty value in the same row. You cannot translate an empty field. Enumeration translations use a separate column format — see Enumeration translations. Value typesSection titled “Value types”The Type column specifies how raw register bytes are interpreted. The value must exactly match one of the identifiers below. Integer typesSection titled “Integer types”
Floating-point typesSection titled “Floating-point types”
Bit typesSection titled “Bit types”
For String and special typesSection titled “String and special types”
Enumeration typeSection titled “Enumeration type”
Byte order conventionsSection titled “Byte order conventions”For multi-register types, the suffix indicates byte order:
Multiplier and shift restrictionsSection titled “Multiplier and shift restrictions”The following types do not support multiplier or shift values: Enumerations and representationsSection titled “Enumerations and representations”The Represent As column serves two purposes depending on the value type. For Section titled “For enum type: enumeration mappings” |
| | ||||||||||||||||||||||||||||||||||||||||||||||||||||||||||||||||||||||||||||||||||||||||||||||||||||||||||||||||
|---|---|---|---|---|---|---|---|---|---|---|---|---|---|---|---|---|---|---|---|---|---|---|---|---|---|---|---|---|---|---|---|---|---|---|---|---|---|---|---|---|---|---|---|---|---|---|---|---|---|---|---|---|---|---|---|---|---|---|---|---|---|---|---|---|---|---|---|---|---|---|---|---|---|---|---|---|---|---|---|---|---|---|---|---|---|---|---|---|---|---|---|---|---|---|---|---|---|---|---|---|---|---|---|---|---|---|---|---|---|---|---|---|
Visualizations ReferenceOvervis visualization source code is an HTML snippet. This snippet code is not processed on the
server-side and is embedded inside the Overvis page HTML as-is. It can contain JavaScript inside
There are several extension tags and attributes that are added by the JavaScript to the Overvis page for simplifying visualization data binding. The following reference will list all such additions. Visualization code is not required to use them and can directly call Overvis API instead. In the reference below, the following syntax: Refresh processSection titled “Refresh process”After the visualization is loaded, it gathers all used data bindings from the source code and starts the automatic data refresh process. Visualization data is being refreshed every 10 seconds by default. The next refresh cycle doesn’t start before the previous one is finished. The length of the refresh cycle depends on how many parameters are being read from the devices and the connection quality. So, if there are many parameter readings to be requested at once from the slow channel, the refresh cycle may take more time than planned. To optimize the refresh cycle time, prefer loading parameter values from the Overvis database instead of reading them from the devices directly. Visualization settingsSection titled “Visualization settings”The first
Additional JavaScript functionsSection titled “Additional JavaScript functions”Those functions are added to the global
Referencing objectsSection titled “Referencing objects”All referenced objects should exist in Overvis. For example, you can’t reference the network by IP/MAC address if the network with this IP or MAC is not created under your account. Networks can be referenced in one of the following ways:Section titled “Networks can be referenced in one of the following ways:”
Devices can be referenced in one of the following ways:Section titled “Devices can be referenced in one of the following ways:”
Device parameters can be referenced in one of the following ways:Section titled “Device parameters can be referenced in one of the following ways:”
Parameter address has the following extended syntax:
Few examples:
Visualizations can be referenced in one of the following ways:Section titled “Visualizations can be referenced in one of the following ways:”
Display parameter value: Section titled “Display parameter value: param-value="..." attribute” |
| Example | Description |
|---|---|
<div param-value="12-34-56-78-90-ab>111>123">loading...</div> | Placeholder text loading... will be replaced with the value of parameter 123 of the device 111 in the network 12-34-56-78-90-ab. Value will be taken from the database, so this parameter should be marked as tracked in the system. |
<div param-value="12-34-56-78-90-ab>111>123:r" /> | The value of the parameter will be read from the device on each refresh. The parameter can be untracked. |
<div param-value="12-34-56-78-90-ab>111>123:r,p3" /> | Real-time value of the parameter with 3-digits precision. |
<div param-value="12-34-56-78-90-ab>111>123" param-value-mod="x*2+1" /> | The value of the parameter will be multiplied by 2 and increased by 1. |
By default, the value of the parameter is taken from the Overvis database, not read from the device. This makes visualization refresh much faster, but it has the following consequences:
NOLR will be displayed instead.If you want to perform an actual reading of the device parameter, set the :r option at the end.
In this case:
NORV is displayed.Several special codes are returned by the server on various exceptions. You may see them instead of the parameter value:
NON - parameter network does not exist.NOP - parameter does not exist.NOLR - no last reading for the parameter in the database (parameter has never been read). That
usually means that this parameter is untracked. Mark it as tracked or use real-time value
reading.NORV - error reading parameter value from the device. Try reading it on the device parameters
list page to see the actual error.on-param-value="..." attributeAny tag in HTML/SVG code has an additional possible attribute:
on-param-value="{{paramref}}:{{condition}}:{{property}}:{{valueOn}}:{{valueOff}}:{{options}}"This attribute toggles the property or style specified by {{property}} between {{valueOn}} and
{{valueOff}} depending if the parameter referenced by {{paramRef}} satisfies the
{{condition}}.
{{condition}} can be one of the following:
>value<value=value!=value>=value<=value{evalExpr} where evalExpr in curly braces can be any boolean JS expression with current
parameter value provided as x. See examples below.If the condition is satisfied, the property and the style by the name provided by {{property}}
will be set to {{valueOn}}. Otherwise it will be set to {{valueOff}}.
{{options}} is a comma-separated list of flags. Currently supported flags:
r - read data directly from the device. By default it is taken from Overvis database of last
known parameter values.Few examples:
| Example | Description |
|---|---|
<div on-param-value="12-34-56-78-90-ab>111>123:>10:color:red:green">pressure</div> | Set text style color to red if the parameter value is greater than 10. Otherwise - green. Value is taken from the Overvis database, so the parameter should be tracked. |
<div on-param-value="12-34-56-78-90-ab>111>123:<20:display:block:none:r">alert!</div> | Text "alert!" will be visible if the parameter value is less than 20. The value is read from the device in real-time. By default (until the value is loaded), the text is hidden. |
<text on-param-value="12-34-56-78-90-ab>111>123:{x<10||x>20}:color:red:green:r">pressure</text> | If the parameter value is less than 10 or larger than 20, the text "pressure" will be displayed in red. |
on-net-connection="..." attributeAny tag in HTML/SVG code has an additional possible attribute:
on-net-connection="{{netRef}}:{{property}}:{{valueOn}}:{{valueOff}}"This attribute toggles the property or style specified by {{property}} between {{valueOn}} and
{{valueOff}} depending if the network referenced by {{netRef}} has connection or not.
Example:
| Example | Description |
|---|---|
<div on-net-connection="12-34-56-78-90-ab:display:none:block">disconnected!</div> | The text "disconnected!" will be visible only if the connection with the network that has MAC address 12-34-56-78-90-ab is lost. |
on-click="..." attributeAny interactable tag in HTML/SVG code has an additional possible attribute:
on-click="{{action}}"It specifies the action which should be taken when user clicks or taps on this element.
{{action}} can be one of the following:
goto:param:{{paramRef}}
Open the history of the parameter readings.
goto:params:{{paramRef}},{{paramRef}},...
Open the comparison of the parameter readings.
goto:device:{{deviceRef}}
Open the device parameters list page.
goto:network:{{networkRef}}
Open the network page.
goto:vis:{{visualizationRef}}
Open the visualization.
toggle-param:{{paramRef}}:{{defaultValue}}:{{valueOn}}:{{options}}
If the parameter {{paramRef}} has the value different from {{defaultValue}} it should be set
to {{defaultValue}}, otherwise {{valueOn}}.
Example: <button on-click="toggle-param:12-34-56-78-90-ab>1>123:0:1:g">Toggle power</button> -
toggle parameter 123 between 0 and 1, where 0 is the default value. After the toggle, full
visualization refresh is done (because of the :g option at the end).
edit-param:{{paramRef}}:{{options}}
Open the dialog window to edit and save the value of the parameter.
increment-param:{{paramRef}}:{{amount}}:{{options}}
Add {{amount}} to the value of the parameter {{paramRef}} and save the new value. Amount can
be negative. The parameter is refreshed before being incremented and written to the device.
edit-visdata:{{key}}
Open the dialog window to edit and save the visualization string with the key {{key}}. See
visualization strings table.
{{options}} is a comma-separated list of flags. Currently supported flags:
g - after the action is completed, do a complete refresh of all visualization data. If omitted,
by default - only the affected parameters will be refreshed.<alias> tagAn additional tag can be used anywhere in the code:
<alias name="{{aliasName}}" ... />Alias tag should contain name attribute which specifies the name of the alias and one of the
following attributes which specifies the alias target:
network="{{networkRef}}"device="{{deviceRef}}"param="{{paramRef}}"vis="{{visualizationRef}}"Aliases are used when the object has to be referenced several times in the code. It helps to make the references more understandable by giving them names. Also, it allows to quickly change the target object, for example, if the network controller was replaced and the network MAC was changed.
Aliases can be used in references by specifying alias name after ~ (tilde symbol). Also, aliases
can be used inside other aliases, e.g. network alias can be used inside the device alias.
Example code:
<alias name="mainRoomNetwork" network="12-34-56-78-90-ab" /><alias name="mainRoomEM482" device="~mainRoomNetwork>111" /><div>Automation cycles:</div><div param-value="~mainRoomEM482>5000">-</div>Visualizations can store string values to the Overvis database as key-value pairs. All stored
values are loaded during the visualization start-up if use-vis-data="yes" specified in
visualization settings tag.
To edit the value, use Overvis API. Also, the value can be edited by the user through the dialog
window. To open the dialog window, add the on-click="edit-visdata:{{key}}" attribute to the
button.
The following attribute allows you to use stored strings.
text-replacement="..." attributeAny container tag in HTML/SVG code has the additional possible attribute:
text-replacement="{{key}}"It specifies that the content of the tag should be replaced with the stored string with the key
{{key}}.
Example:
<svg use-vis-data="yes"> <text text-replacement="room-name">Main room</text> <text on-click="edit-visdata:room-name">Edit</text></svg>This example shows the room name as "Main room" by default, but also allows to edit it by
clicking on the "Edit". Edit will persist between page refreshes and different accounts accessing
this visualization.
| | ||||||||||||||||||||||||||||||||||||||||||||||||||||||||||||||||||||||||
|---|---|---|---|---|---|---|---|---|---|---|---|---|---|---|---|---|---|---|---|---|---|---|---|---|---|---|---|---|---|---|---|---|---|---|---|---|---|---|---|---|---|---|---|---|---|---|---|---|---|---|---|---|---|---|---|---|---|---|---|---|---|---|---|---|---|---|---|---|---|---|---|---|
Alerts Templates ReferenceIntroductionSection titled “Introduction”A device template can include an alert template — a YAML definition of alerts that Overvis creates automatically when the template is applied to a device. This lets you ship standard monitoring rules (temperature limits, connection loss detection, etc.) together with the parameter configuration. When applying a template, the user controls how alerts are handled — add new alerts, replace existing ones, or skip alert creation entirely. See Applying a template — Apply options for details. After creation, the alerts are independent and can be freely customized. How to add alert template to the device templateSection titled “How to add alert template to the device template”Documentation bellow assumes that you are changing one of the templates owned by your organization. If you want to modify the global template, accessible to all Overvis users, you have to copy it under your account. To do this, just download the template as an Excel file and upload it to your templates. Manually created templates can be found in the local device template library. To access it, click on the “Your templates” link under the “Templates” section in the navigation. Find the device template you want to modify and click the gear icon on the left to access the template settings. On the settings page, scroll down until you find the “Alarms template YAML” textbox. Put the template code inside that box. The structure of this YAML is described in a later section of this document. Save the changes. If the alerts template interpreter will encounter any errors it will report the details below the field. Alerts template syntax referenceSection titled “Alerts template syntax reference”Alerts template conform to YAML syntax (https://en.wikipedia.org/wiki/YAML). Basic example of the template: EventsSection titled “Events”Top level should contain a list of event objects. Each event object should contain following fields:
ConditionsSection titled “Conditions”Each event should contain one or more conditions (specified in the “conditions” field). Conditions determine when this event starts and resolves. Each condition is described as an object with following fields:
Where “register kind” is one of:
Examples of the condition objects:
ActionsSection titled “Actions”Each event should have one or more actions (specified in the “actions” field). Actions determine how the system should behave during each stage of the event. Each action corresponds to the one of the four “stages”:
Each action is described as an object with the following fields:
Where to put the alert YAMLSection titled “Where to put the alert YAML”There are two ways to attach alert YAML to a device template:
Related documentationSection titled “Related documentation”
|